Combining Music and Indoor Spatial Factors Helps to Improve College Students' Emotion During Communication
←
→
Page content transcription
If your browser does not render page correctly, please read the page content below
ORIGINAL RESEARCH
                                                                                                                                        published: 14 September 2021
                                                                                                                                     doi: 10.3389/fpsyg.2021.703908

                                                Combining Music and Indoor Spatial
                                                Factors Helps to Improve College
                                                Students’ Emotion During
                                                Communication
                                                Jiani Jiang, Qi Meng* and Jingtao Ji

                                                Key Laboratory of Cold Region Urban and Rural Human Settlement Environment Science and Technology, Ministry of
                                                Industry and Information Technology, School of Architecture, Harbin Institute of Technology, Harbin, China

                                                Against the background of weakening face-to-face social interaction, the mental health
                                                of college students deserves attention. There are few existing studies on the impact of
                                                audiovisual interaction on interactive behavior, especially emotional perception in specific
                                                spaces. This study aims to indicate whether the perception of one’s music environment
                                                has influence on college students’ emotion during communication in different indoor
                           Edited by:           conditions including spatial function, visual and sound atmospheres, and interior
                     Francesco Aletta,          furnishings. The three-dimensional pleasure–arousal–dominance (PAD) emotional model
           University College London,
                      United Kingdom            was used to evaluate the changes of emotions before and after communication. An
                       Reviewed by:             acoustic environmental measurement was performed and the evaluations of emotion
                         Andre Fiebig,          during communication was investigated by a questionnaire survey with 331 participants
         Technical University of Berlin,
                                                at six experimental sites [including a classroom (CR), a learning corridor (LC), a coffee
                             Germany
                     Simone Torresin,           shop (CS), a fast food restaurant (FFR), a dormitory (DT), and a living room(LR)], the
             University of Trento, Italy        following results were found: Firstly, the results in different functional spaces showed no
                  *Correspondence:              significant effect of music on communication or emotional states during communication.
                           Qi Meng
                   mengq@hit.edu.cn             Secondly, the average score of the musical evaluation was 1.09 higher in the warm-toned
                                                space compared to the cold-toned space. Thirdly, the differences in the effects of music
                   Specialty section:           on emotion during communication in different sound environments were significant and
         This article was submitted to
           Environmental Psychology,            pleasure, arousal, and dominance could be efficiently enhanced by music in the quiet
               a section of the journal         space. Fourthly, dominance was 0.63 higher in the minimally furnished space. Finally,
               Frontiers in Psychology
                                                we also investigated influence of social characteristics on the effect of music on
            Received: 18 May 2021
                                                communication in different indoor spaces, in terms of the intimacy level, the gender
        Accepted: 10 August 2021
     Published: 14 September 2021               combination, and the group size. For instance, when there are more than two communicators
                           Citation:            in the dining space, pleasure and arousal can be efficiently enhanced by music. This study
    Jiang J, Meng Q and Ji J (2021)             shows that combining the sound environment with spatial factors (for example, the visual
 Combining Music and Indoor Spatial
   Factors Helps to Improve College             and sound atmosphere) and the interior furnishings can be an effective design strategy
           Students’ Emotion During             for promoting social interaction in indoor spaces.
                    Communication.
         Front. Psychol. 12:703908.             Keywords: social interaction, college students, audiovisual interaction, music, emotion during communication,
   doi: 10.3389/fpsyg.2021.703908               pleasure-arousal-dominance emotional state model, spatial factors, social characteristics

Frontiers in Psychology | www.frontiersin.org                                        1                                     September 2021 | Volume 12 | Article 703908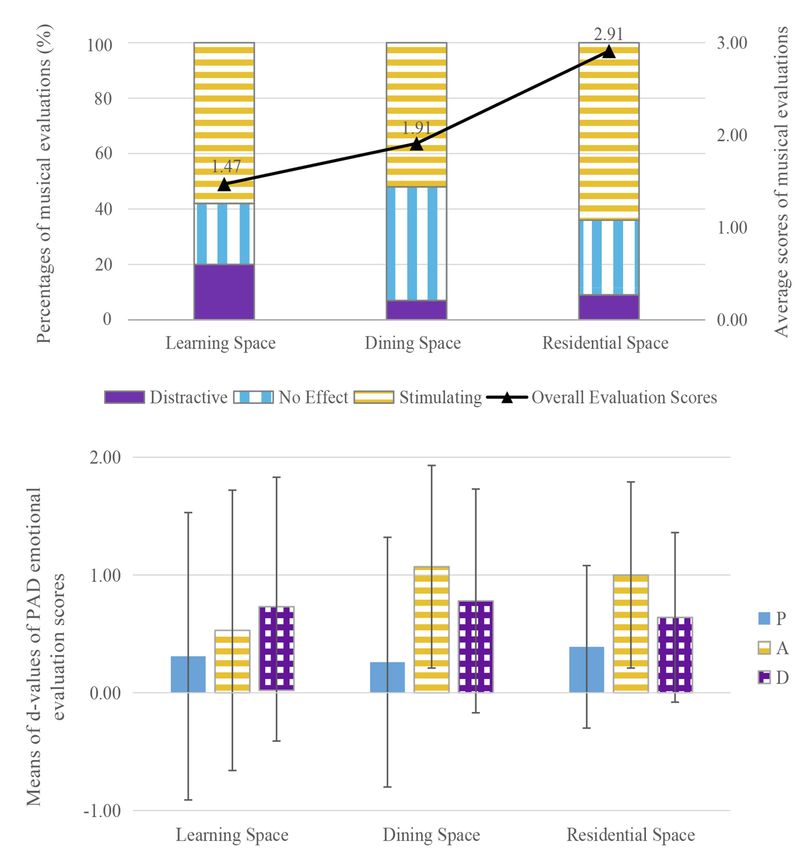
Jiang et al.                                                                                              Musical Effects on Communication Emotion

INTRODUCTION                                                              including luminous, thermal, and acoustic factors. In terms
                                                                          of acoustic perception, the soundscape is defined as a sonic
There has been a weakening of social interaction among                    environment, with an emphasis on the way it is perceived
contemporary college students, many of whom prefer chatting               and understood by individuals or by society (Brown et al.,
online as opposed to face-to-face communication. According                2011). Evaluations of stimuli indicate that human emotions
to The 47th China statistical report on Internet Development              track changes in environmental sounds, especially in speech
(2021), by December 2020, netizens aged 20–29 accounted for               and music (Ma and Thompson, 2016). As a specific sound
17.8% of total users, and students accounted for the highest              source, music has been found to be beneficial for rewards,
proportion in the occupational structure. College is a period             motivation, pleasure, stress, arousal, immunity, and social
characterized by dynamic development of the brain and strong              affiliations (Juslin and Västfjäll, 2008; Chanda and Levitin,
interactions within the social environment. Students are                  2013). Evidence against a strict cognitivist position suggests
vulnerable to a range of psychological problems; three-quarters           that music can induce some sort of emotional response (Hunter
of cases of four common mental disorders begin between the                and Schellenberg, 2010), which can be categorized as one of
ages of 20 and 30 (Patel et al., 2007; Mirón et al., 2019).               the nine common emotions of wonder, transcendence, tenderness,
Research has shown that social anxiety is a significant and               sadness, nostalgia, peacefulness, power, joy, and tension (Huron,
common issue for college students, given the growing range                2011). Previous studies have found a modulation of the activities
of academic and social stressors (Evans et al., 2018; Yang et al.,        of the brain’s core structures ascribed to emotion processing
2019). Addiction to online networks can impair social activities,         by music, involving the amygdala and the hippocampus, which
work/study, interpersonal relationships, and/or psychological             are central elements in the network that process emotions
health and well-being (Andreassen and Pallesen, 2014), and                such as happiness, anxiety, anger, and annoyance, as well as
significant amounts of screen time correlate with both depression         for assessing facial expressions and thereby contributing to
and anxiety (Lin et al., 2016; Rosenthal et al., 2021). As good           communication, social behavior, and memory (Koelsch and
interpersonal communication ability is one of the most important          Skouras, 2014; Hans-Eckhardt, 2017). For instance, music can
qualities of college students, the use of architectural design to         lead to emotional contagion; happy music triggers the zygomatic
improve communication spaces and promote interaction is of                muscle for smiling, together with an increase in skin conductance
great significance. However, architectural methods of promoting           and breathing rate, whereas sad music activates the corrugator
communicative behavior have so far remained at the level of               muscle (Koelsch, 2014). Despite these valuable findings, most
spatial design and have neglected the architectural sound                 research on music-evoked emotion has been conducted under
environment.                                                              laboratory conditions without taking into account the broader
    Human actions, particularly in face-to-face encounters, invite        context, including spatial conditions and the physical
responsive behaviors that include variations in wording, stress,          environment. In addition, most studies have focused on the
volume, tone of voice, gesture, gaze, head movements, and                 individual emotional state to the neglect of social interactions
even breathing patterns (Jensen and Pedersen, 2016). The social           in specific patterns of behavior.
interaction model indicates that senders’ displays of emotion                 Being physically, emotionally, and psychologically aware of
provide powerful signals to receivers during interpersonal                the space, we occupy is a feeling that can be described as
interactions, which people are hard-wired to pick up on and               being present. Jürgen Joedicke noted the need to take into
then rely on to guide their own behavior (Côté, 2005).                    consideration, the experience of space as well as spatial perception
Furthermore, interpersonal relationships can be fulfilled by              (Vasilski, 2016). Indoor space is the main site for human
emotions (Wubben et al., 2009). Authentic displays of some                activities. Interaction between people and their located
emotions – for instance, happiness – communicate an intention             environment, like social interaction, is spontaneous and
to affiliate and indicate that the individual is friendly and             unavoidable, and the specific psychological emotions evoked
agreeable (Côté, 2005). The concept of emotional contagion                by the physical and environmental attributes of personal interior
(Hatfield et al., 1993) entails a ripple effect (also known as            space offer a highly interesting topic for research (Reddy et al.,
an imitation effect) of human interaction through conscious               2012). Interrelated elements of interior design, including spatial
or unconscious induction of emotional states and behavioral               form, structure, light, texture, and color, as well as environmental
attitudes (Hess and Blairy, 2001). For instance, negative emotions,       factors such as lighting, sound, temperature, and humidity,
especially anger, can often lead to violence (Umberson et al.,            affect spatial atmosphere and emotion (Reddy et al., 2012).
2003); conversely, regarding positive emotions, positive                      Taking spatial form as an example, a study of the impact
correlations have been found between the total amount of                  of office design on absence rates has shown that stress levels
face-to-face interaction and the interlocutors’ resulting mood            and sick leave rates are higher in traditional open-plan offices
(Ono et al., 2012). Communication is a fundamental part of                than in cell-offices or combi-offices (Danielsson et al., 2014).
social face-to-face interaction that can produce cooperation or           Numerous studies have also examined the effects of light on
coordination (Olguin et al., 2009). However, there is insufficient        emotion. For instance, the use in accent lighting of saturated
research focusing on how to balance emotions during                       blue and cyan colors with a color temperature of 5,000–5,500 K
communication in combination with the sound environment.                  has been found to lead to the emotion of liveliness (Kim and
    Previous studies have shown that emotion can be affected              Mansfield, 2021). In terms of color, red is likely to be stimulating
by environmental contexts (Li et al., 2012; Lazarus, 2014),               because it increases blood pressure and heart rate (Manav, 2017).

Frontiers in Psychology | www.frontiersin.org                         2                                  September 2021 | Volume 12 | Article 703908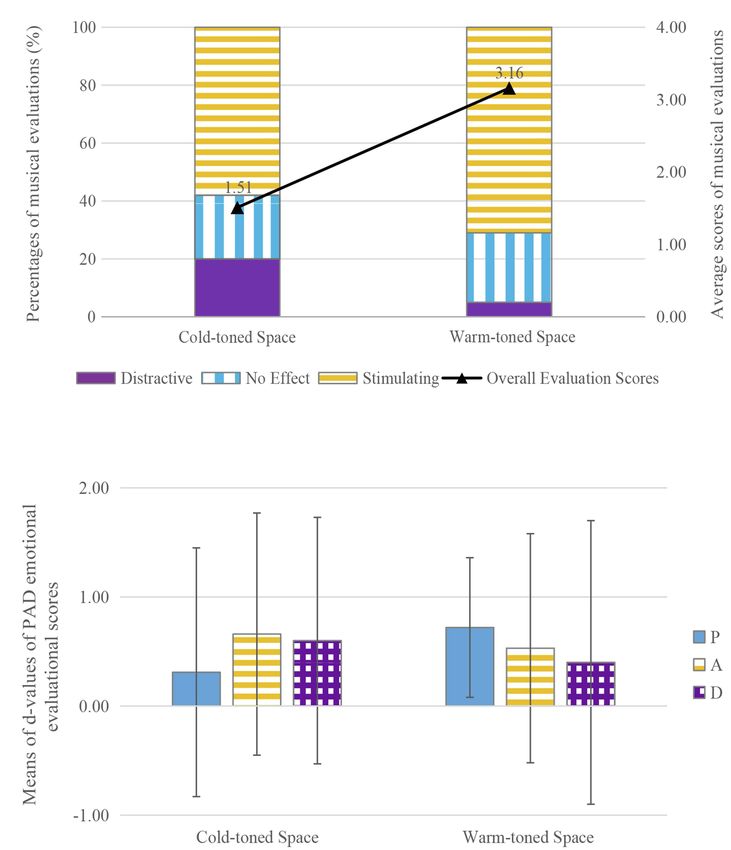
Jiang et al.                                                                                            Musical Effects on Communication Emotion

Natural communication is dynamic in nature, hence the                    functions (Boukhechba et al., 2018). In order to explore the
importance of investigating the audiovisual effects of space on          influence of qualities-related factors on emotion (Maheshwari
social interaction (Boer et al., 2018). However, most studies            et al., 2019), such as visual and sound atmospheres, as well
of emotional perception have relied on the visual factors of             as interior furnishings, six typical indoor communication spaces
spaces and ignored the combined sound environment.                       were chosen as the experimental sites and were compared one
   Previous work in a classroom context analyzing the effects            by one based on their functional classification: classroom (CR),
of music on conversational interaction has shown that, to a              learning corridor (LC), coffee shop (CS), fast food restaurant
certain degree, musical sound has a masking effect on other              (FFR), dormitory (DT), and living room (LR). Indoor layouts
noises and promotes communication in general (Jiang et al.,              of the experimental sites are shown in Figures 1A–F. LC here
2019). Here, emotion during communication refers to changes              refers to a corridor containing a learning space as shown in
in emotion following communication compared to the original              Figure 1. Tables and chairs arranged in the learning space
emotional state before communication. The study utilizes the             are used for students’ daily reading and communication. And,
three-dimensional pleasure–arousal–dominance (PAD) emotional             it is worth mentioning that the learning space (CR, LC) discussed
model to assess the emotions of participants through three               in this study is used for students’ self-study (not teaching),
dimensions of pleasure, arousal, and dominance before and                including learning communication and chat.
after communication. The difference values (d-values) of pleasure,           In terms of behavior mode, the CR and LC are used for
arousal, and dominance are used to reflect the changes in                self-study, and typical behaviors in these areas include learning
emotion during communication. To investigate differences in              communication and daily chat; the CS is frequently visited by
the effects of music on emotion during communication at                  students for socializing and tea breaks; FFR is a popular location
different sites, this study sets out four hypotheses.                    for dining; and the DT (four-person) and LR in residence
                                                                         halls comprise the main living areas for college students, wherein
       Hypothesis 1: is that the effects of music on emotion             typical behaviors include rest, leisure, and socializing.
       during communication vary in spaces with                              A thermal measurement instrument and illuminance meter
       different functions.                                              were used to ensure that indoor temperature and illumination
                                                                         were within the comfort range, and therefore, not likely to
       Hypothesis 2: is that visual atmosphere influences the            influence emotion or performance (Altomonte, 2017; Petersen
       effects of music on emotion during communication.                 and Knudsen, 2017). In terms of thermal factors, related
                                                                         experimental results have shown that performance improves
       Hypothesis 3: is that the sound atmosphere influences             as the indoor temperature approaches 23°C (Nematchoua et al.,
       the effects of music on emotion during communication.             2019) and decreases when the temperature rises above 25°C
                                                                         (Niemelä et al., 2002). Therefore, the experiment time was set
       Hypothesis 4: is that interior furnishings serve as an            from 9 a.m. to 4 p.m. to maintain the indoor temperature at
       influential spatial factor that moderate the effects of           23–25°C. In terms of luminous factors, previous studies have
       music on communication.                                           shown that illuminance and light color can affect fatigue and
                                                                         emotion (Carlucci et al., 2015). Preferred illuminance was
       Hypothesis 5: is that the effects of music on emotion             therefore set in the range of 310–600 lux, and a neutral white
       during communication differ when participants are                 (4,000 K) space was used (Bowers et al., 2010; Hidayetoglu
       subject to different social characteristics, including the        et al., 2012; Yang and Moon, 2018). Since it was difficult to
       intimacy level, gender combination, and group size.               maintain the same illuminance on all six sites, neutral white
                                                                         (4,000 K) light was used to decrease the effects of the light
                                                                         environment, and lamps in the room maintained an average
METHODOLOGY                                                              illuminance of 310–600 lux.
                                                                             Sound level meters (BSWA801, BSWA, Beijing, China) were
Experimental Site                                                        located at the measurement points shown in Figure 1 and
There are two main kinds of emotion-related experiments: field           at a height of 1.2 m from the ground, and provided multiple
experiments and laboratory experiments. On the basis of                  measures of the background sound pressure level (SPL) at
reliability and authenticity (Harrison, 2003), in this study, a          each of the six experimental sites for 5 min per hour from
field experiment was conducted in different sites, respectively,         9 a.m. to 4 p.m., with recordings every 5 s, which were
under the same musical environment. In terms of the selection            A-weighted in the uncontrolled condition without subjects
of experimental sites, the location and time to confront people          (Torija et al., 2012). In addition, because the experimental
(especially strangers) can significantly influence the                   behavior was face-to-face communication, reverberation time
communication that takes place (Weisburd, 2021). In order to             (RT) was a significant factor influencing speech intelligibility
avoid any influence of familiarity with the space on                     (Yang and Hodgson, 2006), which may influence the quality
communication (Krupa et al., 2018), indoor places frequently             of communication. Therefore, using the Eyring formula (Passero
visited by students were chosen for this study. In line with             and Zannin, 2010), the RT of each experimental site was
common student activities, experimental sites were classified            calculated, including the absorption coefficient, area, and
into learning, dining, and residential spaces based on spatial           amount.

Frontiers in Psychology | www.frontiersin.org                        3                                 September 2021 | Volume 12 | Article 703908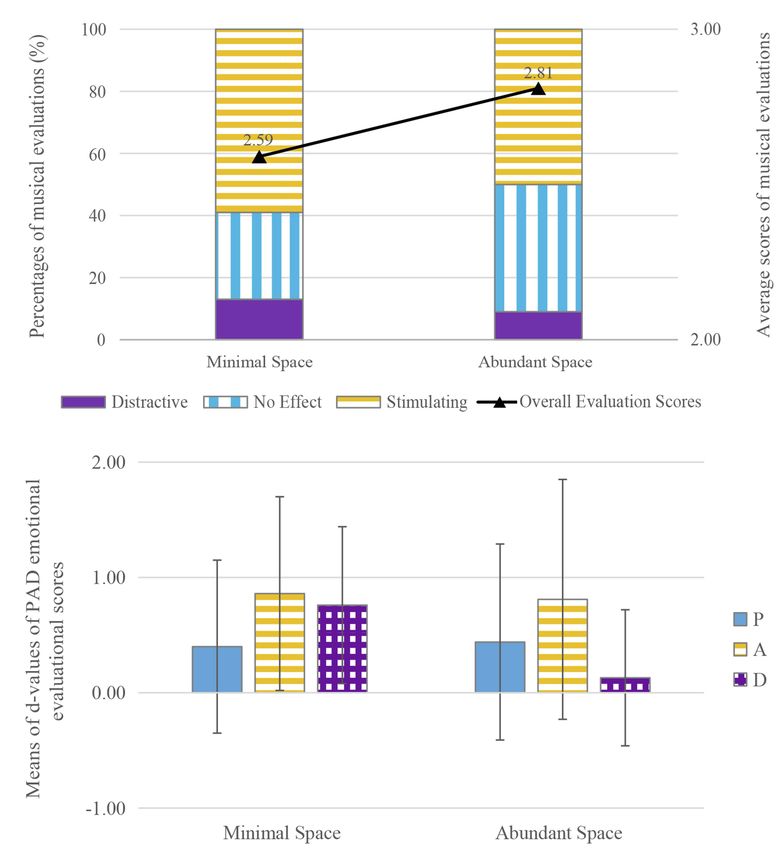
Jiang et al.                                                                                                                  Musical Effects on Communication Emotion

                  A

                  B

                  C                                                                    D

                  E                                                                    F

  FIGURE 1 | Indoor layouts of the experimental sites: (A) CR, classroom; (B) LC, learning corridor; (C) CS, coffee shop; (D) FFR, fast food restaurant; (E) DT,
  dormitory; and (F) LR, living room.

   The characteristics of the experimental sites, including scale,                     SPL for 5 min of background sound recording at the measurement
background SPL, RT, and behavior patterns, are shown in                                point ranged from 32.5 to 63.2 dBA at the six sites, among
Table 1. The data show that the average A-weighted equivalent                          which, under the same spatial function, the difference in SPL

Frontiers in Psychology | www.frontiersin.org                                      4                                        September 2021 | Volume 12 | Article 703908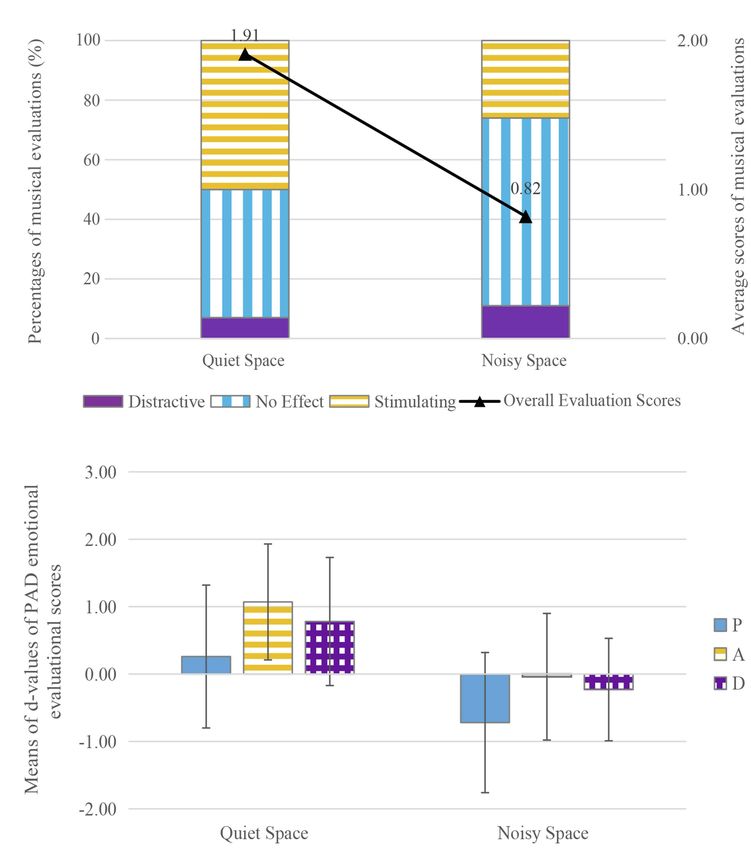
Jiang et al.                                                                                                             Musical Effects on Communication Emotion

was largest (25.3 dBA) between the FFR and the CS. The                                 were graduate students or undergraduate students of the university
sensitivity of the instrument was ±0.5 dBA. In addition, the                           (Gudykunst and Shapiro, 1996). Further, to avoid potential
average RT value at each site with 2–5 participants was provided.                      confounding effects of formal training in music (Gabrielsson,
                                                                                       2002), all participants were non-music majors and had never
Experimental Music                                                                     undergone formal training in music. Before starting the
Previous research indicates that tempo, SPL, and musical                               experiment, participants were asked to maintain their emotional
emotions may also influence emotion (Hunter and Schellenberg,                          stability, obtain sufficient sleep, and follow the same routine
2010); this phenomenon that has been assessed using behavioral,                        as they would during the survey period, without any interference
physiological, and neurological measures (Koneni, 2008). In                            from other events such as exams or parties. To ensure adequate
terms of tempo, fast music can increase brain activity (Nicolaou                       statistical power, G*Power (a general power analysis program)
et al., 2017). To avoid interference from the high arousal effect                      was used to analyze the minimum sample size of subjects,
of music on the differences between spatial types, slow music                          assuming an effect size of d = 0.5, α = 0.05 and Power (1−β) = 0.8.
was used in this study. Music with high SPL can also increase                          To answer the main research question regarding the differences
perceived activation and tension (Olsen et al., 2015). Excluding                       between different indoor spaces, the minimum average required
the FFR, the background SPLs of the other five sites were all                          sample size was 51 for the student’s t-test (between-group)
below 40 dBA; in order to ensure the masking effect of music                           and 53 for one-way ANOVA (between-group) when there were
as well as the sound comfort (Jiang et al., 2019; Meng et al.,                         three groups. Information about the participants is given in
2020), an SPL of 50 dBA was adopted for the present study.                             Table 2. Of students in the sample, 55 participated in the
   Musical emotional characteristics can be classified in terms                        CR, 55 in the LC, 52 in the CS, 59 in the FFR, 54 in the
of musical dimensions, such as pitch height, loudness, timbre,                         DT, and 56 in the LR.
tempo, and intensity (Goshvarpour et al., 2017), and grouped
into synonym clusters, such as happiness, sadness, fear, and                           Emotional Model
neutral (Paquette et al., 2018). Related studies have shown that                       Recognition and analysis of human emotions have been
peacefulness is a complex emotion that overlaps with each                              researched extensively in neuroscience, psychology, cognitive
quadrant of a circumplex model defined by the dimensions of                            science, and computer science. Mainstream research on human
arousal and valence (Hunter and Schellenberg, 2010) without                            emotion has focused on facial and vocal expressions (Gunes
clear emotional directivity. Thus, taking into account the evaluation                  and Pantic, 2010). In terms of the models of perceived
of familiarity and liking by the college students (Meng et al.,                        affective quality on soundscapes, Ma et al. (2018) illustrated
2020), A Comme Amour (slow tempo, peaceful, 50 dBA, high                               the feasibility of the semantic differential method (SDM)
degree of familiarity and liking) was chosen on the basis of                           for measuring human perceptions of sound. The quantitative
restricted gene expression programming (Zhang and Sun, 2013)                           measurements of the subjective meaning of things were
as the experimental music in this study. As the CR had the                             obtained from the subjects’ ratings on the bipolar adjective
lowest background SPL of the six sites, the SPL of the experimental                    pairs (APs) formed by descriptors with two opposite meanings
music was measured there. Under the condition with music,                              (Ma et al., 2018). The APs provided a general picture of
measurements were taken three times for 5 min each time, at                            human perceptions of the tested objects and facilitated
1-min intervals, with readings every 1 s, which were A-weighted                        comparison between the objects (Ma et al., 2018). Besides,
(Crandell et al., 2004). Readings for the three times were averaged                    Torresin et al. (2020) indicated that many of perceptional
and recorded. To ensure the accuracy of the musical SPL, the                           dimensions in complex acoustic environments (i.e., multiple
volume of music was adjusted until the average reading of                              sound types) could be coherently explained under Russel’s
musical SPL reached 50 dBA (actual data 49.66 ± 0.5 dBA, denoted                       circumplex model of affect. In order to indicate the audiovisual
in what follows as 50 dBA).                                                            effects of music and spatial factors on emotion, an emotional
                                                                                       model based on the SDM evaluation system describing
Participants                                                                           emotional states was chosen in this study. The discrete
In order to avoid the effect of identities and expectations on                         emotional model and the dimensional emotion model are
participants’ satisfaction with communication, all participants                        the most widely used models that can effectively express

TABLE 1 | Basic spatial and acoustic information of six experimental sites.

Experimental             Indoor                   Floor      Color scheme                   Background         RT (s)       Behavior mode
site                    area (m2)               height (m)                                   SPL (dBA)

CR                         45                      3.5       White, Wooden, and Gray            32.5           1.16         Learning, chatting
LC                         100                     3.0       White, Dark, and Gray              36.7           1.54         Learning, chatting, and walking
CS                         72                      3.0       White, Wooden, and Yellow          37.9           1.22         Dining, chatting, and dating
FFR                        235                     3.5       White, Wooden, and Red             63.2           1.41         Dining, chatting
DT                         18                      3.3       White, Wooden, and Blue            33.9           0.71         Sleeping, learning, and chatting
LR                         45                      2.8       White, Wooden, and Gray            35.6           0.91         Resting, chatting

Frontiers in Psychology | www.frontiersin.org                                      5                                    September 2021 | Volume 12 | Article 703908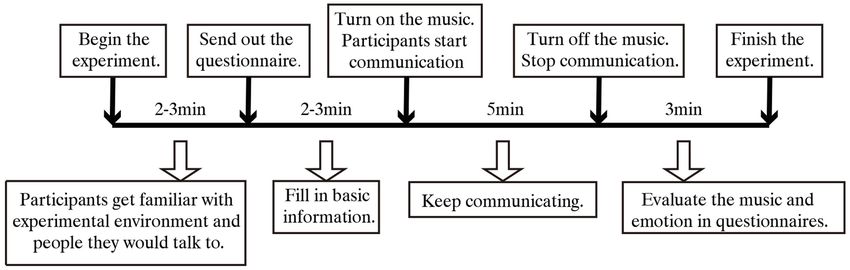
Jiang et al.                                                                                                    Musical Effects on Communication Emotion

TABLE 2 | Basic information on participants by experimental site.

Experimental site                 Total sample size             Gender              Sample size             Mean age                  SD of age

                                                                     Male                27                   23.96                      1.48
CR                                        55
                                                                    Female               28                   23.75                      1.71
                                                                     Male                26                   23.62                      2.74
LC                                        55
                                                                    Female               29                   23.14                      2.46
                                                                     Male                22                   24.45                      1.99
CS                                        52
                                                                    Female               30                   24.20                      1.95
                                                                     Male                24                   24.54                      3.79
FFR                                       59
                                                                    Female               35                   24.14                      2.56
                                                                     Male                27                   24.48                      1.83
DT                                        54
                                                                    Female               27                   24.70                      0.95
                                                                     Male                25                   24.56                      1.53
LR                                        56
                                                                    Female               31                   24.48                      1.41

and quantify emotion. The discrete emotion model applies                         overall music evaluation, overall spatial evaluation, and emotion
emotional labels (e.g., happiness, sadness, surprise, fear, anger,               during communication before and after the experiment (based
and disgust), although, a single label may not reflect the                       on the three-dimensional PAD emotional model). The structure
complexity of the affective state conveyed by such rich sources                  and descriptions of questionnaire are shown in Table 3; among
of information (Gunes and Pantic, 2010). Instead of applying                     them, overall musical evaluation represents the effect of music
discrete categories of emotion, the dimensional emotional                        on communication and indicates participants’ preference
model analyzes and interprets the subtlety, complexity, and                      regarding the presence of music at different sites during
continuity of affective behavior in terms of latent dimensions                   communication. Overall spatial evaluation is composed of four
(Havlena et al., 2010). Compared to a two-dimensional scheme                     spatial factors: spatial scale, perceived spatial color, sound
– for example, arousal-valence space model of Thayer and                         atmosphere, and interior furnishings. Emotion during
Mcnally (1992) – the three-dimensional solution is more                          communication is evaluated from three dimensions: pleasure,
informative and helps to differentiate between what the cluster                  arousal, and dominance. The d-values of pleasure, arousal, and
analysis suggests are separate basic-emotion categories (Shaver                  dominance before and after the experiments are used to reflect
et al., 1987). Therefore, three-dimensional PAD emotional                        the change in emotion during communication.
model of Mehrabian and Russell (1974) was selected for use
in this study. The PAD emotional model consists of three                         Experimental Design
APs, including pleasure–displeasure (P), arousal–nonarousal                      In order to explore the effects of different spatial types on
(A), and dominance–submissiveness (D), among which P is                          emotion during communication against a background of
defined as positive vs. negative affective states, with higher                   music, experiments were conducted in six typical indoor
evaluations of stimuli being associated with greater pleasure                    spaces. In terms of experimental means, random assignment,
induced by the stimuli; A equates to judgments of high–low                       which has high internal validity (Morgan et al., 2000), was
stimulus activity, which is defined in terms of the level of                     used to eliminate systematic differences between the treatment
mental alertness and physical activity; and D is defined as                      and control groups. Participants recruited on campus were
a feeling of control and influence over one’s surroundings                       allocated at random to groups of 2–5 people in each
and others vs. feeling controlled or influenced by situations                    conversation. In addition, three levels of communicator
and others (Mehrabian, 1996; Zhang et al., 2007). Gärling                        intimacy were delineated, including stranger (all sites except
et al. (2020) proposed that self-reports on momentary states                     DR and LR), acquaintance (all sites), and close friend (all
(e.g., “How do you feel right now?”) in the context of                           sites). Because the background SPL was different at each
emotional well-being are valid and reliable. In the current                      of the six sites, to ensure a consistent musical environment,
study, considering differences in the emotional states of the                    A Comme Amour (50 dBA) as measured in the classroom
participants before the experiment, the PAD three-dimensional                    was played at the same volume at each of the six sites to
evaluation was conducted before and after the communication,                     ensure the sound pressure of the music was same at each
respectively, and d-values of pleasure, arousal, and dominance                   indoor space. In terms of the duration of communication,
were used to reflect changes in emotion during communication.                    previous studies have found 5 min to be appropriate for an
                                                                                 analysis of communication using average and minimum
Questionnaire Design                                                             chatting times (Yamaguchi et al., 2012). To avoid duration
A questionnaire was used to evaluate the participants’ emotional                 affecting people’s focused attention and emotion during
state with a high level of reliability, because self-reports have                communication (Dong and Wyer, 2014), each communication
been found to be an appropriate and natural method for                           period was limited to 5 min. The need for participants to
studying emotional responses to music (Gabrielsson, 2002).                       communicate with strangers for 5 min was mentioned when
The questionnaire consisted of four parts: basic information,                    recruiting the volunteers, so that we could ensure all of

Frontiers in Psychology | www.frontiersin.org                                6                                September 2021 | Volume 12 | Article 703908
Jiang et al. Musical Effects on Communication Emotion
TABLE 3 | The structure and descriptions of questionnaire.
The structure of Question Description
questionnaire
Basic information Name, gender, age, intimacy level and group Intimacy level (1 to 3): stranger (1), acquaintance (2), close friend (3)
size. Group size (1/2): one-on-one (1), multi participants (2)
Overall musical evaluation How do you think the music influenced the No effect (0): Music has no effect.
communication? Stimulating (1–10): Music is a little – very stimulating to communication. Distracting
(21 points scale) (−1 to −10): Music is a little – very distracting to communication.
Distracting (−1 to −10): Music is a little— very distracting to communication.
Overall spatial evaluation Please evaluate the space you are located Spatial scale (1/2): small scale (1), large scale(2)
from four aspects. Perceived spatial color (1/2): cold-toned (1), warm-toned (2)
(either-or questions) Sound atmosphere (1/2): quiet (1), noisy (2)
Interior furnishings (1/2): minimal (1), abundant (2)
Emotion during Please describe your current emotional state Pleasure (1–10): Depressed to satisfied; Unhappy to happy;
communication from three aspects (P, A, and D) Restless to comfortable; Angry to content
Arousal (1–10): Peaceful to fevered; Unexcited to excited;
(10 points scale) Relaxed to stimulated; Drowsy to alert
Dominance (1–10): Passive to active; Controlled to uncontrolled
the participants showed a strong desire to conduct Statistical Methods
conversations with others, including strangers. In addition, IBM SPSS statistics for Windows, version 23.0 (IBM Corp.,
participants’ post-experiment feedback showed that Armonk, NY, United States) was used to analyze the relationship
interactions felt natural and fluent rather than artificial. between the effects of music on communication and specific
The flow chart of the experiment is shown in Figure 2. spatial factors. The Kolmogorov–Smirnov test was used to
Following the random allocation, participants entered the analyze the normality of the experimental data – that is, to
experiment room and took around 2–3 min to get familiar confirm that the population followed a normal distribution
with the experimental environment and the people they would hypothesis. Levene’s test was used for equality of variance,
talk to. Then, questionnaires were distributed, and participants and all variance was found to be equal. According to the
were required to fill in their basic information according to number of treatments, ANOVA was used to test for significant
the instructions in 2–3 min. Participants then began to differences in spaces with different functions (between-group).
communicate in the music environment, and continued chatting Independent t-tests were performed to assess differences between
for 5 min until the music stopped. During the communication spaces with different visual and sound atmospheres and
session, considering that participants were strangers, in order interior furnishings.
to avoid embarrassment several topics were provided for
participants to discuss. Participants selected the conversation
topics themselves and were then required to complete the
questionnaires within 3 min, after which the experiment was
RESULTS
deemed complete. In addition, some studies have indicated Spatial characteristics are expected to affect the use and feeling
that food may facilitate communication (Dabbs and Janis, 1965; of a space, and even the emotions experienced during
Blouin et al., 2013); therefore, snacks and nonalcoholic beverages communication therein. This section presents the results of
were provided in this study. the analysis of the relationships between the spatial factors
Regarding the between-subjects design, in terms of spatial and the musical evaluations, average evaluation scores and
function CR, CS, and LR were chosen for comparison. d-values for PAD emotional evaluations in terms of spatial
Because the difference in indoor area of these three sites function, visual atmosphere, sound atmosphere, and
was within 27 m2, the background SPLs were all below interior furnishings.
40 dBA, and the colors of the spaces were all warm-toned,
the effect of spatial scale and visual and sound environment
was deemed minimal. In terms of visual atmosphere, the Spatial Function
colors of the LC were cold-toned, which was different from The experimental sites were sorted into three groups according
the other spaces. Thus, in order to ensure consistency in to function (learning spaces, dining spaces, and residential
the spatial function, CR and LC were chosen for comparison. spaces). CR, CS, and LR (all of which were quiet and had
In terms of sound atmosphere, excluding FFR, the background a similar indoor area) were chosen for comparison. The
SPLs of the other five sites were all below 40 dBA; thus, relationships between spatial functions and musical evaluations
in order explore the effect of sound atmosphere of the (no effect/stimulating/distracting) and the average scores for
same functional spaces on communication, CS was chosen musical evaluations are shown in Figure 3A. The percentage
for comparison with FFR. who evaluated the music as stimulating to communication
Frontiers in Psychology | www.frontiersin.org 7 September 2021 | Volume 12 | Article 703908Jiang et al. Musical Effects on Communication Emotion
FIGURE 2 | Experimental procedure.
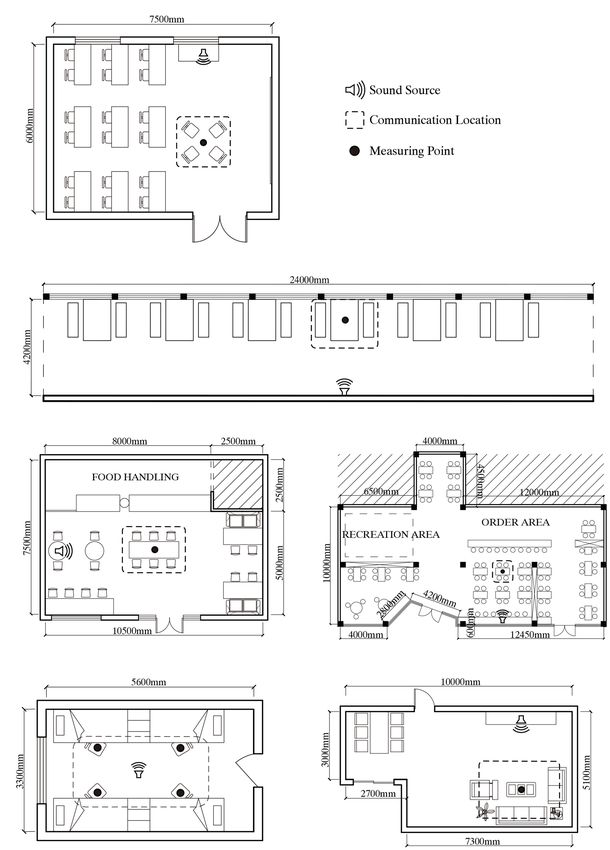
ranged from 52 to 64% and was highest in the residential The average d-values for PAD emotional evaluations in
space. The percentage evaluating the music as distracting spaces with different visual atmospheres are shown in Figure 4B.
ranged from 7 to 20% and was highest in the learning space. Pleasure, arousal, and dominance all increased to varying
Average scores for musical evaluation were highest in the degrees. The d-values for arousal and dominance were 0.13–0.20
residential space (2.91), followed by the dining space, and higher in the cold-toned space than in the warm-toned space,
then the learning space (1.47). Based on the three kinds of while the d-value of pleasure in the warm-toned space (M = 0.72,
spatial functions, the results of the ANOVA show that there SD = 1.278) was higher than in the cold-toned space (M = 0.31,
was no significant difference in musical evaluation among SD = 2.284). The results of the t-test showed that visual atmosphere
spaces of different functions (df1 = 2, df2 = 162, F = 2.225, did not have a significant effect on pleasure (df = 108, t = −1.066,
p = 0.111, d = 0.26). p = 0.289, d = 0.21), arousal (df = 108, t = 0.285, p = 0.776, d = 0.06),
The average d-values for the PAD emotional evaluations in or dominance (df = 108, t = 0.508, p = 0.613, d = 0.10).
spaces of different functions are shown in Figure 3B. Pleasure,
arousal, and dominance increased to varying degrees, and the Sound Atmosphere
d-values of pleasure and dominance were similar across the In accordance with subjective evaluation of background sound
three spaces. Pleasure increased from 0.26 to 0.39 and was under the uncontrolled condition, the experimental sites were
highest in the residential space, whereas dominance increased sorted into quiet spaces and noisy spaces. FFR and CS (which
from 0.64 to 0.78 and was highest in the dining space. The had the same spatial function but a clear difference in sound
d-value for arousal was lowest in the learning space (0.53). atmosphere evaluation) were chosen for comparison. The
The results of the ANOVA show that there were no significant relationships between sound atmosphere and percentages for
effects of different spatial functions on pleasure (df1 = 2, df2 = 162, musical evaluations (no effect/stimulating/distracting) and average
F = 0.061, p = 0.941, d = 0.05), arousal (df1 = 2, df2 = 162, F = 1.309, scores for musical evaluations are shown in Figure 5A. The
p = 0.273, d = 0.27), or dominance (df1 = 2, df2 = 162, F = 0.070, percentage of evaluations that rated the music as having a
p = 0.933, d = 0.05). stimulating effect was much higher in the quiet space (50%)
than in the noisy space (26%). The proportion of evaluations
Visual Atmosphere that rated the music as having no effect on communication
In accordance with subjective evaluations of perceived space was similar in two spaces (ranging from 7 to 11%). It was
color, the experimental sites were grouped into cold-toned noticeable that a substantial proportion of communicators (63%)
spaces and warm-toned spaces. CR and LC (which were in noisy spaces thought that the music had no effect on
both quiet and of learning function but had a clear difference communication. Average scores for musical evaluation were
in color evaluation) were chosen for comparison. The higher in the quiet space (M = 1.91, SD = 2.896) than in the
relationships between visual atmosphere and percentages for noisy space (M = 0.82, SD = 3.402). The results of the t-test
the musical evaluations (no effect/stimulating/distracting) showed that there was no significant effect of sound atmosphere
and the average scores for the musical evaluations are shown on musical evaluation (t = −1.801, df = 109, p = 0.074 < 0.1,
in Figure 4A. The percentage who evaluated the music as d = 0.34).
stimulating was higher in the warm-toned space (71%) than The average d-values for PAD emotional evaluations in
in the cold-toned space (58%), and the converse applied spaces with different sound atmospheres are shown in Figure 5B.
to the proportion who evaluated the music as distracting. The d-values for pleasure, arousal, and dominance increased
Average scores for musical evaluation were much higher in by 0.26 (SD = 2.130), 1.07 (SD = 1.725), and 0.78 (SD = 1.910)
the warm-toned space (M = 3.16, SD = 2.214) than in the in quiet spaces, but decreased by 0.72 (SD = 2.085), 0.04
cold-toned space (M = 1.51, SD = 3.894). The results of the (SD = 1.870), and 0.23 (SD = 1.536) in noisy spaces. The results
t-test showed that there was a significant effect of visual of the t-test showed that there was a significant effect of music
atmosphere on musical evaluation (t = −2.534, df = 108, p < 0.05, on pleasure (t = 2.446, df = 109, p < 0.05, d = 0.46), arousal (t = 3.243,
d = 0.50). df = 109, p < 0.01, d = 0.62), and dominance (t = 3.066, df = 109,
Frontiers in Psychology | www.frontiersin.org 8 September 2021 | Volume 12 | Article 703908Jiang et al. Musical Effects on Communication Emotion
A
B
FIGURE 3 | The effects of music on communication in spaces with different functions: (A) the effects of music on musical evaluation, (B) the effects of music on
pleasure–arousal–dominance (PAD) emotional evaluation.
p < 0.01, d = 0.58) in spaces with different sound atmospheres. the two groups (from 50 to 59% and from 9 to 13%, respectively).
These findings indicate that music can be effective in enhancing The percentage of evaluations that rated the music as having
pleasure, arousal, and dominance during communication in no effect was higher in the abundant space (41%) than in the
quiet spaces. minimal space (28%). Average scores for musical evaluation
were slightly higher in the abundant space (M = 2.81, SD = 3.693)
than in the minimal space (M = 2.59, SD = 3.853). The results
Interior Furnishings of the t-test showed that there was no significant effect of
Diversity of furniture is one of the main factors to evaluate interior furnishings on musical evaluation (t = −0.279, df = 108,
the interior furnishings (Kaye and Murray, 1982). In this p = 0.781, d = 0.06).
study, the experimental sites were sorted into minimal spaces The average d-values for PAD emotional evaluations in
(within three) and abundant spaces (more than three) in terms spaces with different interior furnishings are shown in Figure 6B.
of the number of furniture types. DT and LR which had the The d-values for pleasure and arousal were similar in the
same spatial function and visual and sound atmospheres but minimal space and abundant spaces, increasing by 0.40
a clear difference in interior furnishings were chosen for (SD = 1.515), 0.44 (SD = 1.703), 0.86 (SD = 1.673), and 0.81
comparison. The relationships between interior furnishings and (SD = 2.086), respectively. The d-value for dominance was higher
the percentages for musical evaluations (no effect/stimulating/ in the minimal space (M = 0.76, SD = 1.379) than in abundant
distracting) and the average scores for musical evaluations are spaces (M = 0.13, SD = 1.185). The results of the t-test showed
shown in Figure 6A. The proportion of evaluations that rated that there was a significant effect of music on dominance in
the music as stimulating and as distracting were similar in spaces with different interior furnishings (t = 2.268, df = 108,
Frontiers in Psychology | www.frontiersin.org 9 September 2021 | Volume 12 | Article 703908Jiang et al. Musical Effects on Communication Emotion
A
B
FIGURE 4 | The effects of music on communication in spaces with different visual atmospheres: (A) the effects of music on musical evaluation, (B) the effects of
music on PAD emotional evaluation
p < 0.05, d = 0.48). This finding indicates that the positive effect combinations and number of participants. The average scores
of music on dominance during communication was significant of musical evaluation and the d-values of PAD emotional
in the minimal space. evaluation were summarized, and the SD was identified via
t-tests. The results are shown in Table 4.
Social Characteristics The effects of music on communication varied in different
Studies have found that social characteristics such as gender, functional indoor spaces when participants were with different
age, and situation can lead to different emotion evaluations social characteristics, such as intimacy level, gender combination,
(Gabrielsson, 2002; Hunter et al., 2011; Schubert, 2013). In and group size of communicators.
accordance with the behavioral mode of communication, this In the learning space, there was a significant effect of music
study analyzed the effects of music on participants with different on dominance during communication in different gender
intimacy levels, in different gender combinations and in groups combinations. The results of the t-tests showed that in comparison
of different sizes during communication. Based on the number to mixed-gender groups (M = −0.02, SD = 1.737), dominance
of treatments, ANOVA was used to test for significant differences (t = 3.347, df = 108, p < 0.01, d = 0.64) was enhanced by music
in the various intimacy levels (stranger, acquaintance, and close in single-gender groups (M = 1.23, SD = 2.179).
friend) of participants (Starzyk et al., 2006). Independent t-tests In the dining space, compared to the intimacy levels of
were performed to assess differences between different gender acquaintances and close friends, the average scores for musical
Frontiers in Psychology | www.frontiersin.org 10 September 2021 | Volume 12 | Article 703908Jiang et al. Musical Effects on Communication Emotion
A
B
FIGURE 5 | The effects of music on communication in spaces with different sound atmospheres: (A) the effects of music on musical evaluation, (B) the effects of
music on PAD emotional evaluation.
evaluation were 1.54–2.03 higher in the group of strangers. d = 0.67) were efficiently enhanced by music in the group
The results of the ANOVA indicated that communication was of acquaintances.
promoted to some extent when participants were strangers Therefore, in terms of social characteristics, there is evidence
(df1 = 2, df2 = 108, F = 2.639, p = 0.076 < 0.1, d = 0.28), meanwhile, that when in the learning space, using music to promote
d-values of pleasure (df1 = 2, df2 = 108, F = 2.541, p = 0.083 < 0.1, communication is more suitable for single-gender groups. And
d = 0.48) and arousal (df1 = 2, df2 = 108, F = 2.369, p = 0.098 < 0.1, when there are more than two communicators in the dining
d = 0.49) were higher in the stranger group. Further, all of the space, pleasure and arousal can be efficiently enhanced by
musical evaluation scores and d-values for emotional evaluations music. In the residential space, when the intimacy level of
were higher when there were more than two participants, and roommates is not that close, music environment can be an
the results of the t-tests show that there was an significant effective way to promote communication.
effect of music on pleasure (t = −2.008, df = 109, p < 0.05, d = 0.38)
and arousal (t = −2.412, df = 109, p < 0.05, d = 0.46).
In the residential space, the average scores for musical DISCUSSION
evaluation were 2.66 higher in acquaintances compared to
close friends. The results of the t-tests show that there was This paper contributes to the body of research into the effects
a significant effect of music on communication (t = 3.448, of audiovisual interaction on social interaction by comparing
df = 108, p < 0.01, d = 0.72), and pleasure (t = −2.008, df = 108, the effects of music on communication in different spaces in
p < 0.05, d = 0.52) and dominance (t = −2.412, df = 108, p < 0.01, terms of function, visual atmosphere, sound atmosphere, and
Frontiers in Psychology | www.frontiersin.org 11 September 2021 | Volume 12 | Article 703908Jiang et al. Musical Effects on Communication Emotion
A
B
FIGURE 6 | The effects of music on communication in spaces with different indoor furnishings: (A) the effects of music on musical evaluation, (B) the effects of
music on PAD emotional evaluation.
interior furnishings. In terms of spatial function, people have Roy, 2017), finding that people’s satisfaction is closely related
particular behavioral patterns in specific functional spaces (for to speech privacy. To date, most studies have focused on the
instance, eating meals in a restaurant, or resting in a bedroom). analysis of emotional feelings in specific spaces, with little
In this study, spaces for learning, dining, and resting were horizontal comparison across different functional spaces. Thus,
chosen in accordance with the main activities of college students. the results of this part of the present study provide a point
The results were inconsistent with Hypothesis 1; there were of reference for future research.
no significant differences between the effects of music on For Hypothesis 2 on visual atmosphere, the results show
communication or emotion during communication in spaces that music had greater effects on communication in the warm-
with different functions. Post-experiment interview suggested toned spaces than in the cold-toned spaces. However, there
that this result is to some extent attributable to the fact that were no significant differences in the effects of music on
chatting is a common behavior pattern in all the spaces, pleasure, arousal, or dominance in spaces with different visual
regardless of their primary function, and thus all the sites atmospheres. The effect size of the PAD emotional evaluations
were suitable for communication. Compared to spatial function, did not seem to match the overall effects of music on
the degree of privacy offered by a space may have a more communication. Previous studies indicate that experiences of
significant effect on communication. Numerous studies have color have their roots in conscious, subconscious, and
explored the need for privacy and intelligibility of speech in unconscious processes of human behaviors (Reddy et al.,
different spaces, such as open-plan offices, hospitals, and 2012) and that the effect of music on emotional intervention
residences (Cavanaugh and Hirtle, 2006; Virjonen et al., 2007; plays a dominant role, followed by color (Li et al., 2018).
Frontiers in Psychology | www.frontiersin.org 12 September 2021 | Volume 12 | Article 703908Frontiers in Psychology | www.frontiersin.org
Jiang et al.
TABLE 4 | Musical and emotional evaluations in terms of social characteristics.
D-values for emotional evaluation
Site Statistical test Social characteristic Musical evaluation
Pleasure Arousal Dominance
Stranger 2.03 0.93 0.67 0.60
ANOVA Intimacy level Acquaintance 2.06 0.66 0.28 0.72
Close friend 2.29 0.06 0.79 0.33
Learning space Single gender 1.83 (SD = 3.679) 0.57 (SD = 1.839) 0.53 (SD = 2.052) 1.23 (SD = 2.179)
Gender combination
Mixed gender 2.40 (SD = 3.231) 0.40 (SD = 2.052) 0.67 (SD = 2.155) −0.02 (SD = 1.737)
t-test
One-on-one 2.13 (SD = 3.553) 0.34 (SD = 1.873) 0.53 (SD = 2.276) 0.49 (SD = 2.062)
Group size
Multi participants 2.26 (SD = 2.958) 0.96 (SD = 2.225) 0.91 (SD = 1.756) 0.61 (SD = 1.924)
13
Stranger 2.71 0.29 0.81 0.86
ANOVA Intimacy level Acquaintance 0.68 −1.04 −0.20 0.08
Close friend 1.17 −0.11 0.68 0.14
Dining space Single gender 1.02 (SD = 3.514) −0.09 (SD = 2.003) 0.45 (SD = 1.768) 0.13 (SD = 1.585)
Gender combination
Mixed gender 1.69 (SD = 2.834) −0.40 (SD = 2.306) 0.56 (SD = 1.998) 0.40 (SD = 1.987)
t-test
One-on-one 1.22 (SD = 3.037) −0.62 (SD = 1.941) 0.12 (SD = 1.767) 0.02 (SD = 1.600)
Group size
Multi participants 1.51 (SD = 3.402) 0.20 (SD = 2.324) 0.96 (SD = 1.918) 0.55 (SD = 1.973)
Acquaintance 3.97 (SD = 3.551) 0.97 (SD = 1.204) 1.00 (SD = 1.901) 1.22 (SD = 1.237)
Intimacy level
Close friend 1.31 (SD = 3.725) 0.18 (SD = 1.642) 0.78 (SD = 1.755) 0.37 (SD = 1.270)
Single gender 2.08 (SD = 3.908) 0.44 (SD = 1.609) 0.92 (SD = 1.837) 0.60 (SD = 1.357)
Residential space t-test Gender combination
Mixed gender 2.11 (SD = 3.408) 0.11 (SD = 0.928) 0.00 (SD = 0.866) 0.78 (SD = 0.667)
One-on-one 1.32 (SD = 3.913) 0.88 (SD = 1.509) 1.28 (SD = 1.768) 0.68 (SD = 1.435)
Group size
Multi participants 2.31 (SD = 3.833) 0.27 (SD = 1.561) 0.72 (SD = 1.790) 0.60 (SD = 1.284)
September 2021 | Volume 12 | Article 703908
Musical Effects on Communication EmotionJiang et al. Musical Effects on Communication Emotion The present results may be due to the fact that music has is associated, up to a point, with increasing intimacy and a greater effect on emotion than color does. Against a given friendliness (Kaye and Murray, 1982). musical background, it may be difficult for participants to Communicators in the same seats had different spatial distinguish differences in the emotion during communication perceptions of scale that bore no clear relation to the indoor in spaces with different visual atmospheres, and it is likely area. Take, for example, the learning corridor, which 53% of that the complex influence mechanism of color on emotion participants thought of as a large-scale space, whereas 47% cannot be expressed simply in terms of a three-dimensional held the opposite view. According to post-experiment interviews, emotion model. the ratio of the length and width of a space, the density of In terms of sound atmosphere, the subject of Hypothesis crowds and furniture, and the enclosure mode of a space all 3, the results indicate that communication can be enhanced affect the perception of spatial scale. by music in the quiet space to some degree, although, most For Hypothesis 5, which focused on social characteristics, of the communicators thought that there was almost no effect the results indicate that music had a different effect on of music on communication in the noisy space. In the presence communication when participants diverged in their intimacy of music during communication, pleasure, arousal, and levels, gender combinations and group size in different indoor dominance all increased in the quiet space but decreased in spaces. In terms of intimacy level, the results showed the the noisy space. These results are in line with previous research, potential of music to strengthen social bonds in residential which found that music plus ambient noise at comfortable spaces. Compared to close friends, there was significant levels of volume increases dining pleasure, while no music effect of music on acquaintances during communication, or a sound environment with music that is too loud has pleasure and dominance were effectively enhanced by music. negative effects (Novak et al., 2010). It is worth noting that Consistent with Hypothesis 5, Bronwyn et al. (2014) revealed noise has both negative and positive aspects, and the absence the mechanism by which music enhances social bonds, of negative sound does not necessarily create a positive indicating that listening to music facilitates endorphin release, environment (Iyendo, 2016). Torresin et al. (2019) conducted which plays a central role in the maintenance of non-sexual, a systematic review of positive indoor soundscapes; among non-kinship social bonds. In this vein, roommate conflict their findings, specific sound types (i.e., natural sounds and is a key social problem in college (Sillars, 1980), and effective sounds from residential areas) were found to reduce annoyance communication can enhance relationships among roommates caused by disturbing tonal noises. Likewise, research exploring (Wang et al., 2012). Music can thus be seen as an effective the acoustic environment of nursing homes showed that an way to ease dormitory conflict when roommates have a environment that is rich and varied in sound sources tends low intimacy level. to perform better in terms of safety and intimacy, as well In terms of gender combination, the results indicate that as appropriateness, compared to monotonous and uneventful dominance during communication was significantly enhanced soundscapes (Aletta et al., 2017). Furthermore, the results of by music for single-gender groups in the learning spaces. Numerous previous research have shown that musical evaluation during studies have explored the effects of gender composition on social communication decreases sharply (from 1.31 to −2.13) when interactions such as cooperation, group discussion, and group SPL exceeds 50 dBA, becoming negative when SPL reaches learning among children (Smith-Lovin, 1989; Ausch, 1994; 60 dBA (Meng et al., 2020). Therefore, neither playing music Willoughby et al., 2009). For example, with respect to group at an appropriate volume in a noisy space nor playing it at learning, more collaborative behaviors have been found in mixed- over 60 dBA in a quiet space is likely to improve the quality gender than in single-gender groups (Willoughby et al., 2009). of communication. Considering these findings in combination of the d-values of For the evaluations in regarding minimal and abundant dominance in the learning spaces shown in Table 4, music can interior furnishings, the subject of Hypothesis 4, the results be considered an effective strategy to enhance dominance within indicate that there were no significant differences between single-gender groups, and to reduce differences in groups with the effects of music on communication in spaces that had gender combinations, during communication. been furnished differently, but that music can enhance In terms of group size, the results show that music had dominance during communication in the minimally furnished greater effects on pleasure and arousal during communication space. This finding may be due to the fact that complicated when there were more than two participants in the dining furnishings can distract people’s attention. A related study spaces. A study of the effects of dining style on communication of the effects of commercial spatial factors on shopping in restaurants indicated that when there were four or more behavior drew a similar conclusion; a complex grocery store diners per table, conversation increased compared to when environment was associated with low levels of pleasantness, there were fewer people, and frequency of conversation in delays in purchasing or even departures, as high levels of centralized style (diners sharing a dish, such as a hot pot) complexity can produce avoidance behaviors (Gilboa and was higher than in the separate (diners do not share dishes Rafaeli, 2003). Differences in the arrangement as well as with others but eat their own food) with background music the density of furniture have been studied, showing that (Meng et al., 2017). Therefore, further confirmation of the manipulation of furniture density may nullify the effects of most appropriate group size for communication in dining arrangement; that is, with increasing density there is a spaces is needed; in addition, dining style should corresponding decrease in distance between chairs, which be considered. Frontiers in Psychology | www.frontiersin.org 14 September 2021 | Volume 12 | Article 703908
Jiang et al.                                                                                                Musical Effects on Communication Emotion

SUMMARY AND CONCLUSION                                                      large rooms (Tajadura-Jiménez et al., 2010). Regarding the visual
                                                                            atmosphere, the colors of the spaces were simply divided into
Under the comprehensive pressures of academic and daily life,               warm-toned and cold-toned, while color harmony, as well as
social anxiety is a widespread problem among college students,              saturation and brightness, of color also impact emotion (Shen
a particularly vulnerable group. Reliance on the Internet is an             et al., 2015). In order to minimize the effects of uncontrolled
important factor in mental health, and the identification of                spatial factors, virtual reality (VR) technology that provides a
ways to ease social barriers and to promote face-to-face                    realistic and immersive environment (Chamilothori et al., 2019)
communication is an important area of research. Using objective             can be considered for use in further studies.
measurements of the natural sound environment and a subjective                  Emotions are internal and mostly conscious, and self-report
questionnaire survey of musical evaluations and PAD emotional               is an accepted way to evaluate them (Bradley and Lang, 1994).
evaluations during communication, this study examined the                   However, individuals have no direct access to the causal connections
influence of music on emotion during communication in                       between external forces and internal responses – they are simply
different indoor spaces and reached a number of conclusions.                limited in their ability to track the complex causal story of
First, there were no significant differences in musical or emotional        their emotions (Russell, 2003). In addition, self-reports frequently
evaluation during communication in different functional spaces.             refer to a certain period experienced in the past, and usually
Second, the positive effects of music were higher in warm-                  only salient single moments of the episode overall are emphasized
toned spaces, whereas the differences in the effects of music               (Fredrickson and Kahneman, 1993; Fiebig et al., 2020); thus,
on emotion during communication in spaces with different                    retrospective biases also need to be taken into account (Robinson
visual atmospheres were not significant. Third, music had a                 and Clore, 2002). As the results of this study are based on
significant effect on both musical evaluation and emotion during            self-reports, future studies should collect data regarding
communication in spaces with different sound atmospheres,                   physiological changes to support the above findings.
indicating that it can promote communication in quiet spaces.
Fourth, in terms of interior furnishings, music in simply
furnished spaces can enhance dominance. The effects of music                DATA AVAILABILITY STATEMENT
on dominance were also higher in single-gender groups than
in mixed-gender groups.                                                     The raw data supporting the conclusions of this article will be made
                                                                            available from the corresponding author upon reasonable request.

LIMITATIONS
                                                                            ETHICS STATEMENT
The present study can help improve communication by regulating
spatial factors with music in terms of visual atmosphere, sound             The studies involving human participants were reviewed and
atmosphere, and interior furnishings. However, the study has                approved by ethics committee, School of Architecture, Harbin
a number of limitations which indicate that certain questions               Institute of Technology. Written informed consent for
need to be discussed further.                                               participation was not required for this study in accordance
   There are rich varieties of musical emotions, and musical                with the national legislation and the institutional requirements.
emotion characteristics can be classified based on musical
dimensions such as pitch height, loudness, timbre, tempo, and
intensity (Wieczorkowska et al., 2006). For example, Hevner                 AUTHOR CONTRIBUTIONS
(1936) presented eight synonym clusters to describe emotional
perceptions of music, including happiness, gracefulness,                    JJiang participated in the investigation, data curation, and
sereneness, dreaminess, sadness, dignity, vigorousness, and                 writing of the original draft. QM provided conceptualization
excitement. The level of emotional perception of music varies               and participated in writing and editing the manuscript and
with regard to different musical emotions (Baumgartner et al.,              in funding acquisition. JJi participated in the methodology,
2006), and the emotion evoked by music is not always consistent             validation, and formal analysis. All authors contributed to the
with the perceived emotion (Gabrielsson, 2002). However, only               article and approved the submitted version.
one excerpt of peaceful music was used in the given experimental
settings, and future research should seek to combine a wider
range of music with different types of spaces.                              FUNDING
   In terms of the selection of experimental sites, limitations
in terms of being able to control variables when comparing                  This research was funded by the National Natural Science
two spaces might have caused the results to be confounded by                Foundation of China (NSFC), grant numbers 51878210, 51678180,
uncontrolled factors. In addition to the variables listed in this           and 51608147, the Natural Science Foundation of Heilongjiang
research, the spatial scale, dynamism, and indoor partitions are            Province, grant number YQ2019E022 and the Open Projects
key factors of spatial perceptions and thus impact emotions                 Fund of Key Laboratory of Ecology and Energy-saving Study
(Hogg et al., 2011; Maheshwari et al., 2019). For instance, small           of Dense Habitat (Tongji University), Ministry of Education
rooms are considered more pleasant, calmer, and safer than                  (2020030103).

Frontiers in Psychology | www.frontiersin.org                          15                                  September 2021 | Volume 12 | Article 703908
You can also read