Comments on TVA's Draft 2019 IRP - Spring 2019
←
→
Page content transcription
If your browser does not render page correctly, please read the page content below

Comments on
TVA’s Draft 2019 IRP

                                         1/20

Spring 2019            Southern Renewable Energy Association
OVERVIEW
Renewable energy demand is growing. Renewable energy prices have plummeted over the past few
years. Wind power prices have declined by 67%, and solar power prices by 86%, just since 2009. In
many parts of the country, renewable energy is now cost competitive against traditional energy
resources. Utilities like Southwestern Electric Power Company (Louisiana/Arkansas) 1 and
MidAmerican (Iowa)2 have both announced multi-gigawatt wind power purchases in the past year. North
Carolina has the second highest level of solar power capacity in the country, with over 4,600 MW
installed.3 Corporations and other non-utility buyers are finding innovative mechanisms to directly
invest in renewable energy. These voluntary announcements are due to the low costs of renewable
energy.

The Tennessee Valley Authority (TVA) has previously been a leader in purchasing renewable energy.
In 2004, the Buffalo Mountain wind project in Tennessee became the south’s first utility-scale wind
farm, with TVA as its energy customer. In 2010, the TVA Board of Directors “authorized the purchase
of as much as 2,000 MW of renewable and clean energy. TVA plans to have half of its power supply
from clean and renewable energy sources by 2020.” 4 As part of that plan, TVA procured over 1,500
megawatts of wind power. In 2015, TVA completed a long-term planning process to identify future
power generation resources and needs. In its 2015 Integrated Resource Plan (IRP), TVA stated that it
would add “150 and 800 MW of large-scale solar by 2023, and between 3,150 and 3,800 MW of
largescale solar by 2033…[and add]…between 500 and 1,750 MW [of wind energy] by 2033,
depending on pricing, performance, and integration costs. Given the variability of wind selections in
the scenarios, evaluate accelerating wind deliveries into the first 10 years of the plan if operational
characteristics and pricing result in lower-cost options.”5

The Southern Renewable Energy Association (SREA) was involved in TVA’s 2015 IRP, and to date,
TVA has not fulfilled its 2015 IRP. This new 2019 IRP suffers from many of the same deficiencies as
the previous report. Two major deficiencies significantly impede renewable energy procurement: TVA
relies heavily on a capacity-focused modeling strategy, and TVA’s renewable energy cost assumptions
are too high. Taken together, these two deficiencies greatly underestimate renewable energy potential
and negatively affects ratepayer costs. SREA is eager to work with TVA to ensure IRP modeling data
and methodologies are reflective of current market offerings.

               TVA’s Renewable Energy Assumptions Are Wrong and Outdated
              NIPSCO’s RFP Results Show Real-World, Lower Cost Energy Resources

                                 TVA 2015 IRP              TVA 2019 IRP            NIPSCO 2018 RFP
                              Overnight Capital Cost    Overnight Capital Cost   All-in, total Capital Cost
                                  (2013$/kW)                (2017$/kW)                  (2018$/kW)
 Solar – Utility, Tracking        $1080-$2353                  $1,491                      $1,151
 Wind – MISO                         $1,750                    $1,744                      $1,457
 Small Modular Reactor               $8,252                    $5,369                 Does Not Exist

                                                                                                     2/20
OUTCOMES FROM TVA’S DRAFT 2019 IRP
The 2019 IRP evaluates different planning strategies and scenarios. Planning strategies reflect the
different resource choices the utilities can make, i.e. differing amounts of renewables verses fossil
fuels. TVA evaluated five planning strategies: A) a Base Case, B) promoting Distributed Energy
Resources (DER), C) Promoting Resiliency, D) Promoting an Efficient Load Shape, and E) Promoting
Renewables. Scenarios reflect different sets of future conditions such as economic stability, availability
of resources, or environmental regulations. TVA evaluated six different scenarios in its 2019 IRP: 1)
the Current Outlook, 2) Economic Turndown, 3) Valley Load Growth, 4) Decarbonization, 5) Rapid
DER Adoption and 6) No Nuclear Expansions. The strategies and scenarios evaluated in the 2019
IRP are very similar to TVA’s 2015 IRP. When combined, these strategies and scenarios resulted in
30 portfolios or cases for evaluation. In brief, TVA’s Draft 2019 IRP proposes effectively doing
nothing for renewable energy by 2023. By 2028, TVA has just 5% renewable energy penetration, up
from a current 3% penetration level.

The first public notice of the Notice of Intent to Prepare the IRP was released on February 14, 2018.
Two weeks prior, at a TVA Board Meeting on February 2, 2018, TVA staff were already projecting
that the utility would increase its renewable energy penetration from 3% to 5%, and coal use would
decline.6 Those projections were developed prior to the IRP, indicating this IRP has resulted in no
change.

Wind Energy
TVA has access to unique and geographically diverse wind resources that would provide benefits for
their customers. In 2015, the 2015 TVA IRP called for between 500 and 1,750 MW of additional wind
energy by 2033. The amount from this range ultimately added to TVA’s portfolio is “dependent on pricing,
performance, and integration costs.” To date, TVA has not made any additional wind energy procurements.
The draft outcome of the new 2019 TVA IRP shows that no wind energy is added in any of the 30
portfolios. On a webinar on February 26, 2019, TVA staff indicated that they would run additional
sensitivities to evaluate why wind energy was not selected; however, staff explained that low cost solar
and natural gas appeared to out-compete wind energy resources.

Solar Energy
In 2015, the 2015 TVA IRP called for a substantial commitment to large-scale solar, with the final
IRP stating that they would add “between 150 and 800 MW of large-scale solar by 2023, and between
3,150 and 3,800 MW of large-scale solar by 2033.” The sensitivities modeled assumed that utility-scale
solar tracking would be selected as early as 2020. To date, TVA has not made significant solar energy
procurements. The draft outcome of the new 2019 TVA IRP states:

        “Solar expansion is significant in all cases, ranging from 2,500 to 6,000 MW on a summer net
        dependable capacity basis, or 3,700 to 8,800 MW of nameplate capacity. Portfolios include
        varying amounts of utility (single-axis tracking) and distributed solar, as certain strategies (B,
        C and E) promote distributed solar. Solar expansion is highest, on average, in Strategy E.”

While significant solar energy resources were added over the 20-year study time horizon across most
portfolios, the Draft 2019 IRP shows that virtually no new solar power is added between now and the
year 2023.

                                                                                                     3/20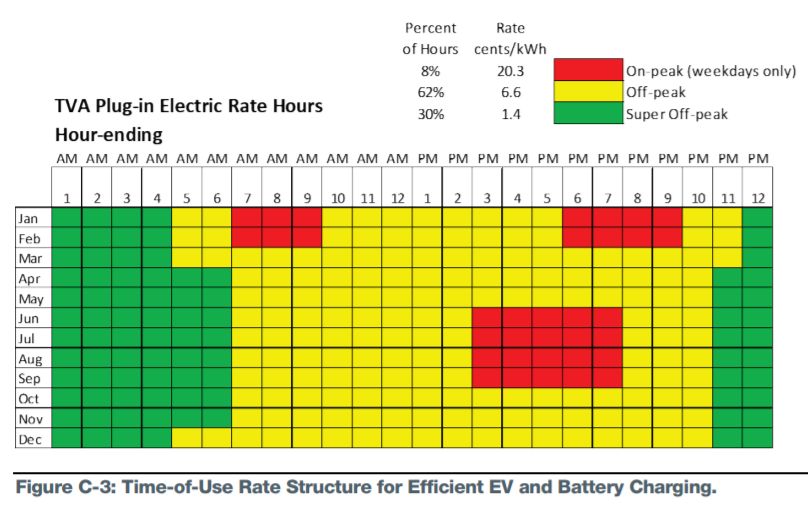
Energy Storage
TVA’s 2015 IRP did not adequately evaluate energy storage options. In this 2019 IRP, TVA evaluated
several types of energy storage and found that:
        “Storage additions range from 0 to 3,000 MW depending on strategic focus. Most storage
        additions are utility-scale batteries, with compressed air storage selected in some instances.
        Additions are highest in Strategy D, moderately high in Strategies C and E, and relatively small
        in Strategy B. Without promotion, no storage is added in Strategy A.”

DRAFT 2019 IRP DEFICIENCIES
TVA’s Draft 2019 IRP contains major deficiencies. No new wind energy resources are added. Solar
energy resources act virtually the same across most portfolios. In all 30 portfolios, 100 MW of solar
energy summer capacity is added in 2022, suggesting this quantity of solar is already pre-determined
and not a result of the IRP. In 22 cases, an additional 300 MW is added in 2023, with the remaining
cases adding just 100 MW that same year. In those same 22 cases, an additional ~300 MW is added
each year thereafter until roughly 2028, suggesting an arbitrary annual firm cap on solar energy
additions. Regardless of coal retirement timing and quantity, and regardless of natural gas retirement
timing and quantity, regardless of load growth or decline, and regardless of TVA’s “incentivization”
of renewable energy through its scenarios and strategies, renewable energy capacity appears to slowly
increase over time through most portfolios.

Capacity Planning is Insufficient
TVA relies on a capacity-centric planning framework. This process essentially attempts to resolve one
problem: how to deliver power during each annual peak. TVA explained it’s “capacity first” process
by stating that:

        “The development of resource portfolios was a two-step process. First, an optimized
        portfolio, or capacity plan, was generated, followed by a detailed financial analysis. This
        process was repeated for each strategy/scenario combination and for additional sensitivity
        runs.”

TVA is undervaluing low-cost energy resources (like wind energy and solar energy) and the ability of
those resources to reduce overall system costs by displacing higher cost generation. To underscore
this point, TVA stated that it “…uses an energy production profile to dispatch wind energy rather
than price.” TVA uses this same approach for hydro and solar resources. Synapse Energy Economics
have noted the deficiency of capacity expansion models, stating:

        “In addition, some capacity expansion models are unable to endogenously retire EGUs, and
        require these decisions to be made outside of the model construct. While making decisions
        outside the model reduces computational requirements, it may introduce user error or bias.
        For example, a modeler may not review economic retirements, and thus fail to capture a
        cost‐effective compliance mechanism.”7

According to Moody's Investors Service, “Some coal plants still perform economically, but
competitiveness could come under pressure as market conditions evolve...Most municipal- or G&T-
owned coal plants in the US are old and have high production costs. According to the report, 72.3%
of these plants, or about 65.0 gigawatts, have operating costs exceeding $30 per megawatt hour, which

                                                                                                   4/20
Moody's views as the threshold above which coal plants are vulnerable to be displaced by cheaper
generation options. Newer units that came online after 2000 use more efficient technology and run at
lower heat rates and operating costs, enabling many of them to be competitive with the market and
achieve higher capacity factors. Others are located adjacent to coal mines, allowing them to eliminate
transportation costs from their overall fuel expenses. Nonetheless, each plant's competitiveness will
ultimately depend on external factors including the price of natural gas and renewable energy in the
vicinity, regional transmission organization reserve margins and the extent of political support for
various fuels.”8 As Moody’s points out, broader energy market forces will render higher cost energy
resources (such as existing steam turbine generation) obsolete and likely to be out-competed by lower
cost energy resources such as renewable resources.

Much of TVA’s modeling and methodologies are unchanged from the 2015 IRP. TVA’s over-reliance
on capacity-focused modeling underestimates renewable energy benefits while retaining older, less
efficient generation. Taken to the extreme, a capacity-only planning process could lead to unusual
model results that recommend significant power generation development or legacy generation
retention that are rarely used, at the expense of low-cost energy options. This outcome appears to
have occurred, given that low-cost wind energy generation has been devalued in TVA’s IRP process.
Capacity-focused planning does not initially address economic costs; alternatively, an energy-based
financial dispatch model would efficiently dispatch necessary resources. TVA should evaluate energy
planning options, not just capacity.

Renewable Energy is Valuable Beyond Capacity
TVA’s own “Intermittent Resources Study” found that “the TVA system is well positioned to absorb
up to 5,500 MW of solar and 3,000 MW of wind at relatively small additional cost.” This result stands
in stark contrast to the main IRP analyses. However, TVA did not calculate the initial value of wind
energy or solar power resources, nor did it compare against TVA’s existing generation fleet or new
generation costs. Load duration curves and resource adequacy data would assist in reviewing TVA’s
existing fleet; however, such information has not been published.

TVA has not provided hourly dispatch forecasts for individual units and the system as a whole. As a
proxy, SREA evaluated TVA’s Figure C-3: Time-of-Use Rate Structure for Efficient EV and Battery Charging.
TVA states, “The TVA system experiences different peak hours, depending on the season. In the
summer, the system peaks in the late afternoon. Winter peaks typically occur early in the morning,
with a near-peak early in the evening. Onpeak hours require TVA to use more expensive peaking
generation sources, raising system costs. TVA developed a modeling approach to evaluate the impact
of a time-of-use rate structure that strongly promotes EV charging in super off-peak (i.e., hours of
minimum load) and off-peak hours.” TVA’s figure evaluated a typical day for each of the twelve
months, or a 12x24. On-peak hour rates are $0.203/kWh and occur generally in early winter mornings,
or summertime afternoons. Off-peak hour rates are $0.066/kWh and make up most of the hours in a
year. Super Off-peak rates are $0.014/kWh and occur at night. The average rate across the 288 hours
(12 months x 24 hours) is $0.068/kWh. This average value is virtually the same as TVA’s reported
2017 wholesale rate of $0.067/kWh, suggesting high fidelity between Figure C-3, the actual wholesale
rate, and the underlying hourly dispatch of TVA’s existing fleet. 9

                                                                                                    5/20
SREA used simulated hourly wind generation data from NREL for specific locations in Texas
(representing an “HVDC” wind resource), Iowa (representing a MISO/SPP wind resource), and
Kentucky (representing an “in-valley” wind resource) to create a 12x24, and compared those data
against TVA’s Figure C-3 rate structure to create a value for the various wind energy resources.10 Based
on SREA’s analysis using TVA’s rate structure, wind energy’s value is between $0.06-$0.065/kWh,
even after subtracting TVA’s estimated wind integration costs.11
SREA also performed the same analysis using simulated solar data. Based on this analysis, solar
energy’s value is approximately $0.08/kWh after subtracting TVA’s estimated solar integration costs.12
Solar’s value is higher than TVA’s estimated average due to solar’s ability to perform at higher levels
during summertime peak demand.
This analysis suggests that so long as TVA procures wind energy or solar energy resources below
$60/MWh (or $0.06/kWh), that the system economics would benefit overall. These are values
separate from and independent of TVA’s capacity-focused analysis. As SREA notes elsewhere in these
comments, wind energy PPA’s frequently reach roughly $20’s/MWh, with solar energy resources at
roughly $30’s/MWh, while providing some capacity benefit.
TVA’s Renewable Energy Pricing is Too High
TVA obfuscates its cost assumptions associated with new generation resources. While TVA does
provide some cost assumptions, it did not provide all cost assumptions, making it difficult to identify
potentially over-estimated variables, or potentially double-counted variables. For example, TVA notes
that “Cost and performance parameters vary somewhat according to generating and storage
technology, but each technology generally has 11-14 applicable characteristics or parameters for which
6/20values were reviewed. These include summer net dependable capacity, summer full-load heat rate,
build time, annual outage rate, storage efficiency, number of storage hours, storage input demand,
book life, plant overnight capital cost, transmission upgrade cost, total overnight capital cost, variable
operating & maintenance (O&M) cost, and fixed operating & maintenance cost (both in $ and $/kW-
year).” TVA does not publicly provide all variables for each generation resource.
TVA hired Navigant Consulting to review and recommend cost and performance parameters for
potential new power generation and storage resource alternatives to be considered in the Draft IRP.
In a summary letter included in the Draft 2019 IRP, Navigant reported that:
● “Over half (56 percent) all of the solar PV parameter values compared were consistent. Net
dependable capacity, build time, total overnight capital costs, and fixed O&M costs showed
material differences from the Navigant-provided values.
● “For wind energy, 11 of the 89 parameter values compared (or 39 percent) were consistent,
with most of the remaining values showing differences greater than 20 percent. Build time,
variable O&M and fixed O&M costs were all greater than 20 percent different than TVA
values in most cases for the four technology alternatives.”
Neither the Navigant report nor the Draft IRP clarifies these points further. A >20% higher cost
associated with wind energy or solar energy resources would potentially cause the total exclusion of
wind energy or solar energy resources in IRP modeling. TVA should disclose all parameters and values
including their sources used to model renewable energy resources to improve transparency and
provide credibility for the Final IRP.
Additionally, TVA excludes a highly relevant cost metric, the Levelized Cost of Energy (LCOE). TVA
asserts, “Because dispatch costs and expected output vary widely across all of the IRP scenarios,
LCOE is not a useful metric to benchmark resource costs. A better comparison, and the standard for
resource planning, is to compare $/kW installed capital costs. These are the actual inputs in to the
capacity expansion model and the costs benchmarked by TVA’s independent third party contractor.”
For renewable energy resources, LCOE’s provide good benchmark comparisons for potential real-
world PPA’s, and virtually all utilities SREA has interacted with report some level of LCOE’s in IRP
processes.
Despite TVA’s obfuscation of renewable energy cost data, SREA can definitively state that TVA’s
cost estimates for renewable energy resources are too high. Using high cost assumptions in IRP
planning leads to less of a resource from being selected. TVA’s renewable energy data inputs for this
2019 IRP look suspiciously similar, or virtually the same, compared to the 2015 IRP.
TVA is Using Outdated Information
SREA provided comments regarding TVA’s 2015 IRP data. SREA’s recommended data inputs from
2015 are lower than TVA’s assumed wind energy data inputs for its 2019 IRP. Since then, wind energy
and solar energy prices have plummeted to their lowest levels ever. When comparing TVA’s 2015 IRP
data inputs to its 2019 IRP inputs, there is virtually no change for renewable energy resources. TVA's
wind energy and solar energy methodologies, as described in Chapter 5, are nearly identical to what
they were in the 2015 IRP, which are described in Chapter 5 of that document. Significant portions
were copy from the old report and pasted into the new report. For example, TVA’s 2019 IRP included
the outdated statement that "Buffalo Mountain is the largest wind farm in the Southeast..." a phrase
copied from the 2015 IRP. At the time in 2015, the statement was true. But in 2017, the 208 MW
7/20Amazon East wind farm in eastern North Carolina became the Southeast’s largest wind farm. There
are numerous other examples of exactly the same language from 2015 being used in the 2019 report.
While TVA continues using outdated information for renewable energy, the utility drastically reduced
estimated costs for Small Modular Reactors (SMRs); an unproven and unavailable technology with
dubious economic data. Not one of 30 modeled portfolios selected any wind energy resources; yet,
SMR’s were somehow selected in at least one portfolio, despite SMR capital costs exceeding wind data
inputs by 300%.
TVA’s Capital Cost Assumptions for Renewable Energy Have Remained Stagnate
NIPSCO’s RFP Results Show Real-World, Lower Cost Energy Resources
TVA 2015 IRP TVA 2019 IRP NIPSCO 2018 RFP
Overnight Capital Cost Overnight Capital Cost All-in, total Capital Cost
(2013$/kW) (2017$/kW) (2018$/kW)
Solar – Utility, Tracking $1080-$2353 $1,491 $1,151
Wind – MISO $1,750 $1,744 $1,457
Small Modular Reactor $8,252 $5,369 Does Not Exist
In the 2015 IRP process, TVA held several meetings of the Renewable Energy Information Exchange
(TVRIX). TVRIX developed several inputs for TVA consideration, including capital costs and
capacity factors for wind energy resources. TVRIX recommended that TVA use up to 40% capacity
factor for In-Valley wind resources, 55% for Out-of-Valley wind, and up to 61% for HVDC wind.
TVA de-rated TVRIX’s wind energy capacity factor recommendations, and the same devalued
capacity factors from the 2015 IRP are the same for the 2019 IRP. Higher capacity factors reduce
overall LCOE’s and PPA’s pricing.
TVRIX Wind Energy Capacity Factor Recommendations Were Ignored in 2015
TVA is Still Using 2015’s Incorrect Capacity Factors for Wind Energy in 2019
Current Renewable RFP Data Prove TVA’s Cost Assumptions are Too High
It is highly recommended that utilities should develop a request for proposals (RFP) or request for
information (RFI) in tandem with IRP development to receive the most recent market information,
specific to that utility. Developing an RFP or RFI to coincide with an IRP would create a significant
amount of high-quality data, while potentially expediting future power purchase agreements,
procurements or developments.
8/20On February 26, 2019, TVA hosted a webinar regarding the Draft IRP. On the webinar, TVA staff
asserted that the company used a RFI and RFP to benchmark renewable energy pricing. However,
TVA’s data assumptions used in the IRP are considerably higher than published RFP data from other
utilities. Based on discussions with development companies that bid into TVA’s RFI and RFP, TVA’s
data are in no way representative of current market offerings and its data are significantly higher than
proposals provided. Also, TVA’s data inputs for wind energy and solar energy look essentially the
same from the 2015 IRP, suggesting again that TVA did not use market-based information.
Xcel Energy RFP Results are Lower than TVA’s Data Assumptions
Xcel Energy, a Colorado electric utility, published the results of its 2017 All-Source Solicitation request
for proposals in December 2017. 13 Xcel received over 400 bids representing over 100,000 MW of
capacity from a wide variety of technologies; however, most bids provided wind energy or solar power
resources. The median bid price or equivalent for stand-alone wind energy resources was
$18.10/MWh, suggesting several projects below and above that price. Adding battery storage to wind
energy resulted in median bids of $21/MWh. For stand-alone solar energy resources, the median bid
was $29.50/MWh. Adding battery storage to solar energy resulted in median prices of $36/MWh.
While these prices may be specific to Xcel, the fact remains that these represent real project bids and
are aligned with other projections and these comments. Again, because Xcel evaluated PPAs, the
values presented below are in $/MWh format, which is similar to an LCOE figure. TVA should
publish LCOE values for its generation technology assumptions to make it easier to compare the real-
world PPAs against its assumed resource costs.
Xcel RFP Responses by Technology 2017
Source: Xcel Energy 201714
9/20NIPSCO RFP Results are Lower than TVA’s Data Assumptions
Northern Indiana Public Service Company (NIPSCO), an electric company in the MISO system, held
an integrated resource plan (IRP) meeting on July 24, 2018 to discuss renewable energy options. As
part of its IRP process, NIPSCO shared results from an all source request for proposals (RFP)
summary. NIPSCO received bids for wind energy, solar energy, energy storage, and amalgamations of
those resources together. The company received proposals across five states, predominately via power
purchase agreement (PPA), but also as asset sale or option. Resources offered as asset sale or as an
option were provided at an average bid cost of $1,151.01/kW for solar energy projects, and
$1,457.07/kW for wind energy projects. For PPA’s, average bids for solar energy reached
$35.67/MWh, and average bids for wind energy reached $26.97/MWh. Solar plus energy storage
projects were offered as asset sales at $1,182.79/kW and as a PPA at $5.90/kW-Mo plus $35/MWh.15
These values provide recent market data that are relevant to states in MISO and further south.
Subsequently, NIPSCO’s IRP recommended16:
● By 2023, the IRP preferred plan calls for adding approximately 1,150 MW of solar and solar+
storage, 160 MW of wind, 125 MW of DSM and 50 MW of market purchases to the NIPSCO
supply portfolio
● Retire all of NIPSCO’s coal capacity by the end of 2028
NIPSCO RFP Responses by Technology 2018
Source: NIPSCO 201817
NIPSCO’s data shows that TVA’s capital cost assumptions for wind energy and solar power are
approximately 20%-30% higher than resources bid into Northern Indiana’s RFP last year on a $/kW
basis. A >20% higher cost associated with wind energy or solar energy resources would potentially
cause the total exclusion of wind energy or solar energy resources in IRP modeling. TVA’s own third-
party analysis by Navigant stated that TVA’s data assumptions were misaligned with current market
offerings.
10/20Independent Research Proves TVA’s Cost Assumptions are Too High
The National Renewable Energy Lab (NREL) publishes its Annual Technology Baseline (ATB) as a
resource for “realistic and timely set of input assumptions (e.g., technology cost, fuel costs), and a
diverse set of potential futures (standard scenarios) to inform electric sector analysis in the United
States. The products of this work, including assessments of current and projected technology cost and
performance for both renewable and conventional electricity generation technologies, as well as
market projections of more than a dozen scenarios produced with NREL's Regional Energy
Deployment Systems (ReEDS) model….”18 NREL’s ATB is one of the most comprehensive, and
accurate, resources for various energy resource inputs. NREL’s ATB is used by regional transmission
organizations (RTOs) including the Midcontinent Independent System Operator (MISO)19 and PJM.20
NREL’s ATB data should be used for model inputs and future forecasts. Given that future purchases
of renewable energy resources would take several years before power production, NREL ATB data
starting in 2019 or 2020 is recommended, as well as incorporating future pricing and performance
levels. NREL’s ATB is updated annually, usually in July or August.
As mentioned previously, TVA had Navigant evaluate its data input regarding wind energy and solar
energy. Navigant stated that nearly half of TVA’s solar energy’s inputs and over half of TVA’s wind
energy input’s deviated significantly from Navigant’s analyses. NREL’s ATB relies on significant third-
party peer-review, including review from Navigant and other analyst organizations.
Wind Energy
NREL’s ATB evaluates wind energy resources as “techno-resource groups” (TRGs) that effectively
provides a scale of various wind energy opportunities.21 For example, TRG 1 resources are anticipated
to be the lowest cost and highest performance wind energy resources and are mostly concentrated in
the Central US. A fair amount of wind energy capacity potential in the Southeast opens with TRG 5,
with the entire Southeastern region opening with TRG 7. Based on the current market, the “low”
values for NREL ATB’s land-based wind resources should be used, beginning in 2019 or 2020.
Evaluating these three different wind energy resources provides an adequate range of wind energy
resources available to the Southeast.
Evaluating multiple types of wind energy resources, and not solely evaluating the lowest cost options
(e.g., TRG 1 resources), may help identify different generation profiles that more closely align with a
utility’s demand load. Geographic diversity of renewable energy resources is anticipated to generally
increase capacity value of a resource and reduce overall generation variability. Hourly and sub-hourly
wind energy generation profiles are available from the NREL Wind Integration National Database
(WIND) Toolkit for up to 122,000 different sites across the country. Data are available from NREL,
here: https://www.nrel.gov/grid/wind-toolkit.html
The federal Production Tax Credit (PTC) for wind energy is expiring. The details of the PTC will be
discussed later; however, for the chart below, the PTC has been converted into a rough reduction in
overnight capital costs. Generally, CAPEX costs below have been reduced by $600/kW in 2019 and
2020, $500/kW in 2021, and $400/kW in 2022.
11/20NREL ATB Wind Energy Pricing Examples With Production Tax Credit as Overnight Cost
Reduction ($/kW) by Year
2019 2020 2021 2022 2023* 2024* 2025*
TRG1 Overnight $/kW $730 $687 $739 $787 $1,133 $1,075 $730
Capacity Factor 50% 50% 51% 51% 52% 52% 53%
LCOE $/MWh $19 $21 $22 $23 $27 $26 $24
TRG5 Overnight $/kW $840 $803 $839 $874 $1,208 $1,142 $1,075
Capacity Factor 44% 45% 45% 46% 47% 48% 48%
LCOE $/MWh $25 $26 $27 $28 $31 $29 $28
TRG7 Overnight $/kW $1,013 $991 $1,023 $1,054 $1,384 $1,313 $1,241
Capacity Factor 35% 36% 37% 38% 38% 39% 40%
LCOE $/MWh $39 $40 $39 $39 $41 $39 $36
Source: based on LBNL 2014, 2018 NREL ATB
*No PTC Value
Solar Energy
Costs for fixed-tilt versus single-axis tracking solar projects are estimated to be approximately similar,
with minor capital cost and maintenance cost differences; however, capacity factors are anticipated to
increase significantly with single-axis trackers. NREL’s ATB only evaluates single-axis tracking
systems, with the best performing projects achieving an estimated 27% capacity factor (NREL ATB
projects located in Daggett, CA). As a proxy for fixed-tilt solar projects, it is recommended that a 20%
capacity factor be used (NREL ATB projects located in Kansas City, MO). NREL’s ATB converts
solar DC power to AC power output for capacity factor purposes, while keeping several financial
metrics in $/kWDC units.
To provide a better range of pricing and performance, it is recommended that the “Mid” overnight
costs for Kansas City and Daggett utility-scale solar projects from NREL’s ATB should be used, along
with the 20% and 27% capacity factors, respectively, beginning in 2019.
Due to guidance from the IRS, solar power projects that qualify for the 30% ITC in 2019, 26% ITC
in 2020, or the 22% ITC in 2021 each have until the end of the year 2023 to become operational. A
10% ITC is available for projects that commence construction in or after 2022, and for projects that
become operational in or after 2024. At the same time the federal ITC is slated to decline, the NREL
ATB shows that solar power installed costs are anticipated to decline, almost in the exact same
proportion as the ITC phaseout through 2023. Applying the ITC phaseout to the NREL ATB 2018
overnight capital costs, results in overnight costs of approximately $700/kWDC for projects that begin
construction between now and 2021, which are also operational by the end of 2023. By 2024, when
the bulk of the ITC has expired, solar pricing is anticipated to decline an equivalent amount, thus
overall levelized cost of energy of utility-scale solar projects are anticipated to remain relatively flat
from 2019-2030. For utility-scale solar projects with 20% capacity factors, and taking the ITC into
account for near-term projects, overall LCOE is anticipated to remain in the mid-$30s/MWh range
for the next decade. For projects with 27% capacity factors, LCOE values in the $20s/MWh are
anticipated. SREA has worked with utility-scale solar development companies in the region who have
corroborated the view that utility-scale projects in the TVA region can be currently be delivered with
an LCOE in the mid-$30/MWh range thanks to the ITC value and for the decade ahead with the
forecasted future cost-declines following the ITC step-down to 10%. Also, the Georgia Power 2019
IRP has stated that the company’s average solar power purchase agreement has reached $36/MWh,
12/20which is in line with the NREL ATB values.22
NREL ATB Utility-Scale Solar Energy Pricing (ITC Included)
2019 2020 2021 2022 2023 2024 2025
Mid Overnight $/kWdc $707 $707 $707 $707 $707 $784 $775
Capacity Factor AC 20% 20% 20% 20% 20% 20% 20%
LCOE $/MWhAC $32 $32 $32 $32 $32 $38 $38
Low Overnight $/kWdc $707 $707 $707 $707 $707 $784 $775
Capacity Factor AC 27% 27% 27% 27% 27% 27% 27%
LCOE $/MWhAC $20 $20 $20 $20 $20 $24 $23
Source: NREL ATB 201823, 20-year LCOE, “Mid” is Kansas City, “Low” is Daggett
Energy Storage
Lazard Associates’ estimated capital costs for various energy storage technologies reaches as low as
$1,152/kW in 2018. It is more difficult to assign a particular LCOE for energy storage solutions; not
only because of the variety of technology (batteries, fly wheels, etc.) and rapidly declining prices, but
because energy storage project finances are highly dependent on the type of services being provided.
For example, Lazard Associates notes that, “Although energy storage developers/project owners
often include Energy Arbitrage and Spinning/Non-Spinning Reserves as sources of revenue for
commissioned energy storage projects, Frequency Regulation, Bill Management and Resource
Adequacy are currently the predominant forms of realized sources of revenue.”24 For example, an
energy storage project that predominately provides frequency regulation may appear to be
exceptionally costly, on an LCOE basis, compared to a traditional power plant; however, such a facility
is providing a highly valued service that may not be accurately reflected in current integrated resource
planning processes, models or specific utility markets. Energy storage is not simply a “cost adder” to
renewable energy to establish better capacity value.
The design of an energy storage project can also vary based on the specific services desired; for
example, a recent presentation by GTM Research showed four-hour and eight-hour energy storage
resources compared to peaking power resources. The researchers found that in 82% of planned future
peaker plants would be at risk from eight-hour storage projects (e.g., 100 MW/800 MWh).25 Due to
limitations in resource planning practices, LCOE or even capital costs alone will not adequately assess
the full benefits of energy storage. As energy storage resources begin to be co-located with renewable
energy resources, those energy storage technologies may qualify for federal incentives, such as the
investment tax credit. Energy storage pricing, as with renewable energy, is anticipated to continue to
considerably decline, while performance is expected to improve, especially over the near-term.
Energy Storage Modeling
In February 2018, the Federal Energy Regulatory Commission (FERC) issued Order Number 841
regarding energy storage. FERC stated, “In a November 2016 Notice of Proposed Rulemaking
(NOPR), the Commission noted that market rules designed for traditional generation resources can
create barriers to entry for emerging technologies such as electric storage resources. Today’s final rule
helps remove these barriers by requiring each regional grid operator to revise its tariff to establish a
participation model for electric storage resources that consist of market rules that properly recognize
the physical and operational characteristics of electric storage resources.” FERC noted in its rule that
artificial “restriction on competition can reduce the efficiency of the RTO/ISO markets, potentially
leading an RTO/ISO to dispatch more expensive resources to meet its system needs.”26 Even though
13/20RTO/ISO tariff implementation is due by December 2019, utilities should strive to follow the spirit
of FERC Order Number 841 in developing multiple modelling capabilities, sensitivities and analyses
around energy storage issues.27 In keeping with the principles of FERC Order Number 841, it is
recommended that multiple energy storage configurations be evaluated (e.g., 2MW/2MWh,
2MW/4MWh, 2MW/8MWh, etc.), using sub-hourly dispatch, with multiple revenue streams (e.g.,
capacity credit, energy, frequency/voltage control, etc.), as stand-alone projects as well as coupled with
generation resources (such as renewable energy resources).
Models that use sub-hourly intervals can better quantify the value of both capacity and flexibility
benefits provided by advanced energy storage. By comparing flexibility benefits to the cost of
storage—thereby using a “net cost” analysis of capacity investment options—planners can more
accurately compare advanced energy storage with traditional capacity resources. Analysis of models
that look at system flexibility needs, and risk management will be more likely to reduce costs to
ratepayers, including through use of storage. In addition to providing an LCOE regarding energy
storage options, it is also recommended that values also be provided in $/kW-mo or $/kW-yr terms.
Federal Tax Credits Were Not Properly Evaluated
The federal Production Tax Credit (PTC) and Investment Tax Credit (ITC) are the primary incentives
for the wind energy industry and solar energy industry, respectively. Because of congressional action
in 2015, the PTC and ITC are being phased out, even while federal incentives for conventional forms
of generation remain in place. Information provided below is meant to provide additional clarity
regarding the PTC and ITC and generally how these incentives should be considered for modeling
purposes. Because TVA excluded wind and solar energy resources from modeling until the year 2023,
TVA is excluding the PTC and ITC. TVA states “The capital costs for solar and wind assume that tax
credits expire/decrease per current federal law. Solar capital costs are assumed to decline over time
per recent trajectories and wind capital costs increase at less than the rate of inflation.” Because TVA
ignores the federal production tax credit (PTC) for wind energy and devalues the federal investment
tax credit (ITC) for solar power, the company is overlooking significant cost reductions over the next
five years.
Production Tax Credit
Wind energy developers can qualify projects for specific PTC vintages by commencing construction
in a year and bringing such projects online within four calendar years. For example, a wind energy
project that commences construction by the end of 2016 has until the end of 2020 to begin operation,
and still qualify for the full PTC. Projects that begin construction in 2017 have until the end of 2021
to become operational, 2018 projects by 2022, and 2019 projects by 2023. Renewable energy project
developers frequently safe harbor qualified clean energy equipment, in anticipation of a future contract
and reflect cost reductions in the proposals.
The PTC is awarded on a generation basis, at a rate of $24/MWh for the first ten years of a project’s
operation. Because the PTC is a tax credit and it frequently exceeds a project developer’s total tax
base, developers will frequently monetize the PTC with tax equity. Tax equity erodes the full dollar
value of the PTC. According to the Lawrence Berkeley National Lab (LBNL), for a developer with
tax appetite, the 100% PTC value is reduced to $19.8/MWh.28 According to LBNL, developers should
expect a $15-$19/MWh reduction in overall cost of energy from the PTC. To achieve an equivalent
PTC cost reduction, it is recommended that wind energy resources’ overnight capital costs be reduced
by roughly $600/kW for resources that become operational in 2020 (reflecting 100% of the PTC
14/20value), $500/kW for wind resources operational in 2021 (80% of PTC value), and $400/kW for wind
resources operational in 2022 (60% of PTC value). Due to the high cost of tax equity for project
financing, it is estimated that the 40% PTC (for projects that commence construction in 2019) is
essentially value-less and not anticipated to be attractive to many wind developers.
Schedule of Wind PTC Cost Reductions by Project In-Service Dates
2019 2020 2021 2022 2023 Future
Wind PTC $19.8/MWh $19.8/MWh $16.9/MWh $14.2/MWh No Value 0
OR Wind PTC
(Overnight $/kW $600/kW $600/kW $500/kW $400/kW No Value 0
translated)
Source: Adaptation from LBNL 2014 29
Investment Tax Credit
Rules for the solar ITC are slightly different compared to the wind PTC. Based on IRS Notice 2018-
59, “As modified, § 48 phases down the ITC for solar energy property the construction of which
begins after December 31, 2019, and before January 1, 2022, and further limits the amount of the §
48 credit available for solar energy property that is not placed in service before January 1, 2024.” In
effect, the ITC phase-out for solar ends for projects that commence construction in 2019, 2020 or
2021 by January 1, 2024. For solar projects that begin construction on or after January 1, 2022, a
permanent 10% ITC is available. 30
Most utility-scale solar energy projects will elect to receive the ITC. The ITC is based on total project
expenditure. It is recommended that the full 30% ITC be incorporated for projects that begin
operation before 2024, and a 10% ITC be incorporated for projects that begin operation in 2024 and
future years. Additionally, new energy storage projects can also qualify for the ITC, provided that
those projects are added to new or existing wind energy or solar energy projects. Currently, stand-
alone energy storage projects do not qualify for the federal ITC.31
Schedule of Solar ITC Cost Reductions by Project In-Service Dates
Construction 2019 2020 2021 2022 2023 Future
Begins Operational Operational Operational Operational Operational Op.
Before 2020 30% 30% 30% 30% 30% 10%
2020 26% 26% 26% 26% 10%
2021 22% 22% 22% 10%
2022 and 10% 10% 10%
Future
Source: Adaptation from IRS 201832
Other IRP Models Prove TVA’s Cost Assumptions are Too High
Two recent IRPs used better data assumptions than TVA. The Southwestern Electric Power Company
(SWEPCO), with customers in Arkansas, Louisiana and Texas, recently completed its IRP in
Arkansas.33 SWEPCO modeled wind energy resources, stating “The resource had a LCOE of
$21.85/MWh in 2021 with an 80% PTC, without congestion and losses. The levelized congestion and
losses for the 2021 wind resource is estimated to be approximately $6/MWh.” SWEPCO also modeled
15/20utility-scale solar, stating “Initial costs for Tier 1 were approximately $1,180/kW in 2021 with the ITC.
Tier 2 has an initial cost of approximately $1,310/kW in 2021 with the ITC.”
SWEPCO’s Preferred Portfolio:
● “Adds utility-scale solar resources in 2025 through 2032, for a total of 1,300MW (nameplate)
of utility-scale solar by the end of the planning period.”
● “Adds 600MW (nameplate) of wind resources in 2022 and 2023 and 200MW (nameplate) in
2024, with additional wind resources added through 2029, for a total of 2,000MW (nameplate)
by the end of the planning period.”
Cleco Power LLC, an electric utility in Louisiana, recently published its Draft IRP. Cleco found that
“The preferred portfolio includes acquiring up to 400 MW of installed solar capacity, as well as up to
1,000 MW of installed wind capacity.”
● Cleco evaluated wind energy with a PPA. Cleco states, “The wind PPA assumed a fixed price
of $20/Mwh over the term of the study with an additional $7/MWh adder for potential firm
transmission costs, whether incurred by congestion costs between MISO North and South or
for wheeling out of SPP. Due to the increased prevalence and strength of wind as a resource
in certain geographic areas in TRG 1 areas relative to MISO South, a higher capacity factor of
48%-53% will be used for the wind PPA.” These prices are in line with SWEPCO’s IRP,
NIPSCO’s RFP and NREL’s ATB.
● Cleco also evaluated solar energy with a PPA. Cleco states, “The solar PPA will use a fixed
price of $35/MWh over the term of the study. Since it is assumed to be in MISO South, no
transmission adder or capacity factor adjustment will be made relative to the self-build option.”
These prices are in line with SWEPCO’s IRP, NIPSCO’s RFP and NREL’s ATB.
TVA Should Report LCOE Values
Levelized Cost of Energy (LCOE) values are important metrics for easily comparing energy resources
and benchmarking assumed data assumptions against real-world PPAs. LCOE’s are frequently
reported in IRPs as dollars-per-megawatt hour figures, or $/MWh. TVA did not provide any LCOE
metrics for its existing or new generation technology cost assumptions. TVA asserts in its 2019 IRP
that: “Because dispatch costs and expected output vary widely across all of the IRP scenarios, LCOE
is not a useful metric to benchmark resource costs. A better comparison, and the standard for resource
planning, is to compare $/kW installed capital costs. These are the actual inputs in to the capacity
expansion model and the costs benchmarked by TVA’s independent third-party contractor.”
However, in its 2015 IRP, TVA stated that, “Levelized Cost of Energy (LCOE) is a common metric
to allow comparisons of total resource costs reflective of capital costs, asset lives and expected fuel
costs.”34 Assuredly TVA created LCOEs for its generation technology assumptions; however, SREA
suspects TVA is intentionally withholding this information because TVA’s LCOE’s are wildly out of
touch with current market offerings.
Meanwhile, in the 2019 IRP, TVA does provide a $/MWh value for its system average cost economic
data, essentially a system LCOE. TVA’s 2019 IRP explains: “In addition to computation of the total
plan cost (PVRR) over the full 20-year study period, a system average cost metric was calculated. This
metric provides an alternative view of the revenue requirements for the study period expressed per
MWh. It is not intended as a forecast of wholesale or retail rates over the study period. Rather, it was
developed to gauge the potential rate impact associated with a given portfolio and provides an
indication of relative rate pressure across the strategies being studied. Reviewing this metric in
16/20combination with PVRR and the financial risk measures provides a clearer picture of the cost/risk
balance for each resource plan.” TVA is simultaneously arguing that an LCOE for individual
generation technologies is useless, but an aggregated system-wide averaged LCOE somehow
“provides a clearer picture.” TVA should publish its generation technology LCOE data.
TVA Began Renewable Options Too Late
TVA uses a “unit availability” metric to allow its models to select various generation technologies,
beginning in certain years. TVA explains this variable:
● “A date when each unit would be available for operation must be specified. Unit availability is
restricted by technical feasibility or commercial availability, as well as permitting and
construction times. For example, if it takes five years to build a combined cycle plant, then a
new CC could not be selected prior to five years into the planning horizon.”
● “A complete list of viable new resource options for evaluation in this IRP is provided below.
All options are based on a generic location and unit availability rounded to the next full year.”
● “Like wind resources, solar resources are energy-limited and therefore dispatched in the model
using an hourly energy production profile to ensure that solar generation is not utilized by the
model when the sun is not available. Solar resources also are similar to the capacity-limited
wind resources where the availability of the unit at the time of the TVA system peak is less
than the full nameplate capacity. TVA applied a 68 percent capacity credit for the utility
tracking unit and a 50 percent capacity credit for the fixed axis options. The unit availability
date was rounded to the first full year.”
As shown in Table 5-9 and Table 5-10 of the Draft IRP, no wind energy resource and no solar energy
resource can be selected in the IRP portfolios until 2023. Indeed, solar energy resources do not arrive
in model outputs until 2023.
While a unit availability metric is reasonable for other, self-build generation technologies, it is not
reasonable for power plants to be built by third parties for PPAs. Independent power producers (IPPs)
frequently spend many months and millions of dollars in anticipation of being awarded a PPA contract
to a future potential buyer. IPPs conduct power plant siting, planning, engineering and even
construction prior to receiving a firm PPA in order to act quickly on contracts, out maneuver
competitors, secure federal tax credits and to diversify company risk. If TVA wanted to procure new
wind or solar energy resources by the end of 2019, that is a real possibility because developers have
already conducted significant work ahead of time. TVA should allow wind energy, solar energy and
battery storage resources to be available beginning in 2019.
17/202019 DRAFT IRP RECOMMENDATIONS
● TVA should move away from capacity-only or capacity-focused resource planning.
● TVA should allow renewable energy to directly compete against existing generation units.
● The National Renewable Energy Lab’s Annual Technology Baseline should be used for all
renewable energy resource cost and performance assumptions.
● Energy storage resources should be allowed to access multiple revenue streams including but
not limited to frequency control, voltage regulation, energy arbitrage, peaking and other value
stacks.
● Cost projections for renewable energy and energy storage should continually decline over time,
while performance continually increases.
● Federal tax credits, including the PTC and ITC, should be incorporated for renewable energy
and energy storage projects, as provided in these comments.
● Levelized cost of energy benchmarks (in $/MWh values) should be provided for all energy
resources. LCOE values should be like Lazard Associates’ and NREL ATB values.
● Significant procurement of renewable energy and energy storage should occur across all
portfolios.
● Large customers should be allowed to directly procure renewable energy resources.
● Arbitrary annual capacity caps to renewable energy should be removed.
● Renewable energy resources should be selectable beginning in 2019, not just beyond 2023.
18/20REFERENCES
1
Clean Technica (July 27, 2017). USA’s Largest & World’s Second-Largest Onshore Wind Farm (2 Gigawatt Farm) To
Be Built In Oklahoma. [https://cleantechnica.com/2017/07/27/invenergy-ge-team-2-gw-worlds-second-largest-us-
largest-onshore-wind-farm/]
2
Greentech Media (August 31, 2016). New $3.6B Project in Iowa Could Be One of Many ‘Mega’ Wind Orders
[https://www.greentechmedia.com/articles/read/iowas-new-3.6b-wind-project-could-be-one-of-many-mega-wind-
orders]
3
Solar Energy Industries Association (2018). Solar Market Insight Report 2017 Year in Review.
[https://www.seia.org/research-resources/solar-market-insight-report-2017-year-review]
4
Federal Register (February 4, 2010). "Environmental Assessment or Environmental Impact Statement for Purchase of
Renewable Energy From CPV Ashley Wind Power Project in North Dakota," Notice by the Tennessee Valley
Authority. [https://www.federalregister.gov/documents/2010/02/04/2010-2377/environmental-assessment-or-
environmental-impact-statement-for-purchase-of-renewable-energy-from-cpv]
5
Tennessee Valley Authority (2015). Integrated Resource Plan.
[https://www.tva.gov/file_source/TVA/Site%20Content/Environment/Environmental%20Stewardship/IRP/Docum
ents/2015_irp.pdf]
6
Tennessee Valley Authority (February 2, 2018). "First Quarter Fiscal Year 2018 Conference Call,"
[www.snl.com/Cache/1500107270.PDF?O=PDF&T=&Y=&D=&FID=1500107270&iid=4063363]
7
http://www.synapse-energy.com/sites/default/files/Guide-to-Clean-Power-Plan-Modeling-Tools.pdf
8
Moody's Investors Service (April 5, 2018). "Some coal plants still perform economically, but competitiveness could
come under pressure as market conditions evolve." [https://www.moodys.com/research/Moodys-Some-coal-plants-
still-perform-economically-but-competitiveness-could--PR_381891]
9
Tennessee Valley Authority (November 9, 2017). Board Meeting.
[http://www.snl.com/Cache/1500105514.PDF?O=PDF&T=&Y=&D=&FID=1500105514&iid=4063363]
10
Data are hourly simulated for 2007-2012 from NREL’s WIND Toolkit. Available upon request.
11
“Projected wind integration costs were about $1.5/MWh at 3,000 MW additional penetration.” TVA Draft IRP
12
“Projected solar integration costs averaged about $3/MWh from 2,500 MW to 5,500 MW penetration, then began
increasing up to about $5.5/MWh at 9,500 MW penetration.” TVA Draft IRP
13
Xcel Energy (December 28, 2017). 2016 Electric Resource Plan, 2017 All Source Solicitation 30-Day Report (Public
Version) CPUC Proceeding No. 16A-0396E. [https://assets.documentcloud.org/documents/4340162/Xcel-
Solicitation-Report.pdf]
14
Xcel Energy (December 28, 2017). 2016 Electric Resource Plan, 2017 All Source Solicitation 30-Day Report (Public
Version) CPUC Proceeding No. 16A-0396E. [https://assets.documentcloud.org/documents/4340162/Xcel-
Solicitation-Report.pdf]
15
Northern Indiana Public Service Company (July 24, 2018). NIPSCO Integrated Resource Plan 2018 Update Public
Advisory Meeting Three. [https://www.nipsco.com/docs/default-source/about-nipsco-docs/7-24-2018-nipsco-irp-
public-advisory-presentation.pdf]
16
Northern Indiana Public Service Company (October 18, 2018). NIPSCO Integrated Resource Plan - 2018 Update.
Public Advisory Meeting Five. [https://www.nipsco.com/docs/default-source/about-nipsco-docs/nipsco-irp-public-
advisory-meeting-october-18-2018-presentation.pdf]
17
Northern Indiana Public Service Company (July 24, 2018). NIPSCO Integrated Resource Plan 2018 Update Public
Advisory Meeting Three. [https://www.nipsco.com/docs/default-source/about-nipsco-docs/7-24-2018-nipsco-irp-
public-advisory-presentation.pdf]
18
NREL (National Renewable Energy Laboratory). 2018. 2018 Annual Technology Baseline. Golden, CO: National
Renewable Energy Laboratory. http://www.nrel.gov/analysis/data_tech_baseline.html.
19/2019
Midcontinent Independent System Operator (March 20, 2018). "MTEP19 Futures Development Workshop."
[https://cdn.misoenergy.org/20180320%20MTEP19%20Futures%20Workshop%20Presentation150635.pdf]
20
Muhsin K. Abdur-Rahman (April 25, 2016). "PJM's Clean Power Plan Modeling Reference Model and Sensitivities,"
PJM. [https://www.pjm.com/-/media/committees-groups/committees/mc/20160425-webinar/20160425-item-02-
clean-power-plan-reference-model-results.ashx]
21
National Renewable Energy Lab (November 2016). Regional Energy Deployment System (ReEDS) Model
Documentation: Version 2016. [https://www.nrel.gov/docs/fy17osti/67067.pdf]
22
Georgia Power Company (January 2019). 2019 Integrated Resource Plan, Docket #42310.
[http://www.psc.state.ga.us/factsv2/Document.aspx?documentNumber=175473]
23
National Renewable Energy Lab (July 2018). NREL Annual Technology Baseline (ATB) 2018. [https://atb.nrel.gov/]
24
Lazard Associates (November 2017). Levelized Cost of Storage Analysis, Version 3.0.
[https://www.lazard.com/media/450338/lazard-levelized-cost-of-storage-version-30.pdf]
25
Ravi Manghani (March 2018). "Will Energy Storage Replace Peaker Plants?" GTM Research.
[https://d3v6gwebjc7bm7.cloudfront.net/event/15/88/96/3/rt/1/documents/resourceList1519927946005/willenergy
storagereplacepeakerplantswebinarslides1519927951937.pdf]
26
Federal Energy Regulatory Commission (February 15, 2018). Electric Storage Participation in Markets Operated by
Regional Transmission Organizations and Independent System Operators. [Docket Nos. RM16-23-000; AD16-20-000;
Order No. 841]. https://www.ferc.gov/whats-new/comm-meet/2018/021518/E-1.pdf
27
Federal Energy Regulatory Commission (February 15, 2018). FERC issues final rule on electric storage participation
in regional markets. [https://www.ferc.gov/media/news-releases/2018/2018-1/02-15-18-E-1.asp#.Wv3-1NOUv-Z]
28
Mark Bolinger (April 2014). "An Analysis of the Costs, Benefits, and Implications of Different Approaches to
Capturing the Value of Renewable Energy Tax Incentives," Lawrence Berkeley National Lab.
29
Mark Bolinger (April 2014). "An Analysis of the Costs, Benefits, and Implications of Different Approaches to
Capturing the Value of Renewable Energy Tax Incentives," Lawrence Berkeley National Lab.
30
United States Internal Revenue Service (2018). Beginning of Construction for the Investment Tax Credit under
Section 48, Notice 2018-59. [https://www.irs.gov/pub/irs-drop/n-18-59.pdf]
31
Heather Cooper (November 15, 2017). "Add batteries to your wind farm and get more (ITC) juice," McDermott Will
& Emery. [https://www.mwe.com/en/thought-leadership/publications/2017/11/add-batteries-to-wind-farm-get-more-
juice]
32
Heather Cooper (November 15, 2017). "Add batteries to your wind farm and get more (ITC) juice," McDermott Will
& Emery. [https://www.mwe.com/en/thought-leadership/publications/2017/11/add-batteries-to-wind-farm-get-more-
juice]
33
Southwestern Electric Power Company (December 14, 2018). Integrated Resource Planning Report to the Arkansas
Public Service Commission. [http://www.apscservices.info/pdf/07/07-011-U_32_2.pdf]
34
Tennessee Valley Authority (2015). Integrated Resource Plan.
[https://www.tva.gov/file_source/TVA/Site%20Content/Environment/Environmental%20Stewardship/IRP/Docum
ents/2015_irp.pdf]
20/20You can also read