Commercial Market Insights - August 2021 National Association of REALTORS Research Group - National Association of ...
←
→
Page content transcription
If your browser does not render page correctly, please read the page content below
Commercial Market Insights
August 2021
National Association of REALTORS®
Research Group
Contents
On the whole, the commercial real estate market is
undergoing a strong recovery although the recovery
is starkly bifurcated across property and geographic
markets.                                                   Page
                                                           3      Economic Conditions
On one hand, the multifamily market is experiencing
the strongest demand since the 2000’s marked by            6      Overview
double-digit rent growth. Vacancy rates in
multifamily and industrial properties are on average       10     Multifamily
lower now than prior to the pandemic. The retail
property market is experiencing positive net               12     Office
absorption. Hotel occupancy rates have also
recovered to near pre-pandemic level. On the other         15     Industrial
hand, the office market continues to experience a
decline in occupancy, rising vacancy rates, and lower
                                                           16     Retail
asking rents on average compared to one year ago.
                                                           17     Hotel
On the other hand, the demand for commercial real
estate has actually increased as the 500 million
square feet of industrial space and 22 million square
feet of retail space that has been absorbed by the
market since 2020 Q2 more than offsets the 150
million loss of office space occupancy. Apartment
occupancy rose on a net basis by 845,000 since 2020
Q2.

By geographic markets, the large metro areas of
New York, Chicago, Boston, Washington DC, Denver,
San Francisco, Los Angeles, Seattle continue to see a
decline in office occupancy. Miami beats other large
markets with a positive net absorption. While large
markets are suffering a decline in occupancy,
secondary markets like Rochester, Durham, Austin,
San Antonio, Salt Lake, Boise, Palm Beach, and Fargo
saw an increase in office occupancy in the past 12
months as of August 2021.

The commercial real estate market, particularly the
office market, faces increasing headwinds from the
negative impact of the surge in Delta variant cases
on the economy (92% of counties have substantial to
high levels of transmission according to CDC).
Manufacturing production and new orders, an early
indicator of economic growth, is slowing. Businesses
have pushed back office re-entry plans. Visits to
places of recreation like parks is also waning. Expect
elevated vacancy rates in the office market but low
vacancy rates in the multifamily, industrial, and retail
market in the next 12 months.                    1

Enjoy reading the latest issue!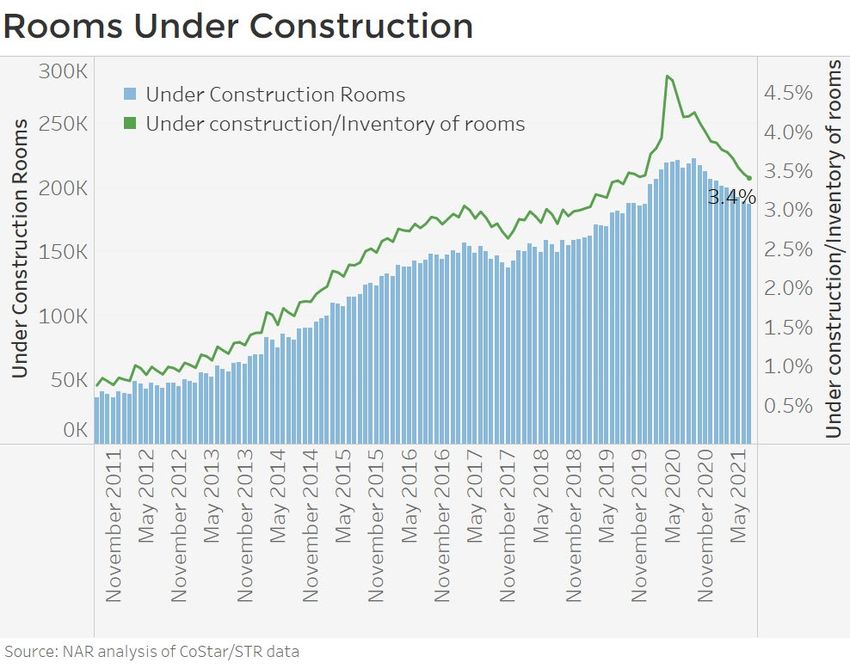
Economic Conditions
Sustained growth but pandemic resurgence is slowing the recovery

  16.6 million payroll generated from May 2020-
  July 2021 with 5.7 million jobs to recover
                                                                                16.6 Million Payroll Jobs Created With
  The economy continues to create net new jobs.
                                                                                 5.7 Million Lost Jobs to Recover as of
  As of June 2021, the economy has created 16.6
                                                                                                July 2021
  million net new jobs, or 715 of the 22.4 million
  jobs lost during March and April 2020. There are
                                                                         155                                152.5
  5.7 million nonfarm payroll jobs still to be

                                                             Millions
                                                                        150                                                            146.8
  recovered. In July, 943,000 net new jobs were
                                                                        145
  added, and at this pace, the lost jobs will be fully
                                                                        140
  recovered in about seven months.                                       135
                                                                        130
  About 30% of the job loss is in leisure and                            125                                 130.2
  hospitality, followed by the government sector,                       120
  health care and social assistance, and                                  115
  professional and businesses services, with over

                                                                                Mar/2019

                                                                                Mar/2020

                                                                                Mar/2021
                                                                                 Jan/2019

                                                                                May/2019
                                                                                  Jul/2019

                                                                                Nov/2019
                                                                                Jan/2020

                                                                                May/2020

                                                                                 Jan/2021
                                                                                 Jul/2020

                                                                                May/2021
                                                                                Nov/2020

                                                                                  Jul/2021
                                                                                Sep/2019

                                                                                Sep/2020
  500,000 jobs each to still be recovered. Only the
  finance and insurance industry had job gains.

  Fifty-one of 445 metro areas and their
  metropolitan divisions, or just 11%, have more                        Source: BLS Establishment Survey
  jobs as of June 2021 compared to February
  2020. These areas are mostly secondary/tertiary
  metro areas and includes the vacation
  destinations of Barnstable, Salisbury, Coeur
  d’Alene, Hilton Head, and Myrtle Beach.                                          Nonfarm Payroll Jobs Lost since
                                                                                    February 2020 as of July 2021

                                                               -1,737                                         Leisure & Hospitality
                                                                                  -782                        Government
                                                                                  -747                        Health Care/Social
                                                                                    -556                      Prof/Business Services
                                                                                     -433                     Manufacturing
                                                                                         -270                 Retail Trade
                                                                                         -236                 Other Services
                                                                                         -227                 Construction
                                                                                         -207                 Educational Services
                                                                                           -186               Wholesale Trade
                                                                                           -172               Information Services
                                                                                             -74              Real Estate/Rental/Leasing
                                                                                             -53              Mining and Logging
                                                                                             -41              Transp/Warehousing
                                                                                                  -9          Utilities
                                                                                                       26     Finance and Insurance

                                                                        Source: BLS Establishment Survey

                                                         5

Source: BLS Establishment Survey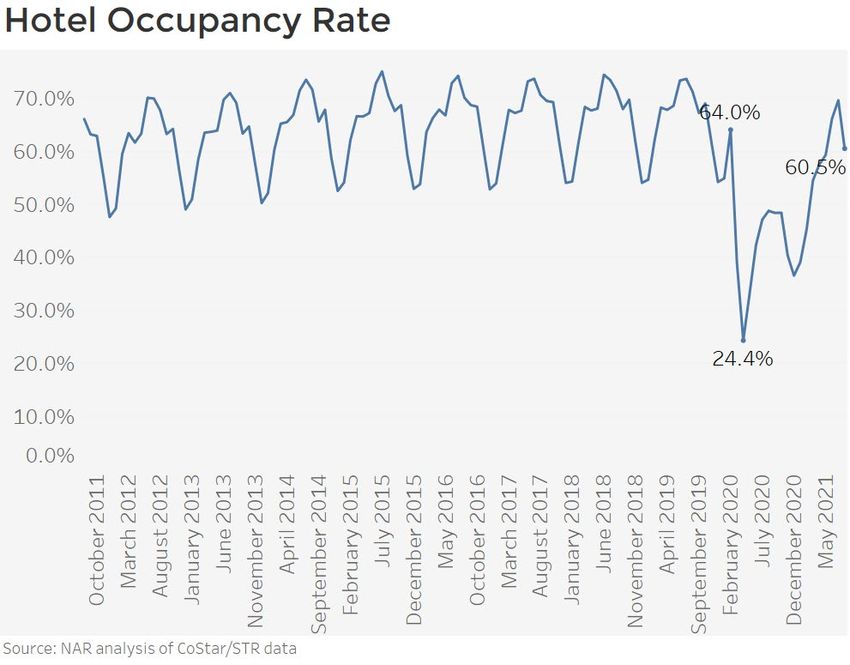
Economic Conditions
Sustained growth but pandemic resurgence is slowing the recovery
13% of the workforce still working from home Number of employed 16 years old and
over who worked from home
Workers are returning to the office. As of July
80
2021, just 13% of workers teleworked, down from a
peak of 35%, but still about thrice the 5.7% share 60
in 2019. Among computer and mathematical 49
40
workers, 49% are teleworking, about four-fold
from the 12% share in 2019. With 92% of counties 20
12.2 13.2
experiencing substantial to high levels of the 0 5.7
Delta variant transmission, companies are
2019
20-May
Oct-20
May-21
1-Jun
20-Jun
20-Jul
Aug-20
Nov-20
Jan-21
Feb-21
Apr-21
Jul-21
Sep-20
Dec-20
Mar-21
pushing back return-to-work dates, like Apple®,
Alphabet®, Uber®, and Lyft®.
E-commerce continues to accelerate Employed persons
Computer and mathematical
Electronic and mail order sales continues to
trend upwards in terms of dollar volume, to $911 Source: BLS COVID-19 Supplemental Survey
billion dollars, or 15% of retail trade sales. Prior to
the pandemic, electronic sales accounted for just
12.4% of retail trade sales. 12-Month Running Total of Electronic
and Mail Order Retail Sales (in billion
Inflation surged to 5.4% in June/July due to dollars)
uptick in energy and transportation prices $1,000 20%
$800 15%
With more people vaccinated, consumer $600
10%
spending for travel and transportation rose in $400
June and July, leading to a surge in inflation to $200 5%
5.4%. However, the net inflation of the volatile $0 0%
food and energy prices rose 4.3% year-over-year.
Sep/2002
Sep/2006
Jan/2012
May/2013
Jan/2016
May/2017
Jan/2020
Jan/2000
May/2001
Jan/2004
May/2005
Jan/2008
May/2009
Sep/2010
Sep/2014
Sep/2018
After an initial surge, the inflation rate has
remained flat, indicating that the surge was
temporary and that inflation is not accelerating
which should hold down the inflation rate to the Electronic shopping sales, in million dollars
2% long-run target of the Federal Reserve Board. as a percent of retail sales
Source: US Census Bureau
Temporary Surge in Inflation
30-Year Fixed Mortgage Rate and 10-
6.0 5.00 Year T-Note Yield
5.4
5.0 4.00
4.0 4.3 3.00 2.86
3.0 2.00
1.00 1.31
2.0
0.00
1.0
11/Apr/2019W
24/Oct/2019W
30/Jan/2020W
13/Aug/2020W
03/Jun/2021W
03/Jan/2019W
01/Oct/2020W
07/Jan/2021W
21/Feb/2019W
19/Nov/2020W
30/May/2019W
19/Mar/2020W
18/Jul/2019W
05/Sep/2019W
12/Dec/2019W
07/May/2020W
25/Feb/2021W
25/Jun/2020W
15/Apr/2021W
22/Jul/2021W
0.0
Mar/2019
Jan/2019
May/2019
Mar/2020
Mar/2021
Jul/2019
Nov/2019
Jan/2020
May/2020
Sep/2019
Jul/2020
Jan/2021
May/2021
Sep/2020
Nov/2020
Jul/2021
Headline inflation 30-Year Fixed Rate Mortgage
10-Year Treasury Note Yield
Inflation net of food and energy cost
3 Source: Freddie Mac, Federal Reserve Board
Source: US Bureau of Labor Statistics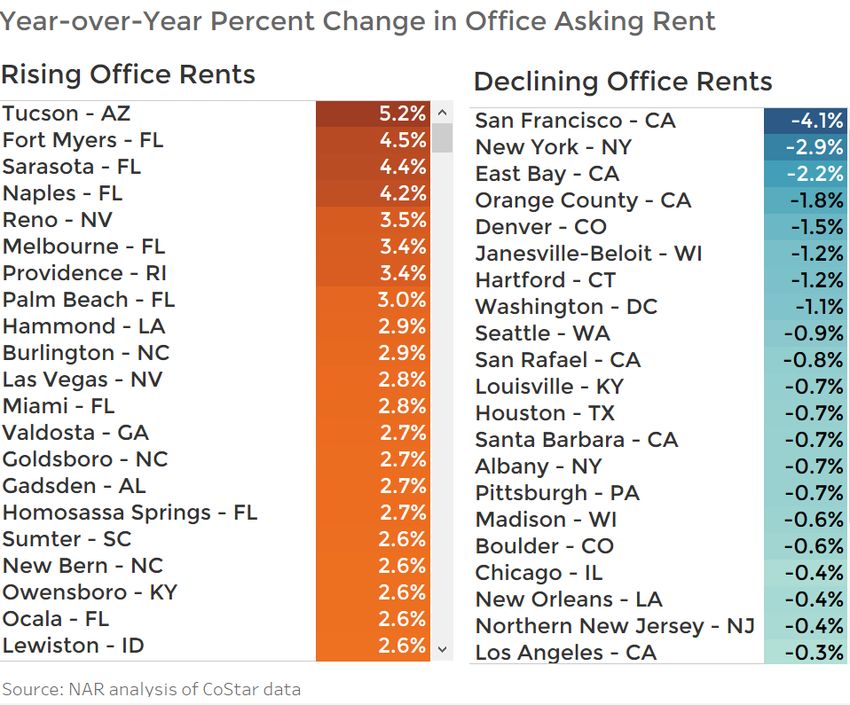
Economic Conditions
Sustained growth but pandemic resurgence is slowing the recovery
Manufacturing orders and production are
slowing
ISM Manufacturing New Orders and
A leading indicator of economic growth is Production Index (50+=Increasing)
manufacturing production. The Institute for 80.0
Supply Management production index has been 70.0
64.9
trending downwards to 58.4 while the new index 60.0
50.0 58.4
orders has remained flat at 64.9. While values of 40.0
over 50 indicate rising activity, the decline in the 30.0
indices indicate the momentum is slowing. 20.0
10.0
0.0
Decline in single-location small businesses
Jan/2018
Apr/2018
Jul/2018
Oct/2018
Jan/2019
Apr/2019
Jul/2019
Oct/2019
Jan/2020
Apr/2020
Jul/2020
Oct/2020
Jan/2021
Apr/2021
Jul/2021
operating at higher capacity as of July 17, 2021
As of the week of July 17, 12% of single-location
small businesses were operating at higher
capacity, according to the US Census Business ISM New Orders Index
Pulse Survey. This is a decline from 12.8% in June. ISM Production Index
Decline in mobility to places Source: Institute for Supply Management
After mobility to place picked up in May and
June, mobility to place trended downwards in
July with 92% of counties having substantial to
high transmission of Delta variant. As of August Percent of Single-Location Small
22, visits to parks stood at 28% above the Businesses Operating at Higher
pandemic level, but below the 60% rate in June. Capacity Compared to One Year Ago
Visits to transit stations is at 17% below the pre- 14.0 12.8
pandemic level, down from about 10% below the 12.0
pre-pandemic level in June. The data are not 10.0 11.9
seasonally adjusted and the seasonality is also 8.0
captured in the data. 6.0 7.3
4.0
2.0
Google® Mobility Trends as of August 0.0
22, 2021 (Jan 2020=100)
21/Nov/2020W
10/Oct/2020W
03/Apr/2021W
17/Apr/2021W
29/May/2021W
15/Aug/2020W
29/Aug/2020W
10/Jul/2021W
12/Sep/2020W
26/Sep/2020W
05/Dec/2020W
19/Dec/2020W
02/Jan/2021W
20/Feb/2021W
06/Mar/2021W
20/Mar/2021W
12/Jun/2021W
26/Jun/2021W
120 0
100
-10
80
-20
60
40 -30 Source: US Census Bureau's Business Pulse Survey
20 -40
0
-50
-20
-60
-40
-60 -70
2/12/2021
1/1/2021
1/22/2021
3/5/2021
4/16/2021
5/28/2021
7/9/2021
3/26/2021
6/18/2021
5/7/2021
7/30/2021
8/20/2021
parks_percent_change_from_baseline 3
transit_stations_percent_change_from_baseli
ne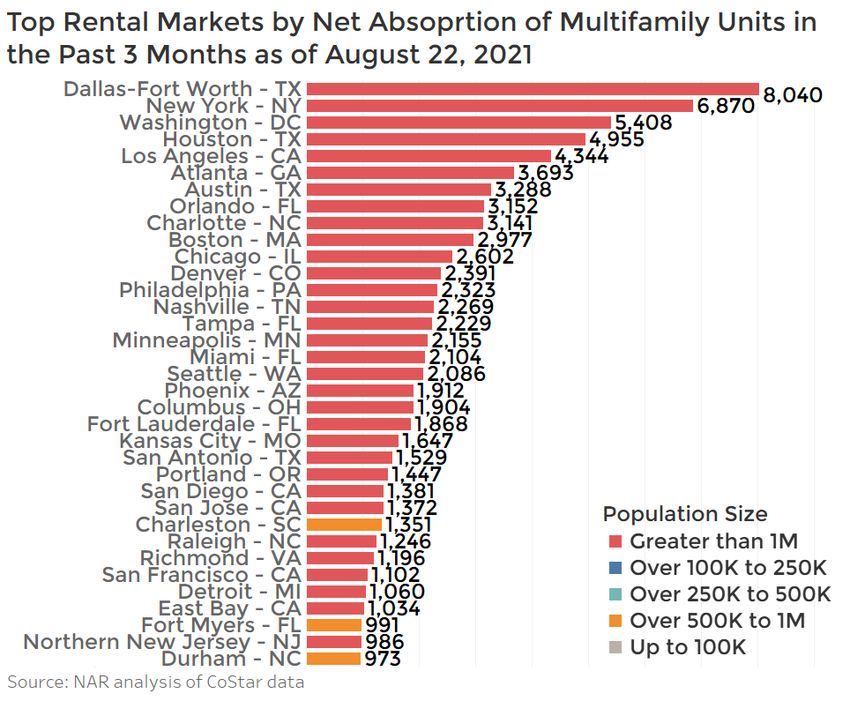
Commercial Market Overview
Positive absorption and rising rent except for office

    Absorption and Vacancy Rate as of 2021 Q3 (as of August 22, 2021)

    As of August 22, 2021, only the office property market had continued to see a decline in
    occupancy (negative net absorption) while the multifamily, industrial, and retail
    property markets saw an increase in occupancy, according to CoStar® market data. In
    the apartment market, there was a positive net absorption of 845,219 units since 2020
    Q2 through 2021 Q3 (as of August 22 2021). With higher occupancy the vacancy rate has
    declined to 5.1% from 6.7% in 2020 Q1 (pre-pandemic).

    In the office market, 150 million square feet of office space has lost occupants since 2020
    Q2. The office vacancy rate has increased from 9.8% in 2020 Q1 to 12.5% as of August 22.

    In the industrial market, 500 million square feet of office space has been absorbed since
    2020 Q2. This positive net absorption of industrial space more than offsets the negative
    net absorption of office space. The vacancy rate has also fallen from 5.3% in 2020 Q1 to
    4.8% as of August 22..

    In the retail property market, there has been an increase of 21.8 million since 2020 Q2.
    The vacancy rate has just slightly increased from 4.6% prior to the pandemic to 4.9% as
    of August 22, this is a decline from 5.1% in the first quarter of 2021.

                                                  2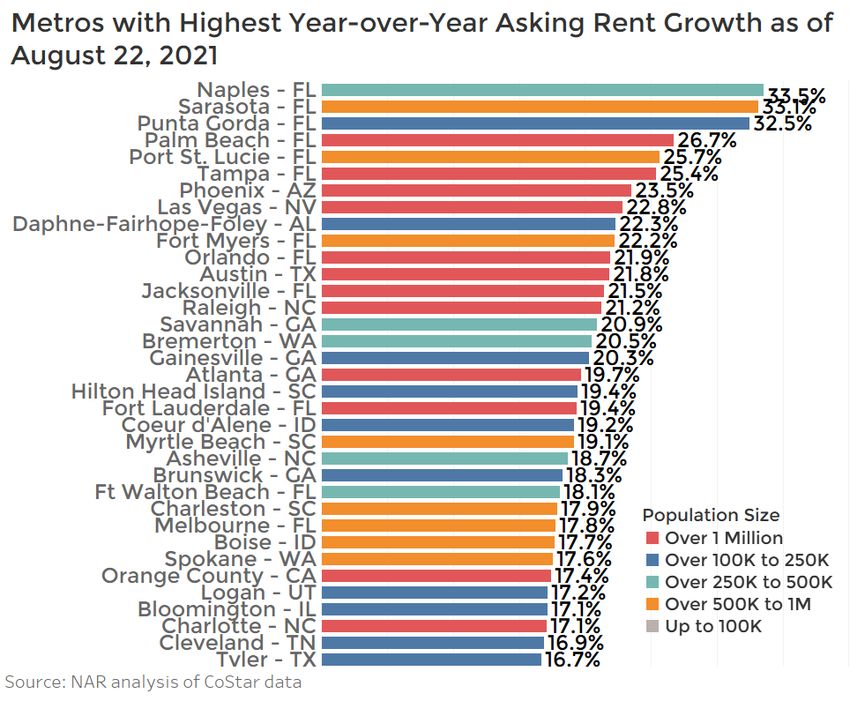
Commercial Market Overview
Rising rents except for office

   Asking Rent Growth as of 2021 Q3 (as of August 22, 2021)

   In the multifamily market, the average asking rent per unit as of the 2021 Q3 (through
   August 22) is up 12.8% from one year ago or 6-fold the rent growth prior to the pandemic
   of just 2.6%.

   In the industrial property market, the average asking rent per square foot was up 6.3%,
   also higher than the 5% rent growth prior to the pandemic.

   In the retail property market, rents are also rising, with the average asking rent up by 1.9%
   although this is a tad lower than the 2.2% pre-pandemic rent growth.

   Only the multifamily market continues to face falling rents, with the average asking rent
   down by 0.7% compared to one year ago.

                                                    2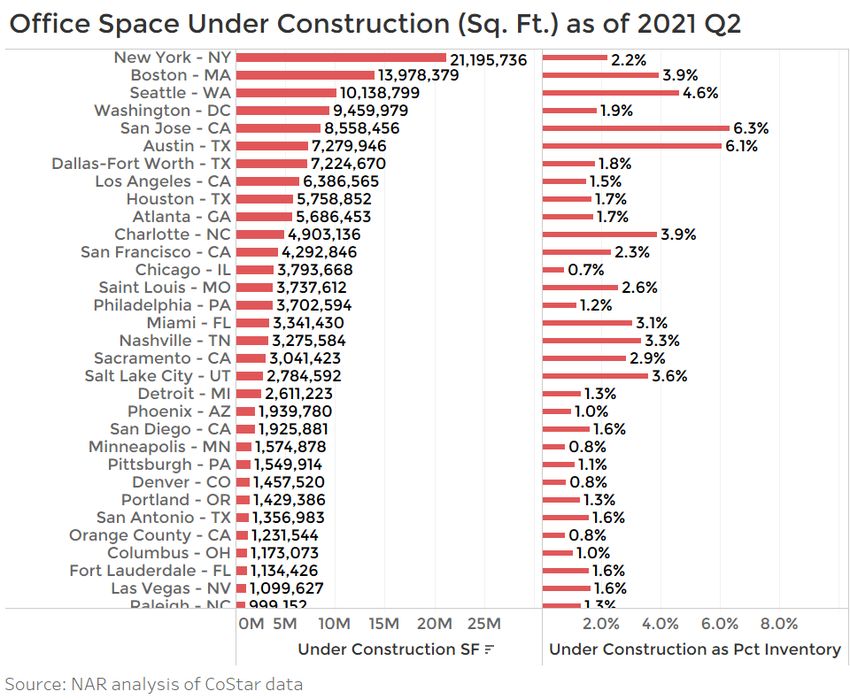
Commercial Market Overview
Slowdown in construction except for industrial

  Under Construction as of 2021 Q3 (as of August 22, 2021)

  The pace of construction activity has been on the decline since the second quart of 2020
  in the multifamily, office, and retail property markets. Only the industrial property sector
  has seen a higher pace of construction activity.

  In the apartment market, there are 592,846 units under construction as of 2021 Q3 (as of
  August 22), which is equivalent to 3.4% of the current stock of apartment units. Prior to the
  pandemic in 2020 Q1, there were 710,000 units under construction.

  In the office market, construction activity has slowed to 143 million square feet as of 2021
  Q3 from 160 million square feet prior to the pandemic. The current pace of construction is
  equivalent to 1.8% of the current inventory, so with the office property market still
  undergoing negative net absorption, this will increase the vacancy rate and will continue
  to depress office rent.

  The retail property market has been undergoing a decline in the level of construction
  activity even before the pandemic due to the inroads of e-commerce that the pandemic
  just accelerated. The current level of construction of 47.5 million square feet is just adding
  0.4% of space to the current inventory, and absorption has already been rising, so expect
  rents to firm up in the retail property market.

                                                   2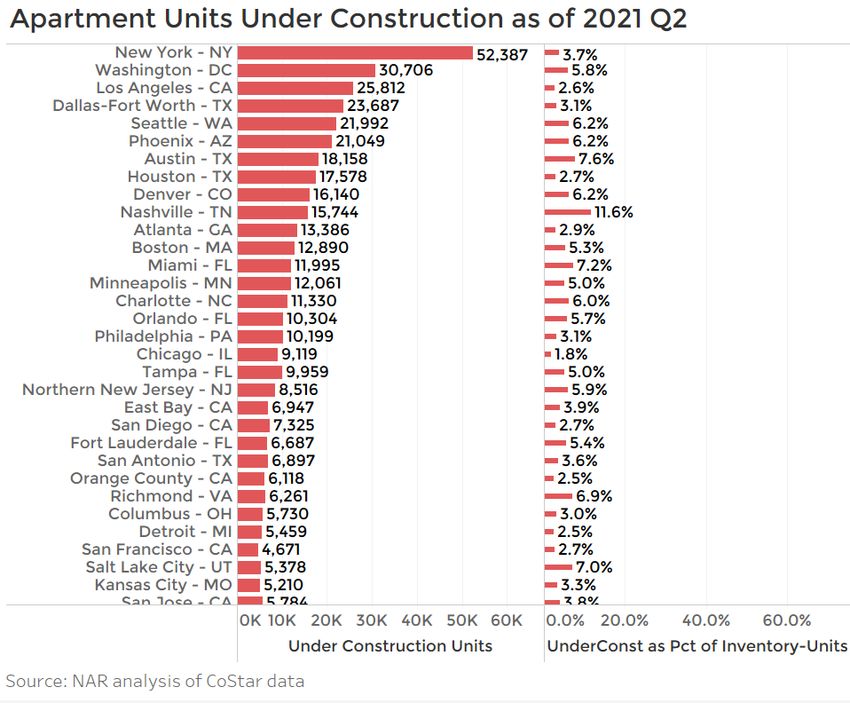
Commercial Market Overview
Industrial market has biggest decline in cap rates

  Cap rates continue to compress

  Cap rates or the return on an investment have been trending down in line with the downward trend
  of the 10-year T-note to an average of 1.34% in July . Cap rates also depend on the fundamental
  underlying value of the property.

  Compared to the cap rates prior to the pandemic, the largest decline in cap rates was for industrial
  properties with the cap rate falling from 7.1 % to 6.5%. The average sales transaction price rose from
  $96/SF to $133/SF from 2020 Q1 to 2021 Q3 (as of August 22) or a gain of 38%.

  With the demand for apartment units, cap rates decreased to an average of 5.4% as of 2021 Q3 from
  5.9% in 2020 Q1. The average sales price rose from $95,500 to $183,300 per unit.

                                                  3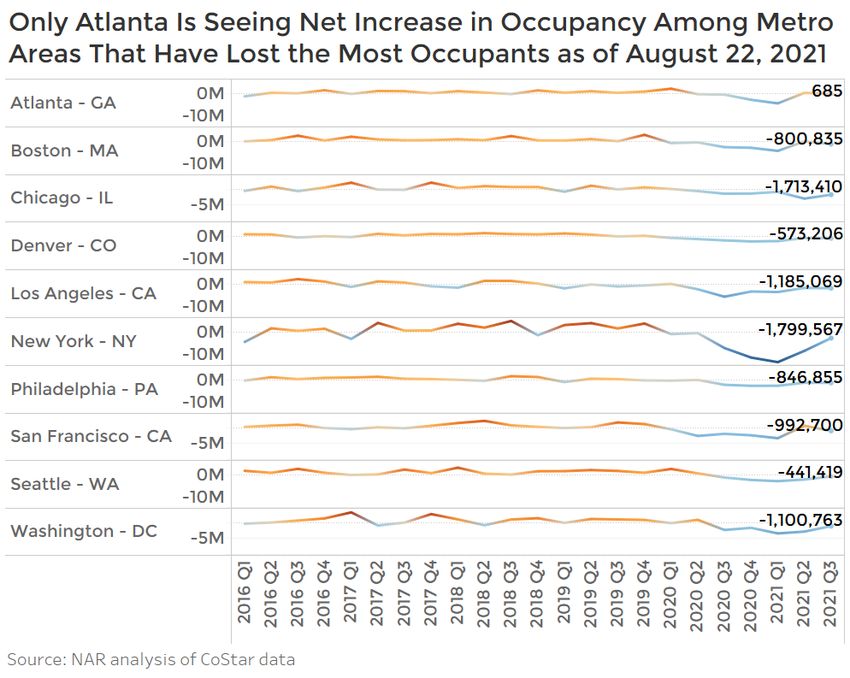
Multifamily
Absorption and rents rise to highest levels in a decade

 The apartment CRE market is
 experiencing a boom. Net absorption of
 apartment units reached its strongest
 level in a decade, with a net absorption of
 630,300 units in the past 12 months as of
 August 22, 2021. Prior to the pandemic,
 the 12-month net absorption was just shy
 of 300,000 units.

 In 2021 Q3, the top rental markets by net
 absorption were Dallas, New York,
 Washington DC, Houston, and Los
 Angeles. It is interesting to note that
 renters are coming back to major cities
 that lost tenants during the pandemic,
 namely New York, Chicago, Boston,
 District of Columbia, San Francisco, Los
 Angeles, Seattle, and San Jose.

 On average, asking rents were up 10.6%
 year-over-year. Of these, about a third or
 137 metros had at least 10% year-over-year
 rent growth.

 Of the top 10 metro areas with the highest
 rent growth, eight were in Florida. Most
 of the metro areas with the highest rent
 growth are in the South and West states.

                                               5
Multifamily
NY, DC, and LA are top areas attracting multifamily
developers
Rents have soared because of waning
construction activity. As of the 2021 Q2,
there were 592,846 multifamily units
under construction, according to CoStar®
data. Prior to the pandemic, there were
710,000 units under construction.
Developers appear to remain bullish on
the long-term prospects of the gateway
cities, with the most construction activity
in the metro areas of New York, the
District of Columbia, Los Angeles, Boston,
Chicago, and San Francisco. Most
construction activity is happening in the
South states (Texas, Florida, Georgia,
Virginia, Tennessee, North Carolina) and
in the West states (Washington,
California, Arizona, Colorado, Utah) as well
as in the Midwest states (Illinois, Missouri,
Ohio, and Michigan).
5Office
Office real estate still suffering from declining occupancy
In the office market, 150 million square feet
of office space has lost occupants since
2020 Q2. The office vacancy rate has
increased from 9.8% in 2020 Q1 to 12.5% as
of August 22.
In the past 12 months, the largest losses in
office occupancy have occurred in New
York, Washington DC, Chicago, Los
Angeles, San Francisco, Boston,
Philadelphia, Seattle, Atlanta, and Denver.
Only Atlanta had positive net absorption in
the second and third quarter (as of August
22).
On the other hand, office occupancy
increased in secondary/tertiary metro
areas. Of the 12 metro areas with an
increase of over 500,000 square feet of
office space, three were in Florida (Palm
Beach, Pensacola, and Miami).
Rochester, Durham, Salt Lake City, Boise,
Provo, Austin, New Haven, San Antonio,
Austin, and Fargo are the other metro
areas that are attracting office-using
businesses. These areas are closer to key
metro areas but offer lower office and
apartment rents, less expensive homes,
and a pool of talent and research facilities
provided by the universities in these areas.
5Office
Office rents are still declining with rising rent in
secondary/tertiary metros
With falling occupancy and rising office
vacancy rates, asking rents remained below
the level one year ago, down by 0.7% as of
August 22, 2021. The average rent is being
pulled down by the large metro areas,
However, only 27 out of 390 metro areas
tracked by CoStar® had lower asking rent as
of August 22, 2021 compared to one year ago.
Office asking rents are on average still below
year-ago levels in the metro areas of San
Francisco, New York, Washington DC, Los
Angeles, Chicago, Seattle, Los Angeles.
However, office asking rents are up in many
secondary/tertiary metro areas. Tucson
posted the highest year-over-year increase in
office asking rent, while Phoenix saw a
modest decrease in asking rent. Several
metro areas with the highest rent growth are
in Florida (Fort Myers, Sarasota, Naples,
Melbourne, Palm Beach).
5Office
Office space under construction to keep office rents low
As of August 22, 2021, 143.4 million of office
space is under constructing, equivalent to
about 2% of the existing office space. This
space under completion add to the current
vacant space and will tend to keep office
rents low until the office space is absorbed.
The largest construction projects are still
happening in the metro areas that are
currently still suffering from declining
occupancy: New York, Boston, Seattle,
Washington DC, San Jose, Los Angeles,
Austin. In San Jose and Austin, the
incoming supply amounts to about 6% of
office space. The development in Austin
includes the ongoing construction for
Google’s office, following the entry of
Facebook in Austin in 2019.
5Industrial
Investors remain excited about industrial space
Acquisitions of industrial properties of $2.5 million Industrial Sales Transactions of $2.5M
or over rose 40% in June 2021 and totaled $7.5 or Over as of July 2021 (in Billions $)
billion, as acquisitions increased for both flex (38%) $30
and warehouse (40%).
$25
Industrial property sales continue to increase as $20
these properties remain attractive amongst
$15
investors. Warehouse acquisition growth continues
as 80% of all industrial deal volume in July was $10
comprised of this asset. July’s figures for
$5
warehouse property acquisitions hold true on a
year-to-date basis as well. YTD through July 2021, of $-
the $61.9 billion all industrial volume, warehouse
May-12
Oct-13
Jan-18
Jan-01
Nov-03
Feb-08
Jul-09
Aug-16
Nov-20
Jun-02
Apr-05
Sep-06
Jun-19
Dec-10
Mar-15
acquisitions totaled S49.4 billion or 80%, as it
remains the preferred asset type among investors
Flex Volume Warehouse Volume
given the current state of e-commerce.
Cap rates trended downward throughout last year,
but has been marginally creeping up over the past Industrial Property Cap Rates
couple of months, with flex nominally increasing 0.12
from the beginning of the year. The average cap
0.1
rate among flex has increased to 6.1% as of July
2021, while the average cap rate among warehouse 0.08
acquisitions remain unchanged at 5.8% 6.1%
0.06
5.8%
0.04
YTD through July 2021, the most active markets
with respect to industrial property acquisitions 0.02
were Los Angeles (351), Chicago (221), Atlanta (201), 0
Dallas (163) and Inland Empire (161). May-12
Oct-13
Feb-08
Jan-18
Nov-20
Jan-01
Nov-03
Jul-09
Aug-16
Apr-05
Sep-06
Jun-02
Dec-10
Jun-19
Mar-15
Most Active Industrial Markets by Flex Cap Rate Warehouse
Number of Property Acquisitions YTD Cap Rate
Through July 2021
351 Share of Industrial Warehouse
Chicago 221
Acquisitions to Total Acquisitions
201
Dallas 163 100.0%
161 90.0% 80.0%
Houston 145 80.0%
126
70.0%
No NJ 123
121 60.0%
Philadelphia 120 50.0%
119 40.0%
Seattle 100 30.0%
95 20.0%
NYC Boroughs 85 10.0%
84 0.0%
Minneapolis 80
Jan-10
Jan-13
Jan-16
Jan-19
Jan-01
Jul-02
Jan-04
Jul-05
Jan-07
Jul-08
Jul-11
Jul-14
Jul-17
Jul-20
75
Charlotte 75
70
Sacramento 66
12
Source of data: Real Capital AnalyticsRetail
Retail acquisitions of centers outpace shops
Acquisitions of retail properties of $2.5 million or Retail Sales Transactions of $2.5M or
over rose 34% in July 2021, as acquisitions increased Over as of July 2021 (in Billions $)
for centers, 98%, while shops, -19%, declined.
$25
Although centers in July record a 98% y/y volume $20
increase, it is down from the prior months where $15
volume exceeded 200%. Shops declined -19% y/y
$10
and experienced a similar decline in volume with
respect to the prior three months. The drop in the $5
sale of all retail properties for July is just the result $-
of differing economies. The results of the past few
May-12
Oct-13
Feb-08
Jan-18
Jan-01
Nov-03
Jul-09
Aug-16
Nov-20
Apr-05
Sep-06
Jun-02
Dec-10
Jun-19
Mar-15
months, given the current economic environment
is substantially different from those months last
year where there was much uncertainty in regards Shops Volume Centers Volume
to COVID.
The majority of retail acquisitions in July, 66.9%,
was for center space. On-the-whole, the share of
centers has been rising since its low-point of 2020 Retail Property Cap Rates
(April).
0.1
Overall retail cap rates were unchanged 0.08 7.2%
throughout last year and haven’t deviated much.
6.1%
Cap rates averaged 6.5% for all of retail where 0.06
center cap rates were 7.2% and 6.1% for shop
0.04
acquisitions.
0.02
YTD through July 2021, the most active markets
with respect to retail property acquisitions were 0
Los Angeles (176), Dallas (127), Atlanta (123), Chicago
May-12
Oct-13
Jan-01
Nov-03
Feb-08
Jan-18
Jul-09
Aug-16
Nov-20
Jun-02
Apr-05
Sep-06
Dec-10
Jun-19
(123) and Phoenix (116). Mar-15
Shops Cap Rate Centers Cap Rate
Most Active Retail Markets by Number of
Property Acquisitions YTD Through July
Share of Retail Center Acquisitions to
2021
Total Acquisitions
176
Dallas 127 120.0%
123
Chicago 123 100.0%
116
80.0% 66.9%
Houston 97
92 60.0%
No NJ 66
63 40.0%
Tampa 61
56 20.0%
Boston 54 0.0%
52
Jan-10
Jan-13
Jan-16
Jan-19
Jan-01
Jul-02
Jan-04
Jul-05
Jan-07
Jul-08
Jul-11
Jul-14
Jul-17
Jul-20
Charlotte 51
49
Seattle 47
46
San Diego 45
45 13
Denver 45
Source of data: Real Capital AnalyticsHotel
Occupancy rising but still below pre-pandemic rate
With more people vaccinated and personal and
business travel picking up, the hotel occupancy
rate rose to 60.5% as of August 2021 after hitting
70% in July, according to CoStar/STR data.
Conditions have vastly improved from one year
ago when occupancy fell to just 24%. Occupancy is
just running at 5% below the peak occupancy rate
of 75% prior to the pandemic.
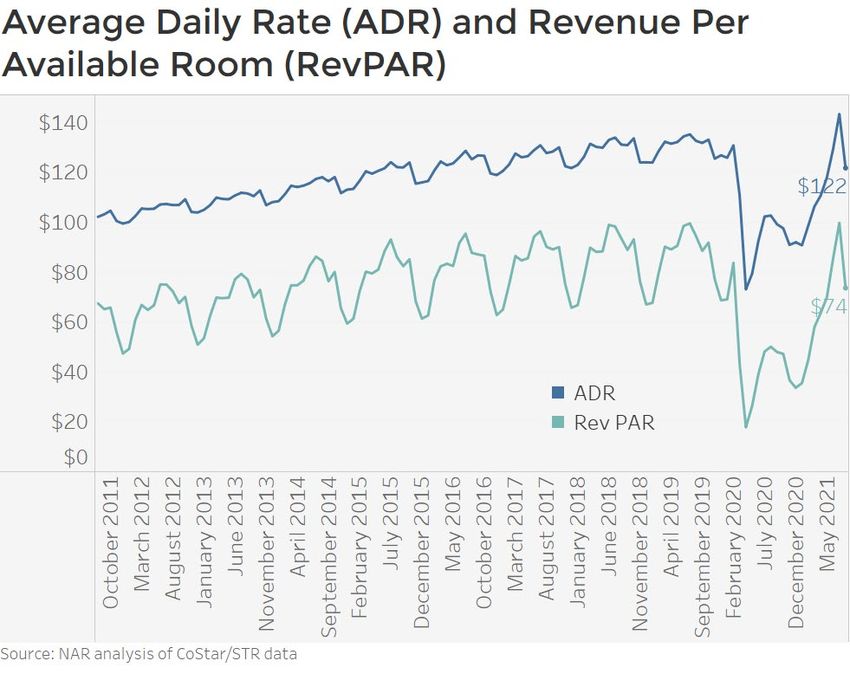
The hotel industry’s revenue metrics― average
daily rate (ADR) and revenue per available room
(RevPAR) ― have also improved significantly. As of
August, ADR was at $122/room, up 19% from one
year ago, while RevPAR was at $74/room, up 47%
from one year ago. RevPAR is rising at a faster pace
then ADR because of the pickup in occupancy rate.
Hotel construction was slowed, with 186,892 rooms
under construction nationally, which is equivalent
to 3.4% of the total inventory of hotel rooms. In
April one year ago, construction was running at
around 220,000 rooms, or nearly 5% of total
inventory of rooms. In New York, the ongoing
construction accounts for nearly 20% of room
inventory so hotel rates are likely to rise at a
tempered pace in New York.
13
ADR is the total revenue/number of rooms.
RevPAR is ADR x occupancy rate.COMMERCIAL MONTHLY INSIGHTS REPORT August 2021 LAWRENCE YUN, PhD Chief Economist & Senior Vice President for Research GAY CORORATON Senior Economist & Director of Housing and Commercial Research BRANDON HARDIN Research Economist MEREDITH DUNN Research Manager Download report at https://www.nar.realtor/commercial-market-insights Download other NAR Commercial reports at Commercial Research ©2021 National Association of REALTORS® All Rights Reserved. May not be reprinted in whole or in part without permission of the National Association of REALTORS®. For question about this report or reprint information, contact data@realtors.org.
The National Association of REALTORS® is America’s largest trade association,
representing more than 1.4 million members, including NAR’s institutes, societies
and councils, involved in all aspects of the real estate industry. NAR membership
includes brokers, salespeople, property managers, appraisers, counselors and
others engaged in both residential and commercial real estate. The term
REALTOR® is a registered collective membership mark that identifies a real estate
professional who is a member of the National Association of REALTORS® and
subscribes to its strict Code of Ethics. Working for America's property owners, the
National Association provides a facility for professional development, research and
exchange of information among its members and to the public and government
for the purpose of preserving the free enterprise system and the right to own real
property.

NATIONAL ASSOCIATION OF REALTORS®
RESEARCH GROUP

The Mission of the NATIONAL ASSOCIATION OF REALTORS® Research Group is to
produce timely, data-driven market analysis and authoritative business intelligence
to serve members, and inform consumers, policymakers and the media in a
professional and accessible manner.

To find out about other products from NAR’s Research Group, visit
www.nar.realtor/research-and-statistics

500 New Jersey Avenue, NW
Washington, DC 20001
202.383.1000
You can also read