Commercial Pressure Retarded Osmosis Systems for Seawater Desalination Plants
←
→
Page content transcription
If your browser does not render page correctly, please read the page content below
membranes

Article
Commercial Pressure Retarded Osmosis Systems for Seawater
Desalination Plants
Ryo Makabe 1, * , Tetsuro Ueyama 1 , Hideyuki Sakai 1 and Akihiko Tanioka 2

                                          1   Kyowakiden Industry Co., Ltd., 10-2 Kawaguchi-Machi, Nagasaki-shi, Nagasaki 852-8108, Japan;
                                              ueyama@kyowa-kk.co.jp (T.U.); hidesakai@kyowa-kk.co.jp (H.S.)
                                          2   Department of Organic and Polymeric Materials, Tokyo Institute of Technology, 2-12-1 Ookayama,
                                              Meguro-ku, Tokyo 152-8552, Japan; atani417@j03.itscom.net
                                          *   Correspondence: r-makabe@kyowa-kk.co.jp; Tel.: +81-95-848-7788; Fax: +81-95-848-5305

                                          Abstract: The development of renewable energy technologies is of global importance. To realize
                                          a sustainable society, fossil-resource-independent technologies, such as solar- and wind-power
                                          generation, should be widely adopted. Pressure retarded osmosis (PRO) is one such potential
                                          renewable energy technology. PRO requires salt water and fresh water, both of which can be found
                                          at seawater desalination plants. The total power generation capacity of PRO, using concentrated
                                          seawater and fresh water, is 3 GW. A large amount of energy is required for seawater desalination;
                                          therefore, the introduction of renewable energy should be prioritized. Kyowakiden Industry Co., Ltd.,
                                          has been working on introducing PRO to seawater desalination plants since 2001 and is attracting
                                          attention for its ongoing PRO pilot plant with a scale of 460 m3 /d, using concentrated seawater
                                          and treated sewage water. In this study, we evaluated the feasibility of introducing PRO in existing
                                          desalination plants. The feasibility was examined based on technology, operation, and economy.
                                          Based on the number of seawater desalination plants in each country and the electricity charges, it
                                          was determined whether the introduction of PRO would be viable.


                                          Keywords: commercial plant; pressure retarded osmosis; hybrid process; Mega-Ton Water System;
Citation: Makabe, R.; Ueyama, T.;         seawater contamination
Sakai, H.; Tanioka, A. Commercial
Pressure Retarded Osmosis Systems
for Seawater Desalination Plants.
Membranes 2021, 11, 69. https://doi.      1. Introduction
org/10.3390/membranes11010069                   Over the last few decades, petroleum resources have depleted and global warming has
                                          increased at alarming rates. To remedy this, energy sources that can facilitate the realization
Received: 26 December 2020
                                          of a sustainable society should be considered [1,2]. Wind, solar, hydroelectric, geothermal,
Accepted: 15 January 2021
                                          and biomass power generation are gradually becoming widespread [3,4]. Wind power is
Published: 19 January 2021
                                          widely used in deserts, coasts, and offshore. In recent years, photovoltaic power generation
                                          has been used by local governments and households, owing to the progressive price reduc-
Publisher’s Note: MDPI stays neutral
                                          tion. Pressure retarded osmosis (PRO), another useful renewable energy technology, should
with regard to jurisdictional claims in
                                          attract considerable attention in the future [5]. The development and dissemination of
published maps and institutional affil-
                                          useful novel renewable energy sources contribute to the realization of a sustainable society.
iations.
                                          Kyowakiden Industry Co., Ltd., et al. contributed to the popularization of PRO, which was
                                          first proposed by Professor Sidney Loeb in 1976 [5]. PRO is a form of hydroelectric power
                                          generation technology; by utilizing the concentration difference, it converts the entropy
                                          change into electricity when high- and low-salinity water are mixed [6]. Water with high
Copyright: © 2021 by the authors.
                                          osmotic pressure includes some factory effluents, salt-lake water, seawater, and concen-
Licensee MDPI, Basel, Switzerland.
                                          trated seawater discharged from seawater desalination plants. Most of the concentrated
This article is an open access article
                                          seawater generated from seawater desalination plants is directly discharged into the sea.
distributed under the terms and
                                          This concentrated seawater contains high energy potential due to the high entropy but is
conditions of the Creative Commons
Attribution (CC BY) license (https://
                                          currently an unused resource.
creativecommons.org/licenses/by/
                                                Similarly, natural seawater has high potential for PRO. However, the performance
4.0/).                                    of commercially available membranes is insufficient to obtain useful energy by PRO with

Membranes 2021, 11, 69. https://doi.org/10.3390/membranes11010069                                       https://www.mdpi.com/journal/membranes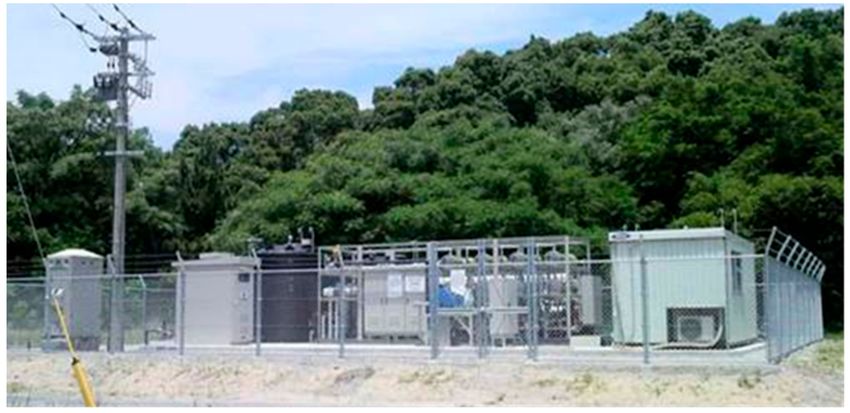
Membranes 2021, 11, 69                                                                                          2 of 14

                         natural seawater and fresh water [7–9]. Many researchers have studied PRO with natural
                         seawater and fresh water, to obtain the energy of this unused resource. Membrane manu-
                         facturers should develop PRO membranes to realize PRO, using natural seawater and fresh
                         water. In many countries, energy and water shortages are a serious challenge, with 30% of
                         the world’s population living in countries or regions which experience water shortages.
                         These areas often acquire drinking water by using seawater desalination. Seawater desali-
                         nation has a long history, and there are various technologies [10,11], such as multi-stage
                         flash (MSF), multi-effect desalination (MED), vapor compression, reverse osmosis (RO),
                         and membrane distillation (MD), used to achieve desalination. The energy consumption
                         of seawater desalination depends on seawater desalination technology [12–16]. The RO
                         method, which is used in 69% of seawater desalination plants, consumes 3–4 kWh of energy
                         to for every m3 of fresh water produced. The RO method is considered to consume less
                         energy for water production because it does not involve phase changes, as compared to
                         other technologies.
                               Elimelech et al. evaluated the theoretical minimum energy consumption required
                         for water production as 1.06 kWh/m3 [17]. The energy consumption when using a good-
                         quality permeable RO membrane element can be estimated to be 1.8 kWh/m3 on a pilot
                         scale. In addition, the energy consumption of current large-scale seawater desalination
                         plants is said to be 3–4 kWh/m3 on average [18]. High-performance RO membrane
                         elements are not the only contributors to reducing energy consumption in RO plants.
                         Currently, most commercial RO plants use power-recovery devices to reduce energy
                         consumption, notably, the PX® Pressure Exchanger® by Energy Recovery, Inc. [19]. In
                         addition, Flowserver’s Calder DWEER and Fluid Equipment Development Company’s
                         (FEDCO) Hydraulic pressure boosters (HPB) Turbocharger are used [20]. These are devices
                         for transmitting the pressure of the brine to the feed. In addition, a complex seawater
                         desalination technology called hybrid desalination is being developed as a novel process
                         to reduce the energy consumption of seawater desalination. The development of seawater
                         desalination systems that reduce energy consumption by using multiple processes such
                         as MD–RO, forward osmosis (FO)–RO, and electrodialysis (ED)–RO will continue to be
                         implemented [10,21,22].
                               Kyowakiden Industry Co., Ltd., et al. proposed PRO for reducing energy consumption
                         in seawater desalination plants [23–27]. The benefits of introducing PRO in seawater desali-
                         nation plants are not limited to reducing energy consumption. Many seawater desalination
                         plants which are primarily situated in Arab Gulf regions use large amounts of chemi-
                         cals [28], resulting in marine pollution problems in those regions. To realize a sustainable
                         seawater desalination plant, problems in long-term operation (control of chemical use and
                         solution of marine pollution), solving such problems should be of key importance.
                               Kyowakiden Industry Co., Ltd., strongly recommends that energy consumption
                         in seawater desalination plants be reduced and measures against marine pollution be
                         implemented by using concentrated seawater, which is an unused resource. In this study,
                         the feasibility of PRO was evaluated from state-of-the-art technological trends (technology),
                         to determine whether PRO can be introduced into existing seawater desalination plants
                         (operation), and the current cost estimation (economic).

                         2. Results and Discussion
                         2.1. State-of-the-Art Technological Trends
                         2.1.1. PRO Systems
                               PRO system development is led by Kyowakiden Industry Co., Ltd., in Japan, and
                         Statkraft, in Norway [9,23,24,29]. Kyowakiden Industry Co., Ltd., also conducted the
                         world’s first demonstration test of PRO in seawater desalination plants. In this demon-
                         stration test, PRO performance evaluation was conducted by using treated sewage water
                         and concentrated seawater that is discharged into the sea from the sewage-treatment plant
                         and Fukuoka Seawater Desalination Center in Japan, respectively, for over a year. This
                         seawater desalination plant uses a mixed discharge system. In this method, concentrated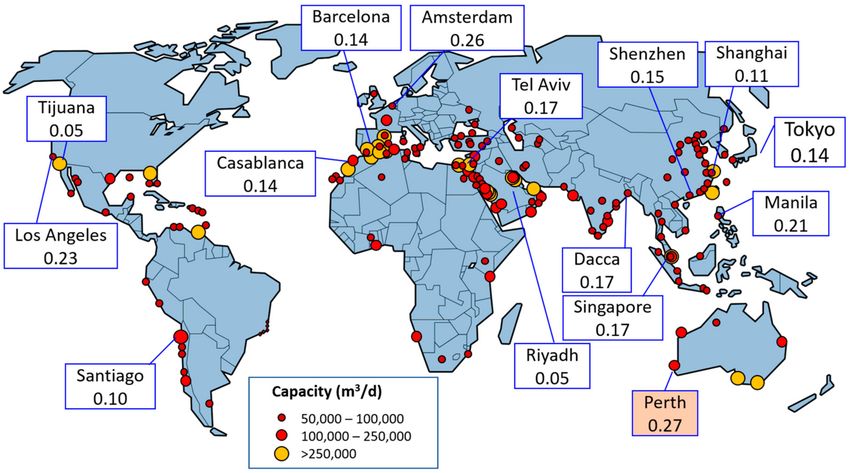
Membranes 2021, 11, 69                                                                                                             3 of 14

                                     seawater and treated sewage water are mixed in advance and then discharged into the sea.
                                     This discharge method has lower environmental stress on the ocean than other methods.
                                     In other words, concentrated seawater and treated sewage water are already mixed at a
                                     cost. In this case, energy can be recovered by introducing PRO. Demonstration tests were
                                     conducted between 2011 and 2012. Figure 1 shows an image of the demonstration test site.
                                     Figure 2 shows the overview of long-term demonstration test site. Table 1 shows materials
                                     used at long-term demonstration test site.

                                     Figure 1. Photograph of the demonstration test site.

                         Figure 2. Overview of a long-term demonstration test site. PRO, pressure retarded osmosis.

                                     Table 1. Materials used at a long-term demonstration test site.

                                                                           Item                Specification              Origin
                                                                                                                        Mamizu Pia
                                                                   Concentrated brine            460 m3 /d
                                              Raw water                                                             (Desalination Plant)
                                                                                                                     Wajiro Wastewater
                                                                   Treated wastewater            420 m3 /d
                                                                                                                     Treatment Center
                                                                                                                          NITTO
                                                                            UF               RS50-S8 (8 inches)
                                       Freshwater pretreatment                                                      (Reused membrane)
                                                                                                                          NITTO
                                                                    Low-pressure RO         ES20B-D8 (8 inches)
                                                                                                                    (Reused membrane)
                                          PRO membrane                 Hollow fiber         4 ports 10 inches × 8        TOYOBO
                                       Water-turbine generator           Pelton                Power 7.7 kW           Canada, Japan
                                     RO, reverse osmosis.

                                          The demonstration test site includes eight four-way 10-inch Toyobo cellulose triacetate
                                     (CTA) hollow fiber membrane modules, ultrafiltration (UF) membranes, low-pressure
                                     RO membranes for advanced treatment of sewage-treated water (pretreatment of feed
                                     solution), and a Pelton turbine generator. The hollow fiber membrane has an outer diameter
                                     of 0.2 mm, inner diameter of 0.1 mm, and length of 1.3 m. Operating status was acquired
                                     by using a 24-hour automatic control and monitoring system. The scale of water volume is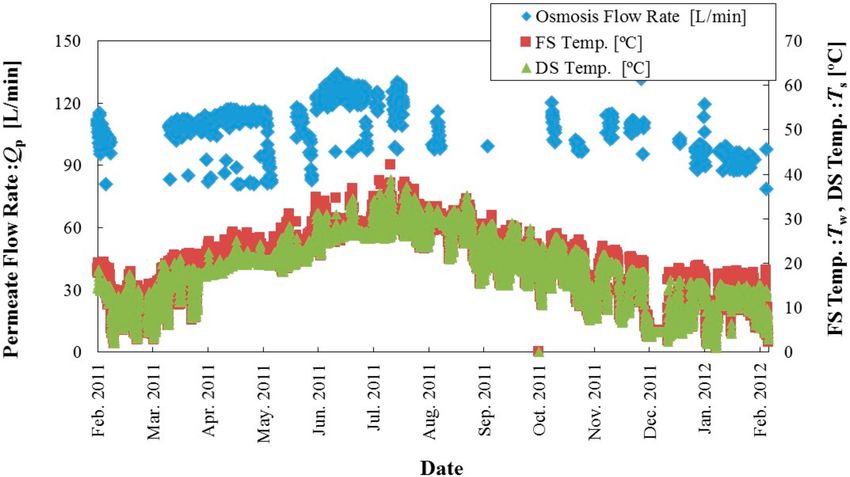
Membranes 2021, 11, 69                                                                                                   4 of 14

                                  460 and 420 m3 /d for concentrated seawater and treated sewage, respectively. Through this
                                  test, Kyowakiden Industry Co., Ltd., obtained a large amount of power generation (power
                                  density: 10 W/m2 ) and temperature changes due to seasonal variation (draw solution (DS),
                                  2–38 ◦ C; feed solution (FS), 1–40 ◦ C) in the performance over the year. Figure 3 shows
                                  the time course of permeate flow rate and temperatures at the PRO prototype plant [24].
                                  The permeate flow through the membrane is temperature-dependent, similar to the RO
                                  membrane method. The same membrane module was used consecutively in this test. The
                                  permeate flow rate did not decrease in the continuous one-year test. At the same time, it
                                  participated in the “Mega-ton Water System” organized by Toray Kurihara Fellow. In this
                                  project, a 10% energy saving was calculated for a mega-ton-class seawater desalination
                                  plant. After introducing PRO, there was an improvement in energy consumption reduction
                                  that was proportional to both the concentration of seawater and the amount of concentrated
                                  seawater. The PRO system provides excellent performance in large-scale, high-recovery
                                  seawater desalination plants.

                    Figure 3. Time course of permeate flow rate and temperatures at our PRO prototype plant [24].

                                        Statkraft, one of the leading producers of green energy worldwide, has conducted
                                  demonstration tests of seawater and river water, and led the development of PRO technol-
                                  ogy. In long-term demonstration tests, membrane performance monitoring, membrane
                                  cleaning and maintenance, PRO PX® operation and pressure control, and freshwater
                                  pretreatment optimization were performed. Statkraft estimated the levelized cost of elec-
                                  tricity (LCOE) of PRO to be 120 EUR/MWh, which roughly equals to 0.144 USD/kWh
                                  (1 EUR = 1.2 USD) at a 25 MW power plant [30]. Kyowakiden Industry Co., Ltd., also an-
                                  nounced similar results. However, Statkraft discontinued investment in PRO development,
                                  in 2013, due to lack of improvement in membrane performance. The social significance of
                                  LCOE published by Statkraft (compared to the electricity bill in the market) is discussed in
                                  Section 2.3.
                                        The PRO system has been proposed for various flows. Kyowakiden Industry Co.,
                                  Ltd., has obtained a patent for the PRO system (PCT/JP2014/051873) [26] that has been
                                  registered in Japan, the USA, Australia, Saudi Arabia, and Israel. One of these PRO systems
                                  is a method of recovering energy from a turbine. The patent for the PRO system using
                                  concentrated seawater and treated sewage water, acquired by Kyowakiden Industry Co.,
                                  Ltd., can also use river water instead of treated sewage. Figure 4 shows the configuration of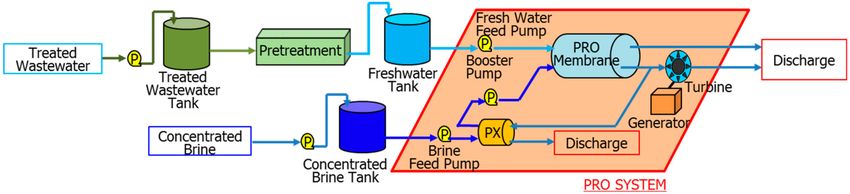
Membranes 2021, 11, 69                                                                                                         5 of 14

                                 a PRO system that recovers energy by using turbines. This system has excellent advantages
                                 for installation in existing plants. This is because the seawater desalination plant and
                                 the PRO system can be operated independently. Highly efficient energy recovery can
                                 be achieved with a recovery rate of 92% by coaxially connecting a water-turbine and a
                                 high-pressure pump for desalination of seawater instead of a turbine for power generation.

          Figure 4. Configuration of the PRO system, in case of turbine use for energy recovery. PX® , Pressure Exchanger® .

                                      Figure 5 shows the configuration of a PRO recovering energy system that uses PX® .
                                 In this system, the seawater desalination plant uses a two-stage PX® . However, when
                                 treated sewage water is used as the freshwater source for PRO, the treated sewage water is
                                 mixed with the seawater supplied by the seawater desalination plant. In some countries,
                                 including Japan, such a system cannot be used because sewage water should not be mixed
                                 with drinking water. However, other countries, like the USA and Australia, reuse treated
                                 wastewater and can be expected to take advantage of this system. In areas that do not reuse
                                 treated sewage water for drinking water, RO-treated water using this system may not be
                                 used as drinking water but could still be used as water for sprinkling. When introducing
                                 PRO to an existing seawater desalination plant, the system shown in Figure 4 can be widely
                                 used from the perspective of mixing RO-treated water with treated sewage water.

                                 2.1.2. PRO Membranes
                                       PRO membranes require high permeability, pressure tightness, and anti-fouling poten-
                                 tial [31]. In the early development of PRO membranes, conventional RO membranes were
                                 considered. However, the water permeability of conventional RO membranes was too low.
                                 Therefore, membranes specifically for PRO systems have been developed. Hollow fiber
                                 membranes with high water permeability are currently available in the market [6]. The de-
                                 velopment of flat sheet membranes for PRO systems has been slow at the commercial level.
                                 However, as the development of hollow fiber membranes for PRO systems progressed,
                                 better water permeability was obtained. However, film surface and internal membrane
                                 fouling remains a problem.
Membranes 2021, 11, 69 6 of 14
Figure 5. Schematic demonstrating the configuration of recovering energy by PX® of the PRO system.
Many pretreatment approaches for fouling suppression have been studied [32,33]. In
addition, researchers are trying to make breakthroughs in membrane development. The
authors greatly look forward to membrane development leading to inexpensive membranes.
Many researchers are working on lab-scale PRO membranes. Liu et al. used one-step
phase inversion technology to study the improvement of fouling resistance by introducing
silver nanoparticles (AgNPs) into the membrane substrate [34]. The AgNP is an effective
biocide against various aquatic microorganisms, and nanocomposite membranes with
AgNP exhibit better permeability and separation performance, in addition to the anti-
fouling effect, and improvements in mechanical strength and thermal stability have been
also been reported. In addition, new materials for PRO membranes are being actively
developed. Zhang et al. developed a thin Polyethersulfone (PES) composite hollow fiber
membrane [35]. The power density of this membrane was 24.3 W/m2 when 1 M NaCl and
DI water were evaluated at 0.2 MPa for FO operation. Li et al. developed a hyperbranched
polyglycerol-grafted polyether sulfone hollow fiber membrane [36]. The membrane was
evaluated for its anti-fouling effect from the adsorption test with Escherichia coli of bovine
serum albumin. This membrane was washed to obtain a high wash recovery of up to 94%.
The development of membranes using carbon nanotubes (CNTs) is also in progress.
Fan et al. reported the construction of reduced graphene oxide on CNT hollow fiber
substrates via electrophoretic deposition coupled with a chemical-reduction process for
membranes on nanocarbon substrates [37]. This membrane has improved the permeability
and ion selectivity by constructing a graphene active layer. In the FO test with 0.5 M NaCl
and DI water, a water flux of 22.6 LMH was obtained, which is equivalent to 3.3 times
the permeability of commercially available membranes. Tang et al. developed a thin film
composite (TFC) membrane with a single-walled carbon nanotube (SWCNT) intermediate
layer [38]. A membrane in which an intermediate layer is formed through a strong π-π
interaction was prepared with SWCNTs with no functional group. The TFC membrane
with the optimum SWCNT intermediate layer had a permeability of 3.3 L m−2 h−1 bar−1 in
the RO test using 0.5 M NaCl. The TFC membrane with the optimum SWCNT intermediate
layer had a high permeability of 62.8 L m−2 h−1 in the FO test with 1 M NaCl and DI water.Membranes 2021, 11, 69 7 of 14
This is because the TFC membrane with the SWCNT intermediate layer achieved higher
permeability due to the significant reduction in structural parameters and the significant
suppression of internal concentration polarization in the support layer.
Bench-scale PRO membrane manufacturers include Toray, AQUAPORIN, and Polyfera.
Toray manufactures 8-inch spiral PRO membrane modules at Toray Chemical Korea, a
group company [39]. The A, B, and S values of this film are 1.97 L h m2 -h-bar, 0.619 L/m2 -h,
and 0.713 mm, respectively. However, this 8-inch spiral PRO membrane had a low power
density, as compared to the performance of Toyobo’s hollow fiber PRO membrane mod-
ule. AQUAPORIN manufactures composite polyamide hollow fiber membranes with
aquaporins (proteins) in three types of modules with membrane areas of 0.6, 2.3, and
13.8 m2 . AQUAPORIN’s membrane is recommended for use in the FO process used in
semiconductor wastewater treatment. Porifera manufactures a novel flat membrane FO
membrane module with a membrane area of 63 m2 . FO membranes that can be used
for concentration and wastewater treatment are manufactured by many manufacturers.
Osmotic Engineering (UK), Forward Water Technologies (Canada), EDERNA, and Trevi
Systems have reported their own FO systems [40].
Trends in commercial PRO membranes and manufacturers are of great interest to
users and researchers. Currently, the only commercial-use PRO membrane is manufactured
by Toyobo. Toyobo announced that their membrane was used in the demonstration test of
PRO (FO), which was started by the Danish venture company Salt Power Aps in 2018 [41].
At the demonstration site, warm underground salt water was used as a local heating
system. The PRO demonstration test used this salt water and fresh water to generate 20 kW
of power.
The development of commercially available PRO membranes is gradually expanding
to other manufacturers. The membranes that some manufacturers term as FO membranes
have low-pressure resistance and are therefore not applicable for the PRO process. However,
FO and PRO membranes are manufactured by a similar method. The authors expect that
the expansion of the PRO membrane market will increase upon using the FO membrane.
2.2. Current Status of Existing Seawater Desalination Plants
As of 2019, there were 15,906 seawater desalination plants in operation [42]. The total
water production of all seawater desalination plants was 95.37 million m3 /d. In the 1980s,
84% of the world’s desalinated water was produced by the MSF and MED methods. The use
of the RO method has increased since the 1980s, and, in the 2000s, the amount of desalinated
water produced by thermal technology and RO was approximately 11.6 million m3 /d and
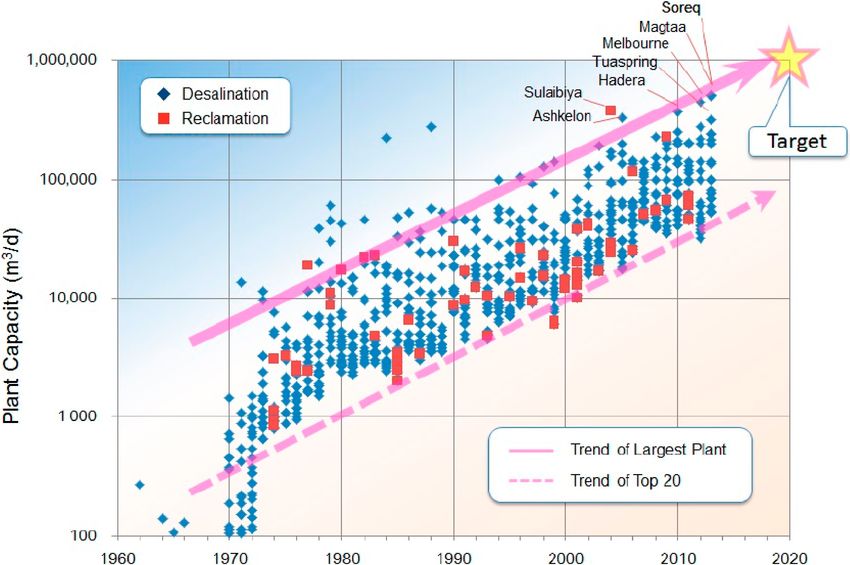
11.4 million m3 /d, respectively. Figure 6 shows the change in the size of RO plants for
desalination and reclamation [43,44]. Since 2010, the amount of seawater desalinated in
plants using RO has reached 100,000 m3 /d. The size of plants using Seawater RO in 2020 has
reached the mega-ton scale, and it is believed that the number of plants is further increasing.
However, issues stemming from the discharge of chemicals and high-concentration salt
water on marine organisms from seawater desalination plants should also be considered.
Although there are a few studies that deny the effects on marine pollution, these are not
long-term studies. The discharge of concentrated seawater from seawater desalination
plants into the sea is of concern due to the environmental stress of high temperature, high
salinity, and chemicals, which are known to affect marine organisms. However, there
is no globally unified protocol for treating concentrated seawater, considering the five
established treatment methods currently in use:
1. Directly discharged into the sea or rivers;
2. Discharged into the existing sewage system;
3. Discharged into the evaporation area (Evaporation Pond);
4. Discharged into deep wells;
5. Zero Liquid Discharge (ZLD).Membranes 2021, 11, 69 8 of 14
Figure 6. Change in the size of RO (reverse osmosis) plants for desalination and reclamation [43,44].
Many seawater desalination plants directly discharge concentrated seawater into
seas or rivers. In this case, it has been reported that the local increase in salt content and
the diffusion of concentrated seawater can reduce environmental stress; however, this
method is not completely appropriate. Some countries and regions have regulations for
concentrated seawater discharged from seawater desalination plants. These regulations
often include a compliance point and critical concentration for discharge. Table 2 shows
the critical concentration and compliance points for each region [45].
Table 2. Critical concentration and compliance points for each region [45].
Compliance Point
Region/Authority Salinity Limit
(Relative to Discharge)
US EPA Increment ≤ 4 ppt
Carlsbad, CA Absolute ≤ 40 ppt 1000 ft.
Absolute ≤ 40 ppt salinity
Huntington Beach, CA (expressed as discharge 1000 ft.
dilution ratio of 7.5:1)
Western Australia guidelines Increment < 5%
Oakajee Port, Western
Increment ≤ 1 ppt
Australia
Perth, Australia/Western Increment ≤ 1.2 ppt at 50 m
50 and 1000 m
AustraliaEPA and ≤ 0.8 ppt at 1000 m
Sydney, Australia Increment ≤ 1 ppt 50–75 m
Gold Coast, Australia Increment ≤ 2 ppt 120 m
Okinawa, Japan Increment ≤ 1 ppt Mixing zone boundary
Abu Dhabi Increment ≤ 5% Mixing zone boundary
Oman Increment ≤ 2 ppt 300 m
Wang et al. reported on marine pollution from seawater desalination plants in
China [46]. The Qingdao Baifa and BEWG Aqualyng Seawater Desalination Projects
are located in the Bohai Economic Rim. Large amounts of concentrated salt water, corro-Membranes 2021, 11, 69 9 of 14
sion products, and chemical cleaning agents have caused marine pollution in this region,
owing to inadequate water circulation. The Water Law was established in the People’s
Republic of China, in 2016, for reducing marine pollution in China.
Marine pollution is a serious problem in the Middle East. Here, concentrated seawater
tends to accumulate because all seawater desalination plants are located on the coasts
of the Red Sea, the Gulf of Aqaba, and the Arabian Gulf. The amount of concentrated
seawater discharged in the Red Sea is reported to have increased from 6.4 Mm3 /d in 1996
to 142 Mm3 /d in 2018. Ozair et al. reported that the temperature, salt content, dissolved
oxygen, and phosphate contents in the Red Sea have also changed [47]. The development of
the seawater desalination industry is important in the Middle East; however, environmental
monitoring and stringent regulations are required.
Kelaher et al. reported the effects of discharging high-concentration salt water from the
Sydney seawater desalination plant in the sea, along with the results of a seven-year survey of
the habitat of living organisms in the region [48]. The outlet for concentrated seawater from
the Sydney Desalination Plant was located on a reef approximately 300 m offshore at a depth
of 25 m. The operating plant discharged an average amount of 342 ML/d of concentrated
seawater with an average temperature and conductivity of 20.1 ◦ C and 76,608 mS cm−1 ,
respectively. A high-pressure diffuser was installed at the drain to increase the mixing ratio
with seawater. Modeling and empirical data showed that the diffuser effectively mixed
seawater and concentrated seawater. At 100 m from the discharge port, the difference in
salinity from the surrounding seawater is less than 0.1 psµ (0.01 w/w %). The number
of fish around the discharge port increased by 279% after the diffuser was implemented
at the plant. This study also evaluated the changes that occurred when the discharge of
concentrated seawater was voluntarily stopped; through increasing salinity or other changes,
the concentrated seawater was observed to have certain environmental impacts.
Catastrophic marine pollution has not been reported since the introduction of the
seawater desalination plant. However, local changes in salinity and temperature have
been reported. The author proposes that this solution should be strengthened here before
serious marine pollution is caused by seawater desalination plants. Upon introducing the
PRO system, the concentration of brine discharged from the plant will be lowered. The
PRO system can dilute the brine salinity of 7.0 w/w % from the seawater desalination plant
to 3.9 w/w %, thus decreasing the environmental stress.
2.3. Comparison of Current Power Generation Costs by PRO and Electricity Charges
Kyowakiden Industry Co., Ltd., reported the power generation costs when PRO was
installed in a mega-ton-scale seawater desalination plant [24]. The power generation costs
for PRO have not changed significantly in the past few years as PRO membrane costs have
remained steady. Table 3 shows the power generation costs by PRO. Freshwater volumes
at 0.1 and 1 million m3 /d of concentrated seawater are 0.079 and 0.79 million m3 /d, re-
spectively. The salinity of the discharged water in these cases is 3.9 w/w %. Thus, the
power generation costs for 0.1 and 1 million m3 /d of concentrated seawater are 0.28 and
0.19 USD/kWh, respectively. Subsequently, the running costs for 0.1 and 1 million m3 /d
of concentrated seawater are 0.11 and 0.08 USD/kWh, respectively. The estimated mega-
ton-scale equipment costs are divided into membrane, equipment, civil engineering, and
labor costs, which amount to 49%, 31%, 12%, and 8% of the total cost, respectively. The
membrane cost in this case is currently 3200 USD/kWh. If this decreased to 550 USD/kWh,
the membrane cost would be reduced to 18%.Membranes 2021, 11, 69 10 of 14
Table 3. Power-generation costs for PRO.
Mega-Ton Water
PRO Mega-Ton Water PRO PRO System Size
System Size System Size (Future Price of the
PRO Membrane)
Draw side Brine (Concentration 7%)
Concentrated brine (CMD) 100,000 1,000,000 1,000,000
PRO membrane cost
4100 3200 550 *
(USD/module)
Pump efficiency (%) 85
Turbine efficiency (%) 88 92 ** 92 **
Power density (W/m2 ) 12
Net output power (kW) 1100 12,000 12,000
Facility redemption
0.17 0.11 0.06
(USD/kWh)
Running cost (USD/kWh) 0.11 0.08 0.03
Generation cost
0.28 0.19 0.09
(USD/kWh)
* Price similar to RO membrane module. ** Power recovery directly connected to the shaft. Conversion:
1 USD = 110 JPY.
Statkraft estimated the cost of osmotic power generation from seawater and fresh
water to be 0.144 USD/kWh, which has been described in Section 2.1. Figure 7 shows the
relationship between the seawater desalination plants using the RO method and industrial
electricity charges (USD/kWh) [42]. Industrial electricity charges in each country are
determined based on the values of each electric power company. Australia is the most
promising market in terms of these costs as compared to industrial electricity charges. If
the Statkraft estimation of 0.144 USD/kWh can be realized, PRO could be expected to be
introduced in many countries including Malaysia, Singapore, the USA, the Netherlands,
and Israel. In other words, PRO-based power plants using seawater and fresh water are
promising sustainable energy sources.
Figure 7. Relationship between seawater desalination plants using the RO method and industrial electricity charges
(USD/kWh) worldwide.Membranes 2021, 11, 69 11 of 14
The total amount of concentrated seawater produced globally by seawater desalina-
tion plants was estimated to be 182 Mm3 /d. The total amount of concentrated seawater was
calculated from the amount of drinking water produced by seawater desalination plants
around the world and the recovery rate for the technology used in each plant. The amount
of drinking water produced by seawater desalination plants worldwide is 95.4 Mm3 /d [42].
The total power generation when PRO is introduced for each seawater desalination technol-
ogy is 1.03. TWh/year. Table 4 shows the amount of power generated using PRO for each
seawater desalination technology. In addition, the total power generation from seawater
and freshwater PRO, using river water, is 650 TWh/year. Table 5 shows the total power
generation by PRO from natural seawater and fresh water calculated as per the flow rate
of rivers worldwide. The total sustainable water discharge was 124,600 Mm3 /d [49]. The
estimated pump efficiencies and turbine power generation efficiencies were 90% and 92%,
respectively. The permeation rate of fresh water with respect to salt water was set to 65%
and 70%, with saltwater concentrations of 7.0 w/w % and 3.5 w/w %, respectively. The
total amount of generated power calculated by PRO, using seawater and fresh water, based
on the total river water flow rate, was 877 GW. This energy source is an unused resource.
The power generation by PRO with seawater and fresh water is one solution to realize a
sustainable society.
Table 4. Amount of generated power using PRO for each seawater desalination technology.
RO MSF MED ED Other Total
Seawater desalination
64 18 8.5 2.5 2.37 95.4 million m3 /d
plant capacity [42]
Recovery [42] 42 22 25 86 4 %
Brine capacity 88 64 26 0.4 3.6 182 million m3 /d
Brine concentration 6.03 4.5 4.7 25 5.8 w/w %
Osmotic pressure 5.1 3.8 4.0 21 4.9 MPa
PRO DS pressure 2.5 1.8 1.9 6* 2.4 MPa
Permeation rate 65 %
0.57 0.32 0.14 0.007 0.03 1.03 TWh/year
Power generation
1.6 0.9 0.4 0.019 0.08 3 GW
0.35 0.16 0.07 0.006 0.02 0.57 TWh/year
Net Output Power
1.0 0.4 0.2 0.016 0.05 1.7 GW
* Considered as proof of the pressure of the membrane. MSF, multi-stage flash (MSF); MED, multi-effect
desalination (MED).
Table 5. Total power generation by PRO for natural seawater and fresh water, calculated by the flow
rate of rivers worldwide.
Total Sustainable Water Defined as Discharge 124,600 Million m3 /d
Seawater concentration 3.5 w/w %
Osmotic pressure 3.0 MPa
PRO DS pressure 1.5 MPa
Permeation rate 70 %
650 TWh/year
Power generation
1781 GW
320 TWh/year
Net output power
877 GW
International cooperation is vital for the popularization of PRO. In many countries,
renewable energy sources are often subsidized by the government. PRO has the potential
to be sufficiently competitive in many countries if subvention is introduced. This is because
running costs for PRO are cheaper than industrial electricity charges in many countries and
regions. One of the factors driving up power generation costs is the cost of the membranes.Membranes 2021, 11, 69 12 of 14
The membranes account for more than 40% of equipment costs. This is because PRO
membranes are not widely manufactured, considering their limited use. If PRO membrane
costs were approximately equal to those of the current RO membrane, the power generation
and running costs of 1 Mm3 /d would be 0.08 and 0.03 USD/kWh, respectively. Considering
the current global environment, there is an urgent need to solve environmental issues such
as the reduction of CO2 emissions. Therefore, the widespread use of PRO as a renewable
energy source will expand the market for PRO membranes, allowing for PRO membranes
to be provided at lower costs, similar to RO membranes.
3. Conclusions
To realize a sustainable society, it is necessary to increase the utilization of renewable
energy; availability of a variety of renewable energy sources is also vital. Kyowakiden
Industry Co., Ltd., recommended a PRO system that uses concentrated seawater and fresh
water to reduce the energy consumption of the seawater desalination process by 10%. In
addition, this PRO system, using natural seawater and fresh water, can be an energy source
that contributes to the realization of a sustainable society, providing a better membrane
module is developed. One of the better membrane module performances generates a
power density of 6.5 W/m2 or higher [7].
In this paper, the technical details of the PRO system, the current status of the existing
seawater desalination plants, and the power generation costs of the PRO system are sum-
marized. The PRO system can be operated continuously for more than one year following a
performance evaluation test. Furthermore, the scale of existing seawater desalination plants
is also increasing. The number of mega-ton-scale seawater desalination plants is expected
to increase in the 2020s. The current cost of the PRO membrane is 3200 USD/module;
the power generation cost for PRO, using concentrated seawater of 1,000,000 cubic meter
per day (CMD), is 0.19 USD/kWh. If the PRO membrane cost is 550 USD/module, the
power generation cost for PRO at the mega-ton scale is 0.09 USD/kWh. The PRO system
is fully applicable for large-scale seawater desalination plants. The power-generation
cost of the PRO system is sufficiently competitive at the mega-ton scale, as compared to
current industrial electricity charges. The total power generation capacity of PRO using
concentrated seawater and fresh water is 3 GW. The total power generation capacity of
PRO, using natural seawater and fresh water, is 1781 GW. However, the net output power
is approximately 50% of these values.
Kyowakiden Industry Co., Ltd., determined that the PRO system should be com-
mercialized, owing to ongoing energy issues and the technical state-of-the-art of the PRO
system. Therefore, preparations are underway to carry out a large-scale demonstration at
a seawater desalination plant, to facilitate the global introduction of PRO systems for the
realization of a sustainable society.
Author Contributions: Conceptualization, R.M.; methodology, R.M.; validation, R.M. and T.U.;
formal analysis, R.M. and T.U.; investigation, R.M.; resources, H.S.; data curation, R.M.; writing—
original draft preparation, R.M.; writing—review and editing, R.M. and A.T.; visualization, R.M.;
supervision, H.S. and A.T.; project administration, H.S.; funding acquisition, H.S. All authors have
read and agreed to the published version of the manuscript.
Funding: This research received no external funding.
Institutional Review Board Statement: Not applicable.
Informed Consent Statement: Not applicable.
Data Availability Statement: Not applicable.
Conflicts of Interest: The authors declare that they have no known competing financial interests or
personal relationships that could have appeared to influence the work reported in this paper.Membranes 2021, 11, 69 13 of 14
References
1. UNDP. UNDP Support to the Implementation of Sustainable Development Goal 7: Affordable and Clean Energy; United Nations
Development Programme: New York, NY, USA, 2016. Available online: https://www.undp.org/content/dam/undp/library/
Climate%20and%20Disaster%20Resilience/7%20Clean%20Energy-Feb%202017.pdf (accessed on 17 December 2020).
2. UNDP. UNDP Support to the Implementation of Sustainable Development Goal 14: Ocean Governanceu; United Nations Development
Programme: New York, NY, USA, 2016. Available online: https://www.undp.org/content/dam/undp/library/Sustainable%20
Development/14_Oceans_Jan15_digital.pdf (accessed on 17 December 2020).
3. Ratnam, K.S.; Palanisamy, K.; Yang, G. Future low-inertia power systems: Requirements, issues, and solutions—A review. Renew.
Sustain. Energy Rev. 2020, 124, 109773. [CrossRef]
4. Jahangiri, M.; Haghani, A.; Mostafaeipour, A.; Khosravi, A.; Raeisi, H.A. Assessment of Solar-Wind Power Plants in Afghanistan:
A Review. Renew. Sustain. Energy Rev. 2019, 99, 169–190. [CrossRef]
5. Loeb, S. Production of energy from concentrated brines by pressure-retarded osmosis. J. Membr. Sci. 1976, 1, 49–63. [CrossRef]
6. Lee, C.; Chae, S.H.; Yang, E.; Kim, S.; Kim, J.H.; Kim, I.S. A comprehensive review of the feasibility of pressure retarded osmosis:
Recent technological advances and industrial efforts towards commercialization. Desalination 2020, 491, 114501. [CrossRef]
7. Matsuyama, K.; Makabe, R.; Ueyama, T.; Sakai, H.; Saito, K.; Okumura, T.; Hayashi, H.; Tanioka, A. Power Generation System
Based on Pressure Retarded Osmosis with a Commercially Available Hollow Fiber PRO Membrane Module Using Seawater and
Freshwater. Desalination 2021, 499, 114805. [CrossRef]
8. Aseffa, H.T.; Gautam, D.K.; Subbiah, S. Optimization of pressure retarded osmosis process and estimation of Indian blue energy
capacity. Desalination 2021, 498, 114752. [CrossRef]
9. Skilhagen, S.E.; Dugstad, J.E.; Aaberg, R.J. Osmotic power—power production based on the osmotic pressure difference between
waters with varying salt gradients. Desalination 2008, 220, 476–482. [CrossRef]
10. Ahmed, F.E.; Hashaikeh, R.; Hilal, N. Hybrid technologies: The future of energy efficient desalination—A review. Desalination
2020, 495, 114659. [CrossRef]
11. Kohout, F.A. Reorientation of Our Saline Water Resources Thinking. Water Resour. Res. 1970, 6, 1442–1448. [CrossRef]
12. El-Ghonemy, A.M.K. Performance test of a sea water multi-stage flash distillation plant: Case study. Alex. Eng. J. 2018, 57,
2401–2413. [CrossRef]
13. Guo, Y.; Bao, M.; Gong, L.; Shen, S. Effects of preheater arrangement on performance of MED desalination system. Desalination
2020, 496, 114702. [CrossRef]
14. Esfahani, I.J.; Ataei, A.; Shetty, V.; Oh, T.; Park, J.H.; Yoo, C. Modeling and Genetic Algorithm-Based Multi-Objective Optimization
of the MED-TVC Desalination System. Desalination 2012, 292, 87–104. [CrossRef]
15. Pontié, M.; Awad, S.; Tazerout, M.; Chaouachi, O.; Chaouachi, B. Recycling and Energy Recovery Solutions of End-of-Life Reverse
Osmosis (RO) Membrane Materials: A Sustainable Approach. Desalination 2017, 423, 30–40. [CrossRef]
16. Mustakeem, M.; Qamar, A.; Alpatova, A.; Ghaffour, N. Dead-End Membrane Distillation with Localized Interfacial Heating for
Sustainable and Energy-Efficient Desalination. Water Res. 2020, 189, 116584. [CrossRef]
17. Elimelech, M.; Phillip, W.A. The Future of Seawater Desalination: Energy, Technology, and the Environment. Science 2011, 333,
712–717. [CrossRef]
18. Kaminski, W.; Marszalek, J.; Tomczak, E. Water Desalination by Pervaporation—Comparison of Energy Consumption. Desalination
2018, 433, 89–93. [CrossRef]
19. Koutsou, C.P.; Kritikos, E.; Karabelas, A.J.; Kostoglou, M. Analysis of Temperature Effects on the Specific Energy Consumption in
Reverse Osmosis Desalination Processes. Desalination 2020, 476, 114213. [CrossRef]
20. Villa Sallangos, O.L. Operating Experience of the Dhekelia Seawater Desalination Plant Using an Innovative Energy Recovery
System. Desalination 2005, 173, 91–102. [CrossRef]
21. Lee, S.; Choi, J.; Park, Y.-G.; Shon, H.; Ahn, C.H.; Kim, S.-H. Hybrid Desalination Processes for Beneficial Use of Reverse Osmosis
Brine: Current Status and Future Prospects. Desalination 2019, 454, 104–111. [CrossRef]
22. Liyanaarachchi, S.; Jegatheesan, V.; Muthukumaran, S.; Gray, S.; Shu, L. Mass Balance for a Novel RO/FO Hybrid System in
Seawater Desalination. J. Membr. Sci. 2016, 501, 199–208. [CrossRef]
23. Saito, K.; Irie, M.; Zaitsu, S.; Sakai, H.; Hayashi, H.; Tanioka, A. Power Generation with Salinity Gradient by Pressure Retarded
Osmosis Using Concentrated Brine from SWRO System and Treated Sewage as Pure Water. Desalin. Water Treat. 2012, 41, 114–121.
[CrossRef]
24. Sakai, H.; Ueyama, T.; Irie, M.; Matsuyama, K.; Tanioka, A.; Saito, K.; Kumano, A. Energy Recovery by PRO in Sea Water
Desalination Plant. Desalination 2016, 389, 52–57. [CrossRef]
25. Hayashi, H.; Okumura, T.; Sakai, H.; Irie, M. Hollow Fiber Forward Osmosis Membrane. European Patent EP2586518A4,
24 June 2011.
26. Sakai, H.; Irie, M.; Tanioka, A. Salt Water Desalination Device. Australia Patent AU2014247832B2, 24 March 2016.
27. Sakai, H.; Irie, M.; Zaitsu, S. Controller for Energy Generation System. Australia Patent AU2016310895A1, 11 October 2018.
28. Panagopoulos, A.; Haralambous, K.J. Environmental Impacts of Desalination and Brine Treatment—Challenges and Mitigation
Measures. Mar. Pollut. Bull. 2020, 161, 111773. [CrossRef] [PubMed]
29. Skilhagen, S.E. Osmotic Power—A New, Renewable Energy Source. Desalin. Water Treat. 2010, 15, 271–278. [CrossRef]Membranes 2021, 11, 69 14 of 14
30. Osmotic Power Opportunity—Statkraft. Available online: https://www.statkraft.com/globalassets/old-contains-the-old-folder-
structure/documents/osmotic-power-at-ida-event-huntington-beach-usa-02112010_tcm9-19286.pdf (accessed on 17 December
2020).
31. Mehta, G.D.; Loeb, S. Internal Polarization in the Porous Substructure of a Semipermeable Membrane Under Pressure-Retarded
Osmosis. J. Membr. Sci. 1978, 4, 261–265. [CrossRef]
32. Ju, J.; Choi, Y.; Lee, S.; Park, Y.G. Comparison of Different Pretreatment Methods for Pressure Retarded Osmosis (PRO) Membrane
in Bench-Scale and Pilot-Scale Systems. Desalination 2020, 496, 114528. [CrossRef]
33. Wan, C.F.; Jin, S.; Chung, T.S. Mitigation of Inorganic Fouling on Pressure Retarded Osmosis (PRO) Membranes by Coagulation
Pretreatment of the Wastewater Concentrate Feed. J. Membr. Sci. 2019, 572, 658–667. [CrossRef]
34. Liu, X.; Foo, L.-X.; Li, Y.; Lee, J.-Y.; Cao, B.; Tang, C.Y. Fabrication and Characterization of Nanocomposite Pressure Retarded
Osmosis (PRO) Membranes with Excellent Anti-Biofouling Property and Enhanced Water Permeability. Desalination 2016, 389,
137–148. [CrossRef]
35. Zhang, S.; Sukitpaneenit, P.; Chung, T.-S. Design of Robust Hollow Fiber Membranes with High Power Density for Osmotic
Energy Production. Chem. Eng. J. 2014, 241, 457–465. [CrossRef]
36. Li, X.; Cai, T.; Chung, T.S. Anti-Fouling Behavior of Hyperbranched Polyglycerol-Grafted Poly(Ether Sulfone) Hollow Fiber
Membranes for Osmotic Power Generation. Environ. Sci. Technol. 2014, 48, 9898–9907. [CrossRef]
37. Fan, X.; Liu, Y.; Quan, X. A Novel Reduced Graphene Oxide/Carbon Nanotube Hollow Fiber Membrane with High Forward
Osmosis Performance. Desalination 2019, 451, 117–124. [CrossRef]
38. Tang, Y.; Li, S.; Xu, J.; Gao, C. Thin Film Composite Forward Osmosis Membrane with Single-Walled Carbon Nanotubes Interlayer
for Alleviating Internal Concentration Polarization. Polymers 2020, 12, 260. [CrossRef] [PubMed]
39. Lee, S.; Park, T.; Park, Y.-G.; Lee, W.; Kim, S.-H. Toward Scale-Up of Seawater Reverse Osmosis (SWRO)-Pressure Retarded
Osmosis (PRO) Hybrid System: A Case Study of a 240 m3 /Day Pilot Plant. Desalination 2020, 491, 114429. [CrossRef]
40. Valladares Linares, R.V.; Li, Z.; Sarp, S.; Bucs, S.S.; Amy, G.; Vrouwenvelder, J.S. Forward Osmosis Niches in Seawater Desalination
and Wastewater Reuse. Water Res. 2014, 66, 122–139. [CrossRef] [PubMed]
41. Toyobo’s Hollow Fiber Forward Osmosis Membrane Adopted at Danish Osmotic Power Plant. Available online: https://www.
toyobo-global.com/system/files/News_Release/201902/press20181217.pdf (accessed on 17 December 2020).
42. Jones, E.; Qadir, M.; van Vliet, M.T.H.; Smakhtin, V.; Kang, S.M. The State of Desalination and Brine Production: A Global Outlook.
Sci. Total Environ. 2019, 657, 1343–1356. [CrossRef]
43. Kurihara, M.; Takeuchi, H.; Ito, Y. A Reliable Seawater Desalination System Based on Membrane Technology and Biotechnology
Considering Reduction of the Environmental Impact. Environments 2018, 5, 127. [CrossRef]
44. Kurihara, M.; Ito, Y. Sustainable Seawater Reverse Osmosis Desalination as Green Desalination in the 21st Century. J. Membr. Sci.
Res. 2020, 6, 20–29.
45. Jenkins, S.; Paduan, J.; Roberts, P. (Chair), Daniel Schlenk, Judith Weis, Management of Brine Discharges to Coastal Waters Recommendations of
a Science Advisory Panel; 2012 Technical Report 694; California Water Resources Control Board: Sacramento, CA, USA, 2012.
46. Wang, H.; Jiang, X. Legal Measures to Reduce Marine Environmental Risks of Seawater Desalination in China. Nat. Resour. Forum
2020, 44, 129–143. [CrossRef]
47. Ozair, G.; Al-Zahrany, S.A.; Al-Shubaili, A.A. MARAFIQ’s Quest to Minimizing the Impact of Desalination on the Marine Environment;
IDA World Congress: Dubai, UAE, 2019.
48. Kelaher, B.P.; Clark, G.F.; Johnston, E.L.; Coleman, M.A. Effect of Desalination Discharge on the Abundance and Diversity of Reef
Fishes. Environ. Sci. Technol. 2020, 54, 735–744. [CrossRef]
49. Oki, T.; Kanae, S. Global Hydrological Cycles and World Water Resources. Science 2006, 313, 1068–1072. [CrossRef]You can also read