Communicating disaster risk? An evaluation of the availability and quality of flood maps - Nat. Hazards Earth Syst. Sci.
←
→
Page content transcription
If your browser does not render page correctly, please read the page content below
Nat. Hazards Earth Syst. Sci., 19, 313–323, 2019
https://doi.org/10.5194/nhess-19-313-2019
© Author(s) 2019. This work is distributed under
the Creative Commons Attribution 4.0 License.

Communicating disaster risk? An evaluation of the
availability and quality of flood maps
Daniel Henstra1 , Andrea Minano2 , and Jason Thistlethwaite2
1 Department    of Political Science, University of Waterloo, Waterloo, Ontario, N2L 3G1, Canada
2 School   of Environment, Enterprise and Development, University of Waterloo, Waterloo, Ontario, N2L 3G1, Canada

Correspondence: Daniel Henstra (dhenstra@uwaterloo.ca)

Received: 11 September 2018 – Discussion started: 4 October 2018
Revised: 11 January 2019 – Accepted: 24 January 2019 – Published: 1 February 2019

Abstract. One of the key priorities for disaster risk reduction    certed effort to “reduce the damage caused by natural hazards
is to ensure decision makers, stakeholders, and the public un-     . . . through an ethic of prevention” (UNISDR, 2018).
derstand their exposure to disaster risk, so that they can take         This strategy of disaster risk reduction is embodied in the
protective action. Flood maps are a potentially valuable tool      Sendai Framework for Disaster Risk Reduction, an interna-
for facilitating this understanding of flood risk, but previous    tional agreement endorsed in 2015 by 187 United Nations
research has found that they vary considerably in availability     members. The framework’s first priority – understanding dis-
and quality. Using an evaluation framework comprising nine         aster risk – exhorts member states to “develop, periodically
criteria grounded in existing scholarship, this study assessed     update and disseminate, as appropriate, location-based dis-
the quality of flood maps available to the public in Canadian      aster risk information, including risk maps, to decision mak-
communities located in designated flood risk areas. It found       ers, the general public and communities at risk of exposure
that flood maps in most municipalities (62 %) are low quality      to disaster” (United Nations, 2015, p.15). This priority sup-
(meeting less than 50 % of the criteria) and the highest score     ports risk-based decision-making through the transparent ex-
was 78 % (seven of nine criteria met). The findings suggest        change of accessible and up-to-date risk information (United
that a more concerted effort to produce high-quality, publicly     Nations, 2015, p. 14).
accessible flood maps is required to support Canada’s inter-            In the context of floods, this priority suggests that stake-
national commitment to disaster risk reduction. Further ques-      holders must understand the probability of flooding at their
tions surround possible weighting of quality assessment cri-       location, the likely inundation zone of a flood of a particu-
teria, whether and how individuals seek out flood maps, and        lar magnitude, possible impacts on their property and assets,
how flood risk information could be better communicated us-        and measures they can take to mitigate the risk. Flood maps
ing modern technology.                                             – cartographic depictions of geographic areas that could
                                                                   be flooded – are a potentially valuable tool for facilitating
                                                                   this understanding of disaster risk (Dransch et al., 2010).
                                                                   Flood maps are used for a variety of purposes (e.g., land
1   Introduction                                                   use decisions, emergency management) and by various users
                                                                   (Van Alphen et al., 2009). As a result, one kind of flood map
Flooding is a major global problem that affects millions           is not suitable for all purposes, so they must be designed with
of people annually. Both the frequency and magnitude               consideration of who will be using them and for what pur-
of extreme floods have grown over the past few decades             pose (Luke et al., 2018; Sayers et al., 2013).
(Berghuijs et al., 2017), while models project increased fu-            One important purpose of flood maps is to communi-
ture flooding along rivers (Alfieri et al., 2016; Winsemius et     cate risk to public audiences (Hagemeier-Klose and Wag-
al., 2016), in coastal zones (Vitousek et al., 2017), and in ur-   ner, 2009; Kellens et al., 2009; Minano and Peddle, 2018).
ban areas (Kundzewicz et al., 2014). Countering this threat        Flood maps used for risk communication generally seek to
requires a strategy of disaster risk reduction, meaning a con-

Published by Copernicus Publications on behalf of the European Geosciences Union.
314 D. Henstra et al.: Communicating disaster risk? An evaluation of the availability and quality of flood maps
raise public awareness about flood impacts, impart flood pre- age of the foreseen consequences of flooding, flood hazard
paredness advice, and increase transparency about govern- maps can enhance people’s knowledge about flood risk, mak-
ment actions for reducing flood risk. However, flood maps ing them more capable of an adequate response”. Although
designed for this purpose must ensure that intended audi- flood hazard maps provide a rational basis for public policies
ences are able to understand and correctly interpret the in- and administrative decisions, they typically contain highly
formation presented (Kellens et al., 2009; Van Kerkvoorde et technical data, lack information on potential adverse con-
al., 2018). sequences associated with flooding, and fail to distinguish
Since one of the key principles of modern flood risk man- among different flood sources. These characteristics limit
agement is to enable citizens to understand and act on flood their utility for strengthening public understanding of flood
risk (Sayers et al., 2013), this study analyzes the suitability risk.
of existing flood maps as tools for communicating risk to Flood risk maps include flood hazard information, but also
the public. To this end, the article identifies key characteris- depict assets at risk (e.g., structures; critical infrastructure)
tics that experts associate with flood maps suitable for pub- and include indicators of the adverse consequences associ-
lic audiences and combines them into an evaluative frame- ated with floods, typically denoted in terms of households
work. This framework is then applied to evaluate publicly affected, economic activity likely to be affected, and so on
and freely available web-based flood maps of Canadian com- (Stevens and Hanschka, 2014, p. 909). With their enhanced
munities. It finds that flood maps are often difficult to locate detail, flood risk maps are valuable for stimulating policy di-
through online searches and most flood maps available to alogue about flood risk management, supporting decisions
Canadians are not suitable for communicating flood risk to about strategic investments in structural and non-structural
the public. mitigation, informing insurance underwriting, and increasing
The paper begins by drawing insights from existing litera- public awareness of flood risk (Albano et al., 2017; Büchele
ture about types of flood maps and previous studies that have et al., 2006; Marco, 1994).
sought to evaluate their quality. It then sets the context for the Good flood maps are important for a number of rea-
present study by providing a short history of flood mapping sons. First, outdated or poor-quality flood maps allow for
in Canada. The fourth section describes the study’s methods faulty planning decisions that put people and property at risk
of data collection and analysis, including how the maps were (Keller et al., 2017; Reid, 2014). Second, communicating
located and catalogued and the assessment criteria used to flood risk to stakeholders and the public in an effective way
evaluate their quality. Section 5 presents the results of the is important to build trust in the information disseminated
analysis, describing the availability and quality of flood maps by authorities and to motivate those at risk to take protec-
in Canada, and this is followed by a discussion of the key tive actions. Finally, flood maps that effectively assist peo-
findings and implications. The paper concludes with recom- ple in understanding their risk are important to legitimate po-
mendations for future policy and research on flood mapping. tentially contentious decisions around disaster risk reduction,
such as relocating households out of harm’s way (Kellens et
al., 2009). For these reasons, evaluating the quality of flood
2 Literature review maps is an important imperative.
Flood map analysis and evaluation has a relatively strong
There are two main types of flood maps, which can be differ- scholarly foundation, as illustrated by a number of stud-
entiated from one another based on their purpose and content ies that have assessed flood maps over the past decade.
(Canada, 2017, p. 5; EU Environment, 2007, p. 11). Flood Hagemeier-Klose and Wagner (2009), for instance, com-
hazard maps indicate geographic areas, typically along wa- pared flood maps across five European countries – Germany,
terways and coasts, that could be covered by a flood of a par- Austria, Switzerland, the Netherlands, and Great Britain – in
ticular magnitude (e.g., the “100-year flood” or “1 % annual order to evaluate them in terms of readability, design, and
exceedance probability”). They are typically used to support content. They found considerable variation in the compre-
planning and engineering functions, such as setting zoning hensiveness and complexity of the information presented and
regulations and enforcing development standards (Porter and differences in the terminology used to describe flood hazard
Demeritt, 2012). In the Canadian province of Ontario, for ex- probability.
ample, flood hazard maps are created by conservation author- In a more comprehensive analysis, de Moel et al. (2009)
ities – regional watershed management agencies empowered assessed the availability and content of flood maps in 29 Eu-
by provincial legislation – and are used to regulate develop- ropean countries. This study was timely, following shortly af-
ment in flood-prone areas along waterways. ter the European Floods Directive of 2007, which directed all
Flood hazard maps sometimes also include additional in- EU member states to conduct a national assessment of their
formation, such as the type of flood, flood extent, water flood hazard, exposure, and vulnerability, which would be
depths, and flow velocity, which can be useful for raising used to develop flood risk maps and flood risk management
public awareness about flooding (Paine and Watt, 1992). As plans (Fuchs et al., 2017; Hartmann and Spit, 2016). They
Kjellgren (2013, p. 1857) argues, “by providing a visual im- found that most states had flood maps covering the bulk of
Nat. Hazards Earth Syst. Sci., 19, 313–323, 2019 www.nat-hazards-earth-syst-sci.net/19/313/2019/D. Henstra et al.: Communicating disaster risk? An evaluation of the availability and quality of flood maps 315
their territory but noted that very few had produced flood risk serve several key flood risk management functions, includ-
maps that include information on the consequences of flood- ing using zoning by-laws to direct development away from
ing, such as economic damage or the number of people likely flood-prone areas, issuing flood warnings when conditions
to be affected. These findings confirmed those of an earlier seem imminent, and subsidizing property-level flood protec-
study of European flood mapping practices, which observed tion measures such as backflow preventers.
“maps that illustrate possible consequences of inundations The most concerted flood mapping effort in Canada oc-
or information that helps to mitigate flood damages are rare” curred under the Flood Damage Reduction Program (FDRP),
(Merz et al., 2007, p. 234). More recent research evaluating an intergovernmental initiative that operated between 1975
the implementation of the European Floods Directive indi- and 1999, which aimed to identify high-risk flood areas
cates that considerable progress has been made toward the (de Loë, 2000). Through a general agreement between the
production of flood risk maps (Meyer et al., 2012), but flood government of Canada and the provinces, the cost of flood
risk management plans have lagged behind, particularly with mapping was cost-shared on a 50–50 basis, and all provinces
respect to mountain flood hazards. Key implementation chal- and territories except Prince Edward Island and Yukon par-
lenges have included engaging the public in local risk assess- ticipated (Bruce, 1976; Watt, 1995). Nunavut was also not
ment and navigating legal, institutional, and professional di- a part of the FDRP since it did not become an independent
vides (Hartmann and Driessen, 2017; Nones, 2017; Thaler et territory until 1999 (ECCC, 2013; INAC, 2014). Although
al., 2018). some provinces adopted more stringent standards, the 100-
In Canada, Stevens and Hanschka (2014) collected flood year flood was used as the minimum criterion for the FDRP,
hazard maps from every municipality in the province of which resulted in the identification of 957 “designated flood
British Columbia and evaluated them based on 32 good map- risk areas”, meaning those lands that are subject to recurrent
ping practices, such as whether they included a legend, indi- and severe flooding (ECCC, 2013).
cated the floodway boundary, included the flood elevation for The FDRP differentiated between large-scale “engineer-
different probabilities, and showed the boundaries of individ- ing maps”, which contained topographic contour lines and
ual property parcels. They found that only 43 % of munici- delineated floodplains for planning purposes, and small-scale
palities possessed a flood hazard map and most of these maps “public information maps”, which also contained local fea-
were of poor quality for land use decision-making, with no tures such as roads and buildings, as well as the extent of
map containing more than 15 of the 32 assessment criteria historic flood events. The intergovernmental agreement spec-
(i.e., > 47 %). ified that provincial governments would direct municipalities
to regulate or prohibit development in designated areas, and
both the federal and provincial governments would refuse
3 Study context disaster assistance to these areas once the public had been
made aware of the hazard (de Loë and Wojtanowski, 2001;
Canada is a large and geographically diverse country, with Page, 1980).
regional exposure to all forms of flooding, including river- Although the FDRP made flood risk more transparent,
ine (fluvial) inundation, coastal flooding caused mainly by weak enforcement of floodplain regulations and a general
storms and storm surge, and surface water (pluvial) flooding unwillingness among elected politicians to refuse disaster
caused by heavy precipitation, which flows into streets and assistance to designated areas prompted the government of
affects nearby structures (Burn and Whitfield, 2016; Tucker, Canada to withdraw from the initiative in 1999 (Kumar et
2000). More than 80 significant flood disasters have affected al., 2001; de Loë, 2000). There has since been no similar in-
various parts of Canada since the year 2000, and extreme tergovernmental effort to identify high-risk lands and update
rainfall alone caused more than CAD 20 billion in losses in flood maps, nor is there a national repository of flood maps
urban areas from 2003 to 2012 (Kovacs and Sandink, 2013; in Canada.
Public Safety Canada, 2015). In recent years, however, public officials have shown re-
Canada is also a federal state, in which sovereign author- newed interest in updating existing flood maps and produc-
ity is constitutionally divided between one national govern- ing new maps to support disaster risk reduction. In 2015, for
ment and 10 provincial governments. Flood risk manage- instance, the government of Canada launched the National
ment (including flood mapping) is overseen predominantly Disaster Mitigation Program, a 5-year, CAD 200 million ini-
by the provinces, which set regulatory standards for devel- tiative to (1) focus investments on significant, recurring flood
opment, fund structural mitigation works, and provide disas- risk and costs and (2) facilitate private residential insurance
ter assistance to affected communities. The federal govern- for overland flooding (Public Safety Canada, 2017). One of
ment plays an important role by, for example, providing fore- four funding streams pertains to flood mapping, which per-
casts of weather conditions that could lead to flooding, mon- mits provinces and territories to apply for support to develop
itoring flood hazards from the Government Operations Cen- or modernize flood maps. Flood mapping funding has been
tre, funding small flood mitigation projects, and contributing allocated in British Columbia, New Brunswick, and Ontario
to post-flood disaster assistance. Finally, local governments (Public Safety Canada, 2018a–c).
www.nat-hazards-earth-syst-sci.net/19/313/2019/ Nat. Hazards Earth Syst. Sci., 19, 313–323, 2019316 D. Henstra et al.: Communicating disaster risk? An evaluation of the availability and quality of flood maps
Moreover, in 2017 a flood mapping committee compris- Table 1. Number and percentage of FDRP communities analyzed
ing six federal departments, which was advised by a work- by province or territory.
ing group that included representatives from provincial gov-
ernments, industry, and academia, released a Federal Flood- Province/territory Number Number Percent
of FDRP of FDRP analyzed
plain Mapping Framework. Its core objective is to “facilitate communities communities
a common national best practice and increase the sharing and (total) analyzed
use of flood hazard information” in order to generate a “com- Alberta 16 4 25 %
prehensive understanding of hazard exposure in order to in- British Columbia 216 86 40 %
form mitigation and preventative measures” (Canada, 2017). Manitoba 25 10 40 %
Finally, a national roundtable hosted by the federal minister New Brunswick 84 35 42 %
Newfoundland and Labrador 24 11 46 %
of public safety in November 2017 brought together repre- Northwest Territories 10 5 50 %
sentatives from all levels of government, Indigenous lead- Nova Scotia 24 9 38 %
ers, insurers, non-government organizations, and academics Ontario 273 105 38 %
to launch a formal dialogue on flood risk, which identified Quebec 265 98 37 %
Saskatchewan 20 6 30 %
current and accurate flood maps as a central priority (Boyer,
2017). Total 957 369 39 %
The starting point for any such effort, however, is a ful-
some understanding of the strengths and limitations of exist-
ing flood maps in order to identify opportunities for improve- 4.1 Community selection
ment. A preliminary scan commissioned by the government
of Canada found that most flood maps in Canada are dated The communities selected for this study (Table 1) included
– with a median age of 18 years – and that their availabil- the 957 designated flood risk areas compiled during the
ity is grossly uneven across the 10 provinces (MMM Group FDRP (ECCC, 2013). The FDRP communities were suitable
Limited, 2014). This article seeks to extend this analysis by for the purposes of this research because (1) they are known
evaluating the quality of publicly available flood maps in to be at high risk of flooding, (2) flood maps are more likely
Canada using internationally recognized principles of good to be available to the public in these communities, and (3) ac-
practice. The focus here is on flood maps that are freely and tions are likely to have been taken by governments to reduce
publicly accessible online, given that “the dissemination of flood risk in these communities (e.g., development regula-
flood maps via the Internet is a very important way of bring- tions). Communities in Prince Edward Island, Yukon, and
ing flood information to the public” especially as more peo- Nunavut are not a part of the study area since these provinces
ple become accustomed to digital technologies (Hagemeier- and territories did not participate in the FDRP.
Klose and Wagner, 2009, p. 572). The next section outlines In order to create a dataset of manageable size, but main-
the methods and analytical framework used to undertake the tain the validity of the study’s results, a random sample
quality evaluation. of 369 communities was drawn from the complete list of
957 communities (95 % confidence interval; 4 % margin of
error). This list captured communities in all provinces and
4 Methods territories that were part of the FDRP (Table 2). The final list
of communities was recorded in a database, with their cor-
This study involved four general phases. First, researchers responding designated flood risk area, province, present-day
gathered a list of communities across Canada that are at municipality name (i.e., 2016 census subdivisions as defined
high risk of flooding. Second, a thorough online search was by Statistics Canada), and regional watershed authority (in
conducted to find maps that depict flood hazards or flood Ontario only).
risk in the selected communities. As discussed in detail be- Because some communities have changed their names
low, researchers scanned provincial, regional, and munici- and/or been amalgamated with other communities since the
pal government websites, followed by a search using an on- time of the FDRP, we matched the FDRP-designated com-
line search engine. Third, a comprehensive review of schol- munities with their present-day municipal boundaries. As
arly and grey literature was conducted to identify nine bi- such, though the study area covers 369 FDRP-designated ar-
nary criteria by which the quality of publicly accessible flood eas, these are situated within 280 municipalities.
maps could be evaluated. Finally, two researchers assessed
each map using the selected criteria. To generate a summary 4.2 Online search
of findings, statistics were computed based on the highest-
ranking flood maps available for each community and its re- Since they vary significantly in scope and content, a flood
spective municipality. map was defined operationally as one that
– cartographically depicts flood-prone areas for at least
part of the community of interest;
Nat. Hazards Earth Syst. Sci., 19, 313–323, 2019 www.nat-hazards-earth-syst-sci.net/19/313/2019/D. Henstra et al.: Communicating disaster risk? An evaluation of the availability and quality of flood maps 317
Table 2. Map assessment criteria, examples, and scholarly references.
Criterion Description Sources
Personalized experience enables users to find information specific to their Kellens et al. (2009)
property (e.g., postal code search to locate property
in relation to flood hazard)
Local context contains identifiable places or landmarks (e.g., major Van Kerkvoorde et al. (2018)
and minor roads, public buildings, neighbourhood
names) that help an individual visualize the likely
spatial extent of flooding
Historical context depictions of past flood events (e.g., photographs; de Moel et al. (2009), Luke
victim testimonials) to help users understand et al. (2018)
potential impacts
Legend legibility clear explanation of lines, symbols, colours, and EXCIMAP (2007), Fuchs et
terminology al. (2009)
Flood zone legibility easy for the user to distinguish the extents of the Hagemeier-Klose and
flood hazard zone Wagner (2009), Kellens et
al. (2009), Van Alphen et al.
(2009), Fuchs et al. (2009)
Explanation of technical meaning of terms is understandable to a lay audience Hagemeier-Klose and
terms (e.g., properties in 20-year flood zone more likely to Wagner (2009),
be flooded that those in a 100-year flood zone) Meyer et al. (2012)
Risk reduction advice paired with information about the consequences of Merz et al. (2007), Meyer et
flooding and preventative or precautionary actions al. (2012), Van Alphen et al.
that residents can take (e.g., install a backwater (2009)
valve, buy flood insurance)
Transparency about provides information about types of flooding Merz et al. (2007)
limitations and depicted and/or potential exposure of areas adjacent
uncertainty to the flood lines
Depiction of multiple depicts all forms of flooding to which a property is EA (2010)
flood hazards exposed (e.g., coastal, riverine, and pluvial)
– labels flood-prone areas using terminology understand- – searching these government websites using terms such
able to a lay audience (e.g., floodplain, flood zone, flood as “flood”, “maps”, “land use”, and “development
hazard); and plan”;
– is published online as either a static image (e.g., PDF – seeking out missing maps through relevant departmen-
document, scanned image, figure in a report) or dynamic tal web pages, such as public works, emergency re-
interface (e.g., interactive web map). sponse, planning and development, by-laws, geographic
information systems (GISs), and maps;
Researchers then sought out online flood maps for each of the
280 municipalities included in the study area. Individual on- – conducting an additional Google search using both the
line searches were conducted for each municipality because municipality name and “flood map” (e.g., “Calgary
there is no national repository of flood maps in Canada, and flood map”).
there has been no coordinated effort among regional and lo- As a quality check, a second researcher then reviewed the
cal governments to produce flood maps since the FDRP. For first researcher’s search and followed the same steps again.
each community, one researcher looked for flood maps by Once the map was found by either researcher, its hyperlink
was recorded in the database for its corresponding commu-
– using an online search engine to find the community’s
nity. If a flood map was not found by following the above
respective provincial, municipal, and regional water-
steps, the map was recorded as inaccessible to a lay audi-
shed authority website (as applicable);
ence. Some flood maps depicted flood-prone areas in more
than one community; in those cases, the same hyperlink was
www.nat-hazards-earth-syst-sci.net/19/313/2019/ Nat. Hazards Earth Syst. Sci., 19, 313–323, 2019318 D. Henstra et al.: Communicating disaster risk? An evaluation of the availability and quality of flood maps
recorded in the database under multiple communities. Con- linked directly to additional resources (e.g., an interactive
versely, some communities had multiple flood maps in cases web map with a “Help” link), then the associated resources
in which, for example, both the provincial and municipal were also considered in the quality evaluation. Once the two
governments had produced and published a flood map. In researchers had completed their individual assessments, they
these cases, both maps were stored in the database and as- exchanged results and conducted random “spot checks” to
sessed using the quality evaluation framework, but the re- ensure quality control. As noted above, where multiple maps
sults from only the highest-quality map were retained for were found for a community, only the map with the highest
analysis and discussion. The search for flood maps lasted overall quality was selected to represent the overall quality
for 6.5 weeks (18 June to 25 July 2018). We are confi- of flood maps for that community.
dent that these communities did not produce and publish
maps within the 6.5-week period (and were therefore mis-
coded as “inaccessible”) because to our knowledge none of 5 Results
the four provinces in which these communities are located
(Saskatchewan, Nova Scotia, Ontario, and Manitoba) had ac- The results described in this section focus on those commu-
tive mapping efforts underway at the time. nities that had available flood maps. The evaluation results
for the 369 FDRP-designated communities are grouped by
their respective present-day municipalities (n = 280).
4.3 Quality evaluation framework
5.1 Availability of flood maps
Although there are several studies that assess the design of
flood maps, such as the most appropriate colour scheme for After completing the online search, researchers found at least
depicting floodplains (Seipel and Lim, 2017), this study fo- one flood map for 239 of 280 municipalities (85 %) in the
cused on key characteristics that international scholars high- study area (Fig. 1). Flood maps were not found for 41 munic-
light as important for public risk communication. In this con- ipalities (15 %) in the study area. Most municipalities lacking
text, the purpose of the map is to inform the public about available flood maps were in Ontario. In many of those com-
flood risks and motivate individuals to take precautionary ac- munities, researchers found maps that depicted development-
tions (Hagemeier-Klose and Wagner, 2009). Although some regulated areas, but these did not meet the operational defi-
of the maps assessed for this study may not have been cre- nition of flood map outlined above (i.e., map did not clearly
ated with this explicit objective, our interest was to assess label flood-prone areas using terminology understandable to
how well the maps that are currently available to Canadians a lay audience).
living in flood-prone areas inform them about flood risk.
After conducting a scan of international literature, nine cri- 5.2 Quality of flood maps
teria were identified for the quality assessment framework,
including personalized experience, local context, historical The evaluation found that flood maps in most municipalities
context, legend legibility, flood zone legibility, explanation (62 %) are low quality – meeting less than 50 % of the criteria
of technical terms, risk reduction advice, transparency about (i.e. score of < 4 out of 9) – and are therefore ill-suited for
flood modelling limitations, and depiction of multiple flood communicating flood risk to public audiences. Only 16 % of
hazards (Table 2). In combination, these characteristics make municipalities had access to a flood map that met or exceeded
a flood map more effective for risk communication because five of the nine quality criteria. There were no flood maps that
they identify an individual property’s flood risk, create re- met all of the evaluation criteria; the highest score was 78 %
latable depictions of flood impacts on communities (e.g., us- (seven out of nine).
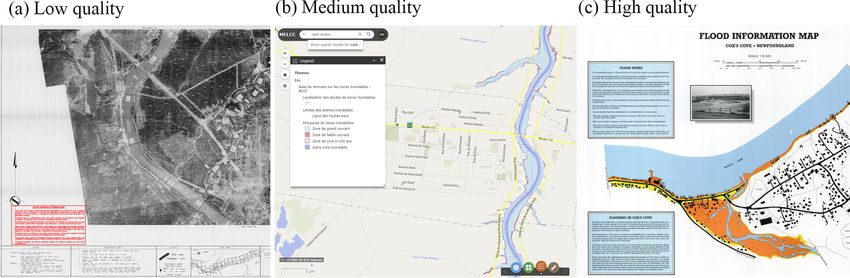
ing photographs), assist users in understanding the flood map Figure 2 illustrates how different quality scores were as-
and its limitations, and establish connections between haz- sessed. For example, it is possible to see the weaknesses of
ards and risk mitigation actions. the flood map for Barriere, British Columbia, particularly
in how it is difficult to distinguish the extent of the flood-
4.4 Quality assessment prone area. The flood maps for Saint-Césaire, Quebec, show
the flood hazards, but include neither measures of the conse-
The completed database included 369 FDRP-designated quences of flooding nor information on how residents could
communities and their associated flood maps. Two re- reduce their flood risk. The flood map for Cox’s Cove, New-
searchers then divided these maps and evaluated them using foundland, scored 78 % (seven out of nine) since it showed
the evaluation framework discussed above. The flood map local features (buildings and roads) vulnerable to flooding,
was assigned a score of “1” for each criterion it met, and a historical photos of past floods in Cox’s Cove, explanation of
score of “0” for each criterion that was not met. For exam- what is meant by “designated floodway”, but it was limited
ple, a map that used a distinct colour to distinguish the flood- to depicting river floods.
prone area from other areas received a 1 for the flood zone The municipalities with the highest-ranking flood maps
legibility criterion. If the map was part of a report or was were situated primarily in the provinces of Newfound-
Nat. Hazards Earth Syst. Sci., 19, 313–323, 2019 www.nat-hazards-earth-syst-sci.net/19/313/2019/D. Henstra et al.: Communicating disaster risk? An evaluation of the availability and quality of flood maps 319
Figure 1. Municipalities in the study area with available flood maps.
Figure 2. Comparison of flood maps and associated quality scores. (a) Barriere, British Columbia, score of 22 % (two out of nine) for includ-
ing a legend and limitations of flood modelling. (b) Saint-Césaire, Quebec, score of 44 % (four out of nine) for including an address search,
local context, legend, and legible flood zone. (c) Cox’s Cove, Newfoundland and Labrador, score of 78 % (seven out of nine) for including
identifiable buildings in the community, local context, legend, historical photographs and description, legible flood zone, explanation of
technical terminology, and a brief description about flood risk reduction at the property level (e.g., building a barrier around a building).
land and Labrador and New Brunswick. Newfoundland and summary, residents of flood-prone municipalities typically
Labrador’s flood maps were created during the FDRP and have access to flood maps that include (1) a legible legend,
ranked particularly high because the depictions of flood haz- (2) a legible flood zone, and (3) local contextual features,
ard were paired with additional locally relevant informa- such as road names and neighbourhood names.
tion, such as photographs of historical floods, the number of By contrast, less than 45 % of municipalities have access
homes evacuated, the costs of flood damage, and explana- to a flood map that would enable residents to identify their
tions of technical terms (e.g., 1-in-20-year flood). This con- individual property relative to the flood hazard. For example,
firms that the evaluation criteria are not biased towards newer despite ranking high overall, several flood maps available to
maps or those generated with modern technologies (e.g., web Newfoundland and Labrador communities depicted general
GIS portal), but rather privilege maps that include informa- flood risk for the community, rather than identifying individ-
tion to improve public understanding of flood risk. ual property parcels (Fig. 2). Similarly, only a small propor-
tion of available flood maps (21 %) were paired with infor-
5.3 Characteristics of flood maps mation that would assist a user in understanding the technical
terminology such as 100-year flood and floodplain.
Individual characteristics of flood maps were analyzed to Few flood maps (14 %) included information that would
identify which criteria were the most frequent (Fig. 3). In engender an emotional response to flood risks among resi-
www.nat-hazards-earth-syst-sci.net/19/313/2019/ Nat. Hazards Earth Syst. Sci., 19, 313–323, 2019320 D. Henstra et al.: Communicating disaster risk? An evaluation of the availability and quality of flood maps
Figure 3. Characteristics of flood maps available to municipalities.
dents, such as photographs of past floods or testimonials from Broader information access barriers experienced by the
past flood victims, which would make them more likely to researchers included (1) difficulties finding flood extents in
understand their risk. Even fewer (5 %) connected the flood web GIS applications (i.e., layer turned off by default or only
hazards portrayed on the map to actions residents could take visible when zoomed in), (2) long load and refresh times for
to reduce flood impacts. Finally, only nine municipalities web applications, and (3) web applications developed with
(3 %) had access to a map that depicted multiple flood haz- outdated software (e.g., Silverlight) that cannot be processed
ards. All of these maps were published by Ontario’s con- by modern web browsers.
servation authorities and they depicted both coastal (lake) The quality of flood maps in high-risk Canadian com-
flood hazards and riverine floodplains. Most maps found munities is also poor. Scholarly literature distinguishes be-
for the 280 municipalities depicted only riverine floodplains, tween flood maps created for experts and for lay users/non-
whereas none of the maps we evaluated included information experts (EXCIMAP, 2007; Van Kerkvoorde et al., 2018).
on risks from stormwater. With prior knowledge of hydrology and engineering, for in-
stance, expert users of a flood map can “handle more com-
plex tools” and typically demand more detailed information
6 Discussion (Van Kerkvoorde et al., 2018, p. 62). By contrast, lay users
require a simpler, more intuitive flood map. Most flood maps
The availability of flood maps in high-risk Canadian commu-
available to the public in Canada’s most flood-prone com-
nities is poor. Unlike other countries such as the United King-
munities are more suited for expert audiences than for lay
dom, Canada lacks a central portal through which the public
users. For instance, publicly accessible flood maps typically
can access flood map information. Instead, flood maps are
depict riverine floodplains and use technical terms (e.g., re-
located on many different government websites, and there is
turn periods) without providing explanations. Although these
inconsistency from one province to another. For example, in
maps might be useful for experts who would understand their
Alberta, New Brunswick, and Quebec, flood maps for many
limitations, they are not suitable for enabling citizens to un-
communities could be found in one central location, such as
derstand their disaster risk.
a provincial web GIS portal, but even in these cases, maps for
Historically, flood maps meant for public use were created
individual communities and properties were difficult to find.
to raise awareness about floods and encourage acceptance
Riverine flood maps in British Columbia are posted on a
of government initiatives, such as the establishment of reg-
provincial government website that groups flood maps ac-
ulated floodplains (Handmer, 1980). Today, by contrast, gov-
cording to regions (e.g., Vancouver Island) and designated
ernments are increasingly interested in shifting some respon-
floodplains (e.g., Cowichan River, Nanaimo River). Links on
sibility for flood risk management to the public by, for exam-
this base map then direct users to a map series index where
ple, encouraging their uptake of private flood insurance and
individual flood maps can be accessed. To find a flood map
installation of private flood protection measures (Thistleth-
for a specific community, however, users must identify their
waite et al., 2018). Such risk transfer policies are often mo-
respective designated area and then look through a map series
tivated by declining budgets for structural protections, and
index to find their community, an effort that few individuals
increasing risk awareness through information is an essen-
would be likely to expend.
Nat. Hazards Earth Syst. Sci., 19, 313–323, 2019 www.nat-hazards-earth-syst-sci.net/19/313/2019/D. Henstra et al.: Communicating disaster risk? An evaluation of the availability and quality of flood maps 321
tial prerequisite for their success (Holub and Fuchs, 2009). The evaluation framework used in this study represents a
In most of the municipalities we analyzed, however, maps first attempt to assess the quality of flood maps in Canada in
did not depict property-level flood risk or offer advice as to order to identify their key strengths and limitations. Future
how property owners could reduce their risk. This highlights research might involve weighting the various quality criteria
a strategic policy imperative for Canada: to create maps that based on feedback from lay users. Moreover, in light of the
are explicitly designed to foster public understanding of flood barriers faced by the research team in accessing flood maps,
risks. Such maps must be compelling (i.e., property-specific, it would be valuable to survey individuals to explore whether
set in historical context), understandable (i.e., contextually and how they seek out flood maps or flood risk information,
appropriate, legible, transparent), and actionable (i.e., paired and how to make it more easily accessible. Finally, whereas
with risk reduction advice). in the past it was not feasible to present the public with de-
tailed, property-level flood risk data, modern technology and
data intensive applications now allow for this functionality,
7 Conclusion and this is an opportunity for governments to provide mean-
ingful information to support the public in disaster risk re-
One of the key principles of disaster risk reduction, as articu-
duction.
lated through the Sendai Framework, is that stakeholders and
the public must first understand their disaster risk, as a pre-
requisite to reducing the damage caused by natural hazards.
Data availability. Data for this study can be found in the Supple-
With this in mind, our study sought to assess the suitabil- ment.
ity of existing flood maps as tools for communicating risk
to the public. Specifically, we assessed the availability and
quality of publicly accessible, online flood maps in Canada’s Supplement. The supplement related to this article is available
most flood-prone communities, namely those designated un- online at: https://doi.org/10.5194/nhess-19-313-2019-supplement.
der the Flood Damage Reduction Program as being subject
to recurrent and severe flooding.
Among the 280 municipalities targeted for analysis (which Author contributions. DH performed background research, co-
represented 369 FDRP-designated areas), 85 % had flood wrote the literature review and analytical framework, and completed
maps available online. However, many of these maps were the revisions. AM designed the map evaluation criteria, collected
difficult to locate and most were found to be generally unsuit- the maps, organized the database, and co-supervised the research as-
able for risk communication purposes. Most lacked charac- sistants. JT performed background research, co-wrote the literature
teristics that would assist users in understanding information review and analytical framework, and co-supervised the research
assistants.
depicted on the map, such as explanations of technical terms
and modelling limitations, and few included features that
might motivate protective responses, such as photographs of
Competing interests. The authors declare that they have no conflict
historical floods, potential consequences for property own-
of interest.
ers, and multiple types of flooding.
As governments look to increase public involvement in
flood risk management, greater effort will be required to ef- Acknowledgements. The authors gratefully acknowledge the
fectively communicate flood risk to the public. Flood maps helpful comments and suggestions of the editor and two reviewers,
play a significant role in this effort, but questions remain which improved the paper significantly. The authors would like
about what these maps should contain and how they should to thank Sarah Wilkinson and Jordan Blake for their assistance
be made accessible. As evidenced in countries such as Aus- in finding and coding the maps. This research was conducted
tria, Belgium, Germany, France, and the United Kingdom, with funding from the Social Sciences and Humanities Research
surveys or focus groups could be useful tools for determin- Council of Canada and the Marine Environmental Observation
ing user preferences concerning map design options, such as Prediction and Response (MEOPAR) Network.
colours, scale, terminology, and so on (Meyer et al., 2012;
Edited by: Kai Schröter
Van Kerkvoorde et al., 2018). A further consideration is who
Reviewed by: Michael Nones and Sven Fuchs
should produce and maintain flood maps to ensure their com-
pleteness, quality, and currency. A decentralized approach,
as in Canada, can result in considerable variation in the qual-
ity of flood maps from one community to another, and this
raises questions about equity when national or regional flood
risk management policies expect more responsibility to be
shouldered by individuals.
www.nat-hazards-earth-syst-sci.net/19/313/2019/ Nat. Hazards Earth Syst. Sci., 19, 313–323, 2019322 D. Henstra et al.: Communicating disaster risk? An evaluation of the availability and quality of flood maps
References Fuchs, S., Spachinger, K., Dorner, W., Rochman, J., and Serrhini,
K.: Evaluating cartographic design in flood risk mapping, Envi-
Albano, R., Mancusi, L., and Abbate, A.: Improving flood ron. Hazards, 8, 52–70, https://doi.org/10.3763/ehaz.2009.0007,
risk analysis for effectively supporting the implemen- 2009.
tation of flood risk management plans: The case study Fuchs, S., Röthlisberger, V., Thaler, T., Zischg, A., and
of “Serio” Valley, Environ. Sci. Policy, 75, 158–172, Keiler, M.: Natural Hazard Management from a Coevolu-
https://doi.org/10.1016/j.envsci.2017.05.017, 2017. tionary Perspective: Exposure and Policy Response in the
Alfieri, L., Bisselink, B., Dottori, F., Naumann, G., de Roo, A., European Alps, Ann. Am. Assoc. Geogr., 107, 382–392,
Salamon, P., Wyser, K., and Feyen, L.: Global projections of https://doi.org/10.1080/24694452.2016.1235494, 2017.
river flood risk in a warmer world, Earth’s Future, 5, 171–182, Hagemeier-Klose, M. and Wagner, K.: Evaluation of flood hazard
https://doi.org/10.1002/2016EF000485, 2016. maps in print and web mapping services as information tools in
Berghuijs, W. R., Aalbers, E. E., Larsen, J. R., Trancoso, flood risk communication, Nat. Hazards Earth Syst. Sci., 9, 563–
R. ,and Woods, R. A.: Recent changes in extreme floods 574, https://doi.org/10.5194/nhess-9-563-2009, 2009.
across multiple continents, Environ. Res. Lett., 12, 1–8, Handmer, J. W.: Flood hazard maps as public information: an
https://doi.org/10.1088/1748-9326/aa8847, 2017. assessment within the context of the Canadian Flood Dam-
Boyer, S.: Flood roundtable to help prepare Canadians for age Reduction Program, Can. Water Resour. J., 5, 82–110,
worsening flood risks, Insur. Bus. Can., available at: https://doi.org/10.4296/cwrj0504082, 1980.
https://www.insurancebusinessmag.com/ca/news/flood/flood- Hartmann, T. and Driessen, P.: The flood risk management plan:
roundtable-to-help (last access: 8 June 2018), 2017. towards spatial water governance, J. Flood Risk Manage., 10,
Bruce, J. P.: The National Flood Damage Reduction Program, Can. 145–154, https://doi.org/10.1111/jfr3.12077, 2017.
Water Resour. J., 1, 5–13, 1976. Hartmann, T. and Spit, T.: Implementing the European flood risk
Büchele, B., Kreibich, H., Kron, A., Thieken, A., Ihringer, J., management plan, J. Environ. Plan. Manage., 59, 360–377,
Oberle, P., Merz, B., and Nestmann, F.: Flood-risk mapping: https://doi.org/10.1080/09640568.2015.1012581, 2016.
contributions towards an enhanced assessment of extreme events Holub, M. and Fuchs, S.: Mitigating mountain hazards in Aus-
and associated risks, Nat. Hazards Earth Syst. Sci., 6, 485–503, tria: legislation, risk transfer, and awareness building, Nat. Haz-
https://doi.org/10.5194/nhess-6-485-2006, 2006. ards Earth Syst. Sci., 9, 523–537, https://doi.org/10.5194/nhess-
Burn, D. H. and Whitfield, P. H.: Changes in floods and flood 9-523-2009, 2009.
regimes in Canada, Can. Water Resour. J., 41, 139–150, INAC: Nunavut, Canada’s Third Territory North of 60, Indig. North.
https://doi.org/10.1080/07011784.2015.1026844, 2016. Aff. Can., Ottawa, ON, available at: https://www.aadnc-aandc.
Canada: Federal Floodplain Mapping Framework, Government of gc.ca/eng/1303138100962/1303138315347 (last access: 14 Au-
Canada, Ottawa ON, 2017. gust 2018), 2014.
de Loë, R.: Floodplain management in Canada: overview and Kellens, W., Vanneuville, W., Ooms, K., and De Maeyer, P.: Com-
prospects, Can. Geogr., 44, 322–439, 2000. municating flood risk to the public by cartography, in: The
de Loë, R. and Wojtanowski, D.: Associated benefits and costs of World’s Geo-Spatial Solutions, Proceedings of the 24th Interna-
the Canadian Flood Damage Reduction Program, Appl. Geogr., tional Cartographic Conference, 15–21 November 2009, Santi-
21, 1–21, 2001. ago, Chile, 1–11, 2009.
de Moel, H., van Alphen, J., and Aerts, J. C. J. H.: Flood Keller, M., Rojanasakul, M., Ingold, D., Flavelle, C.,
maps in Europe: methods, availability and use, Nat. Hazards and Harris, B.: FEMA’s faulty flood maps put home-
Earth Syst. Sci., 9, 289–301, https://doi.org/10.5194/nhess-9- owners at risk, Bloomberg.com, available at: https:
289-2009, 2009. //www.bloomberg.com/graphics/2017-fema-faulty-flood-maps/
Dransch, D., Rotzoll, H., and Poser, K.: The contribution of maps to (last access: 30 July 2018), 2017.
the challenges of risk communication to the public, Int. J. Digit. Kjellgren, S.: Exploring local risk managers’ use of flood
Earth, 3, 292–311, https://doi.org/10.1080/17538941003774668, hazard maps for risk communication purposes in Baden-
2010. Württemberg, Nat. Hazards Earth Syst. Sci., 13, 1857–1872,
EA: Flood and coastal risk management risk mapping strat- https://doi.org/10.5194/nhess-13-1857-2013, 2013.
egy 2010–2015, UK Environment Agency, Almondsbury, Kovacs, P. and Sandink, D.: Best practices for reducing the risk of
Bristol, available at: https://assets.publishing.service.gov. future damage to homes from riverine and urban flooding, Insti-
uk/government/uploads/system/uploads/attachment_data/file/ tute for Catastrophic Loss Reduction, Toronto, 2013.
292950/geho0310bsbs-e-e.pdf (last access: 10 August 2018), Kumar, A., Burton, I., and Etkin, D.: Managing flood hazard and
2010. risk: report of an independent expert panel, Minister of Public
ECCC: Flood Damage Reduction Program, Environ. Clim. Change Works and Government Services, Ottawa, 2001.
Can., Ottawa, ON, available at: http://ec.gc.ca/eau-water/default. Kundzewicz, Z. W., Kanae, S., Seneviratne, S. I., Hand-
asp?lang=En&n=0365F5C2-1#Section3 (last access: 9 Au- mer, J., Nicholls, N., Peduzzi, P., Mechler, R., Bouwer,
gust 2018), 2013. L. M., Arnell, N., Mach, K., Muir-Wood, R., Braken-
EU Environment: Handbook on good practices for flood mapping ridge, G. R., Kron, W., Benito, G., Honda, Y., Takahashi,
in Europe, European Commission, Brussels, Belgium, available K., and Sherstyukov, B.: Flood risk and climate change:
at: http://ec.europa.eu/environment/water/flood_risk/flood_atlas/ global and regional perspectives, Hydrolog. Sci. J., 59, 1–28,
pdf/handbook_goodpractice.pdf (last access: 6 June 2018), 2007. https://doi.org/10.1080/02626667.2013.857411, 2014.
EXCIMAP: Handbook on good practices for flood mapping in Eu-
rope, European Commission, Brussels, Belgium, 2007.
Nat. Hazards Earth Syst. Sci., 19, 313–323, 2019 www.nat-hazards-earth-syst-sci.net/19/313/2019/D. Henstra et al.: Communicating disaster risk? An evaluation of the availability and quality of flood maps 323 Luke, A., Sanders, B. F., Goodrich, K. A., Feldman, D. L., Reid, R.: What to do about Canada’s out- Boudreau, D., Eguiarte, A., Serrano, K., Reyes, A., Schubert, J. dated flood maps, Can. Insur., available at: E., AghaKouchak, A., Basolo, V., and Matthew, R. A.: Going http://www.citopbroker.com/magazine-archives/ beyond the flood insurance rate map: insights from flood haz- what-to-do-about-canadas-outdated-flood-maps-7357 (last ard map co-production, Nat. Hazards Earth Syst. Sci., 18, 1097– access: 16 May 2016), 2014. 1120, https://doi.org/10.5194/nhess-18-1097-2018, 2018. Sayers, P., Yuanyuan, L., Galloway, G., Penning-Rowsell, E., Fuxin, Marco, J. B.: Flood risk mapping, in: Coping with floods, edited by: S., Kang, W., Yiwei, C., and Le Quesne, T.: Flood risk manage- Rossi, G., Harmancioğlu, N., and Yevjevich, V., Springer Nether- ment: a strategic approach, UNESCO, New York, USA, 2013. lands, Dordrecht, 353–373, 1994. Seipel, S. and Lim, N. J.: Color map design for visualization in Merz, B., Thieken, A. H., and Gocht, M.: Flood risk mapping at the flood risk assessment, Int. J. Geogr. Inf. Sci., 31, 2286–2309, local scale: concepts and challenges, in: Flood risk management https://doi.org/10.1080/13658816.2017.1349318, 2017. in Europe, edited by: Begum, S., Stive, M. J. F., and Hall, J. W., Stevens, M. R. and Hanschka, S.: Municipal flood hazard mapping: Springer Netherlands, Dordrecht, 231–251, 2007. the case of British Columbia, Canada, Nat. Hazards, 73, 907– Meyer, V., Kuhlicke, C., Luther, J., Fuchs, S., Priest, S., Dorner, W., 932, 2014. Serrhini, K., Pardoe, J., McCarthy, S., Seidel, J., Palka, G., Un- Thaler, T., Zischg, A., Keiler, M., and Fuchs, S.: Alloca- nerstall, H., Viavattene, C., and Scheuer, S.: Recommendations tion of risk and benefits: distributional justices in moun- for the user-specific enhancement of flood maps, Nat. Hazards tain hazard management, Reg. Environ. Change, 18, 353–365, Earth Syst. Sci., 12, 1701–1716, https://doi.org/10.5194/nhess- https://doi.org/10.1007/s10113-017-1229-y, 2018. 12-1701-2012, 2012. Thistlethwaite, J., Henstra, D., Brown, C., and Scott, D.: How flood Minano, A. and Peddle, S.: Using flood maps for community flood experience and risk perception influences protective actions and risk communication, Report prepared for Natural Resources behaviours among Canadian homeowners, Environ. Manage., 61, Canada, Partners for Action, Waterloo, ON, 2018. 197–208, https://doi.org/10.1007/s00267-017-0969-2, 2018. MMM Group Limited: National Floodplain Mapping Assessment: Tucker, C.: Floods in Canada: An Emergency Preparedness Canada Final Report, Public Safety Canada, Ottawa, ON, 2014. perspective, Environments, 28, 75–87, 2000. Nones, M.: Flood hazard maps in the European context, Water Int., UNISDR: What is Disaster Risk Reduction?, United Nations In- 42, 324–332, https://doi.org/10.1080/02508060.2016.1269282, ternational Strategy for Disaster Reduction, Geneva, available 2017. at: https://www.unisdr.org/who-we-are/what-is-drr, last access: Page, G. A.: The Canadian Flood Damage Reduction Pro- 4 June 2018. gram, Disasters, 4, 411–421, https://doi.org/10.1111/j.1467- United Nations: Sendai Framework for Disaster Risk Reduc- 7717.1980.tb00134.x, 1980. tion 2015–2030, United Nations International Strategy for Dis- Paine, J. D. and Watt, W. E.: Flood risk mapping in Canada: aster Reduction, Geneva, available at: http://www.unisdr.org/ compatible mapping, Can. Water Resour. J., 17, 139–148, files/43291_sendaiframeworkfordrren.pdf (last access: 18 Jan- https://doi.org/10.4296/cwrj1702139, 1992. uary 2016), 2015. Porter, J. and Demeritt, D.: Flood risk management, mapping, and Van Alphen, J., Martini, F., Loat, R., Slomp, R., and Passchier, R.: planning: the institutional politics of decision support in Eng- Flood risk mapping in Europe: experiences and best practices, J. land, Environ. Plan. A, 44, 2359–2378, 2012. Flood Risk Manage., 2, 285–292, https://doi.org/10.1111/j.1753- Public Safety Canada: The Canadian Disaster Database, avail- 318X.2009.01045.x, 2009. able at: http://www.publicsafety.gc.ca/cnt/rsrcs/cndn-dsstr-dtbs/ Van Kerkvoorde, M., Kellens, W., Verfaillie, E., and Ooms, index-eng.aspx (last access: 4 May 2016), 2015. K.: Evaluation of web maps for the communication of flood Public Safety Canada: National Disaster Mitigation Pro- risks to the public in Europe, Int. J. Cartogr., 4, 49–64, gram, available at: https://www.publicsafety.gc.ca/cnt/ https://doi.org/10.1080/23729333.2017.1371411, 2018. mrgnc-mngmnt/dsstr-prvntn-mtgtn/ndmp/index-en.aspx, last Vitousek, S., Barnard, P. L., Fletcher, C. H., Frazer, N., Erikson, access: 6 June 2017. L., and Storlazzi, C. D.: Doubling of coastal flooding frequency Public Safety Canada: Federal support for 30 British Columbia within decades due to sea-level rise, Nat. Sci. Rep., 7, 1399, flood mitigation projects, available at: https://www.canada. https://doi.org/10.1038/s41598-017-01362-7, 2017. ca/en/public-safety-canada/news/2018/02/federal_support_ Watt, W. E.: The National Flood Damage Reduction Program: for30britishcolumbiafloodmitigationprojects.html (last access: 1976–1995, Can. Water Resour. J., 20, 237–247, 1995. 25 July 2018), 2018a. Winsemius, H. C., Aerts, J. C. J. H., van Beek, L. P. H., Bierkens, Public Safety Canada: Government of Canada funds flood mit- M. F. P., Bouwman, A., Jongman, B., Kwadijk, J. C. J., Ligtvoet, igation project in Ontario, available at: https://www.canada. W., Lucas, P. L., van Vuuren, D. P., and Ward, P. J.: Global ca/en/public-safety-canada/news/2018/02/government_of_ drivers of future river flood risk, Nat. Clim. Change, 6, 381–385, canadafundsfloodmitigationprojectinontario.html (last access: https://doi.org/10.1038/nclimate2893, 2016. 25 July 2018), 2018b. Public Safety Canada: Governments of Canada and New Brunswick announce funding for flood mitigation projects, available at: https://www.canada.ca/en/public-safety- canada/news/2018/06/governments-of-canada (last access: 25 July 2018), 2018c. www.nat-hazards-earth-syst-sci.net/19/313/2019/ Nat. Hazards Earth Syst. Sci., 19, 313–323, 2019
You can also read