Communities and Testing for COVID-19 - IZA DP No. 14012 JANUARY 2021 Steven Stillman Mirco Tonin - Institute of ...
←
→
Page content transcription
If your browser does not render page correctly, please read the page content below
DISCUSSION PAPER SERIES

IZA DP No. 14012

Communities and Testing for COVID-19

Steven Stillman
Mirco Tonin

JANUARY 2021
DISCUSSION PAPER SERIES

IZA DP No. 14012

Communities and Testing for COVID-19

Steven Stillman
Free University of Bozen-Bolzano and IZA
Mirco Tonin
Free University of Bozen-Bolzano and IZA

JANUARY 2021

Any opinions expressed in this paper are those of the author(s) and not those of IZA. Research published in this series may
include views on policy, but IZA takes no institutional policy positions. The IZA research network is committed to the IZA
Guiding Principles of Research Integrity.
The IZA Institute of Labor Economics is an independent economic research institute that conducts research in labor economics
and offers evidence-based policy advice on labor market issues. Supported by the Deutsche Post Foundation, IZA runs the
world’s largest network of economists, whose research aims to provide answers to the global labor market challenges of our
time. Our key objective is to build bridges between academic research, policymakers and society.
IZA Discussion Papers often represent preliminary work and are circulated to encourage discussion. Citation of such a paper
should account for its provisional character. A revised version may be available directly from the author.

                                                     ISSN: 2365-9793

                                           IZA – Institute of Labor Economics
Schaumburg-Lippe-Straße 5–9                      Phone: +49-228-3894-0
53113 Bonn, Germany                             Email: publications@iza.org                                    www.iza.org
IZA DP No. 14012 JANUARY 2021
ABSTRACT
Communities and Testing for COVID-19*
Between November 18th and 25th, 2020, 348,810 out of 500,607 (69.7 percent) eligible
residents of the South Tyrol region of Italy volunteered to take a Covid-19 rapid antigen test.
We examine the community characteristics that are associated with higher testing rates.
Our findings point to a number of key community determinants of people’s willingness to
volunteer. Convenience was an important factor. Beyond that, socioeconomic status and
religiosity were also both positively related to greater testing.
JEL Classification: I12, I18
Keywords: COVID-19, testing, volunteer, religion
Corresponding author:
Mirco Tonin
Faculty of Economics and Management
Free University of Bozen-Bolzano
Piazza Università 1
39100 Bolzano
Italy
E-mail: mirco.tonin@unibz.it
* We would like to thank Alexia Lochmann for helpful research assistantship. Conflicts of interest: none.1. Introduction
During the Covid-19 pandemic, people are asked to take action to protect themselves and
others from infection. Wearing masks, for instance, can provide protection to the wearers, as
well as reduce outward transmission by infected individuals, therefore providing protection
for others (Asadi et al., 2020; Prather et al., 2020). The same will be true regarding
vaccination, as the benefits to individuals are combined with benefits to others through
community (herd) immunity. Despite the dramatic consequences of Covid-19, however, it
cannot be taken for granted that people are keen to undertake these beneficial actions1.
In this article, we look at participation in a voluntary mass testing scheme implemented in
the Italian region of South-Tyrol between November 18th and 25th, 2020, where 348,810 out
of 500,607 (69.7 percent) eligible residents were administered a Covid-19 rapid antigen test.
3,448 tested positive. Testing delivers great benefits to others, in particular for the population
of asymptomatic that we consider here, and we examine the community characteristics that
are associated with higher testing rates. The willingness to contribute to such public goods
is indeed related not only to individual characteristics, but also to social factors. The concept
of social capital is often used to capture these factors (Ostrom, 2009; Putnam, 2001) and there
have been several investigations about the social determinants of behavior in the pandemic,
usually focusing on social distancing (Jay et al., 2020; Kapitány-Fövény and Sulyok, 2020;
Bargain and Aminjonov, 2020; Barrios et al., 2021; Brodeur et al., 2020; Durante et al., 2020).
Population-scale testing has been proposed as an effective measure to control the pandemic
(Taipale et al., 2020) and has already been implemented in several contexts, for instance in
the Chinese regions of Wuhan and Qingdao and in Slovakia (Holt, 2020). Slovakia, in
particular, tested over 3.6 million people — out of a population of almost 5.5 million —and,
similarly to South-Tyrol, found that over 1% of them were positive2. Differently from the case
studied here, however, non-participants were required to quarantine for ten days, thus
providing a strong incentive to participate. While similar incentives could be used also for
1 See on mask-wearing: https://news.gallup.com/poll/315590/americans-face-mask-usage-varies-
greatly-demographics.aspx and on vaccination: https://news.gallup.com/poll/325208/americans-
willing-Covid-vaccine.aspx
2 https://www.nature.com/articles/d41587-020-00021-z
2vaccination, they may prove controversial, and it is therefore of great interest to study a
context where participation was fully voluntary.
Previous work has found that parochialism, i.e., a preference for favoring the members of
one’s ethnic, racial or language group, is an important factor behind altruistic behavior
(Bernhard et al., 2006). From this point of view, an interesting feature of South-Tyrol is the
presence of different linguistic groups: German (around 69% of the population), Italian
(around 26%), and Ladin (around 5%)3, with a conflictual relationship solved by granting
special autonomy to the territory in the early 1970s (Niezing, 2017). For this reason, we
explore the role of linguistic diversity, as well as of other characteristics that have been
identified in the literature as relevant for contributions to public goods, like gender and
education, as well as proxies for social capital and religiosity, and other relevant variables
like age, household size, employment, and past prevalence of the infection. In the discussion
section, we highlight how our findings relate to the existing literature.
2. The Mass Test in South Tyrol
The population of South Tyrol was invited to take part in a mass screening using antigen
rapid tests, involving a nasal and throat swab. To enable this, authorities set up around 300
testing centers, with each municipality having at least one, where professional health care
workers carried out the tests, with the support of volunteers from the civil protection agency,
the voluntary fire services and other organizations for handling the logistics and the
administration. All residents were invited to participate, with the exception of children below
the age of five, people with Covid-19 symptoms, those on sick leave, those who had tested
positive and isolated in the last three months, and those who had recently tested positive or
were in quarantine or self-isolating. People with a prior appointment for a PCR test, those
regularly tested for work reasons, and individuals in social care were also not tested.
Testing centers generally operated from 8am till 6pm from Friday, 20 November to Sunday,
22 November. During this period, people could show up at any of the centers throughout
South Tyrol. In some municipalities it was possible to register online and some municipalities
published suggested centers and time slots based on the address of residence. It was also
3Notice that everyone is classified within these three linguistic groups, despite the growing presence
of migrants who do not necessarily belong to neither and of bilingual people.
3possible to be tested in some pharmacies and at some GPs in the period 18 to 25 November.
People only needed a valid ID and a European Health Insurance card. They filled in a form
with an email address, where they would receive, generally within a day, an encrypted file
with the outcome, and a mobile number, where they would receive an SMS with the code to
open the file.
In case of a negative result, people were advised to continue following prevention measures
like social distancing and mask wearing. In case of a positive result, people had to isolate for
10 days if asymptomatic and contact their doctor if they developed symptoms.
Participation in the mass testing was voluntary and encouraged by a massive communication
campaign, providing information (with material available also in Albania, Arabic, English,
French and Urdu, as well as in simple language for kids), as well as endorsements by public
figures. The headline of the campaign was “Together against coronavirus”, using appeals like
“Let’s break the infection wave together and pave the way towards a gradual return to
normality!”, thus underlining the importance of common action.
3. Data and Methodology
Data about testing come from the Health Authority4, while data about municipality
characteristics come from the Provincial Statistical Office, ASTAT5, or the National
Statistical Office, ISTAT6.
Tested individuals are matched by the authorities to their municipality of residence based on
their tax identification number and the total number of residents in each municipality is
measured using official registration data.7 We define the population eligible for testing as all
residents of a municipality age five or higher that are not currently in quarantine either
because they have recently tested positive for Covid-19 or have been in close contact with
someone that has. The testing rate is then measured as the number of residents of a
municipality who volunteered to be tested between November 18th and 25th divided by the
population eligible for testing in that municipality. The past Covid positive rate is similarly
4 https://coronatest.asdaa.it/it/muni (Italian) or https://coronatest.asdaa.it/de/muni (German)
5 https://astat.provincia.bz.it/it/banche-dati-comunali.asp
6 http://asc.istat.it/ASC/
7 In Italy, all individuals are legally required to register in their municipality of residency and local
services, such as education and health care, are only available to those that are registered.
4calculated as the number of residents in a municipality who previously tested positive but
are not currently positive divided by the total number of residents.
Age, gender, employment, immigration status and household size are measured in
administrative data and made available at the municipality level. We can also calculate the
standard deviation of age within a municipality using the available data. The proportion of
individuals with secondary education and higher, and the proportion speaking the three
official languages of the region and of volunteers at non-profits are measured using the 2011
Census.
For education and language spoken, we calculate the within municipality variation using the
#
Herfindahl-Hirschman index (HHI) which is calculated as: HHIj = ∑$!%& "!" where Snj is the
share of individuals living in municipality j who have characteristic n=1, 2, …, k. In this case,
the share of individuals who speak i) German; ii) Italian; and iii) Ladin; and the share with
i) no education; ii) an intermediate degree; iii) a secondary degree; and iv) an university
degree. Finally, we measure, as a proxy for religiosity, the proportion of religious weddings
over total weddings celebrated in a given municipality between 1995 and 2019.
In our analysis, we run an OLS regression model of the form:
#" = & + ()" + *"
where Yj is the testing rate in municipality j, Xj is a vector of municipality characteristics and
εj is a mean zero error term. In all our models, we calculate robust standard errors that allow
for heteroscedasticity. Since the outcome variable is a rate bounded between zero and one,
our estimated β coefficients can be interpreted as the percentage point impact on the testing
rate of a one unit differences in the corresponding covariate.
We estimate two specifications where we vary how we control for the language distribution
in the municipality. First, we control for the percentage of residents speaking each of the
official languages. Second, we control for the spoken language diversity in the municipality
as measured by the HHI.
We also estimate three versions of each specification. In the first one, each municipality is
given equal weight and hence given an equal importance in estimating the relationship
between X and Y. In the second one, the model is estimated using weighted-GLS and the
importance of each municipality is determined by its registered population. Here, more
5populated municipalities are more important in determining the relationship between X and
Y. The final specification is similar to the second one, but we drop the five municipalities with
population above 15,000, thus having a more homogeneous sample.
4. Results
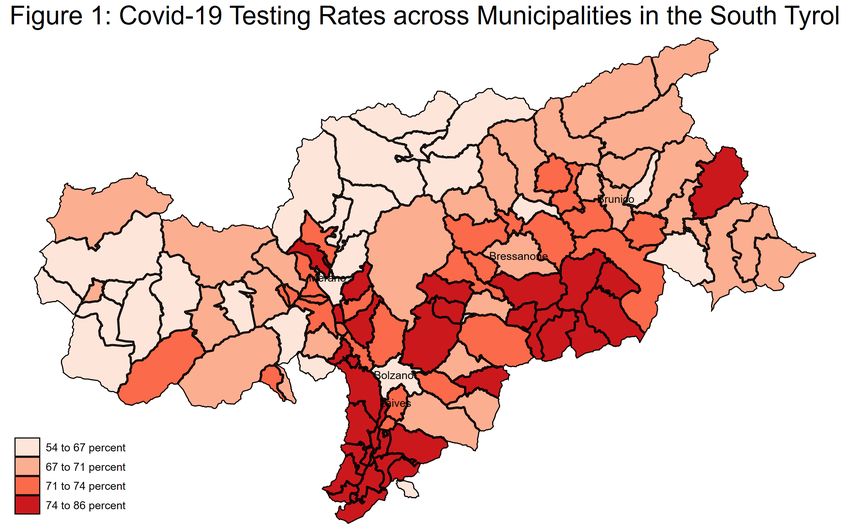
Figure 1 shows the variation in testing rates across the 116 municipalities of the South Tyrol,
while Table 1 shows the distribution across the municipalities. Testing rates varied between
54.2 and 85.9% with the interquartile range 67.5 to 74.5%. Around 71% of eligible individuals
volunteered to be tested in the median municipality. While we are interested in how
community characteristics relate to testing rates, there is a large variation in the population
of different municipalities (from 200 in the smallest to 108,606 in the largest), hence we also
examine how testing rates vary when we weight municipalities by their population. While
the most populated municipalities have relatively low testing rates, our weighted estimates
look fairly similar with a median testing rate of 68.9% and an interquartile range of 67.0 to
72.2%. We also present weighted estimates where we drop five municipalities that have a
population greater than 15,000.8 The weighted distribution of test rates is nearly identical in
this sample to the unweighted distribution across all municipalities.
Table 2 presents the mean and standard deviation for all municipality characteristics that
we consider in our analysis. On average, municipalities have 4,630 residents and the average
population density is 125 inhabitants per KMs^2. On average, there were three testing
centers per municipality, and previously 1.2 percent of population had tested positive for
Covid-19. On average, residents are aged 42, gender balanced, living in a household with 2.5
members. 53% of residents are employed, 41% have secondary education or higher, 6.8% are
immigrants, and 83.7% speak German, 9.5% speak Italian and 6.9% speak Ladin as their
principal language. On average, 48% of weddings performed recently in each municipality
were religious ceremonies and 48% of the population volunteered at a non-profit organization.
We also examine the importance of heterogeneity within municipalities on three dimensions,
age, education and language spoken. The standard deviation of age within communities, is
8This drops the four ‘cities’ of the South Tyrol, i.e. Bolzano-Bozen, Merano-Meran, Brixen-Bressanone
and Bruneck-Brunico, and what can be considered the largest suburb of Bolzano, Laives-Leifers.
623.5 on average, while the HHI for education is 0.31 and for language spoken 0.86, on
average.
Weighting for population size, the average municipality is much larger with 30,230 residents,
a density of 657 inhabitants per KMs^2, with fifteen testing centers. Perhaps surprisingly,
most other characteristics of the residents are fairly similar. The main exceptions are that
residents of larger areas are more educated, more likely to be immigrants, and more likely to
be Italian speakers. In these areas, weddings are less likely to be religious and the primary
language is more diverse (between Italian, German and Ladin). When the larger
municipalities are dropped, the characteristics of the weighted sample are nearly identical to
those of the unweighted sample in all dimensions.
Table 3 presents our main results. We will focus our discussion on the characteristics of
municipalities that are associated with the community testing rate at a minimum 10 percent
significance threshold, but also mention some other interesting relationships. We first
discuss the results treating all municipalities with equal weighting. Controlling for
population density and the number of testing centers, testing rates are lower in more
populated municipalities, but the effect size is fairly small with an additional 1,000 people
associated with 0.6-0.7 percentage point (pp) lower testing rates. On the other hand, having
more testing centers is correlated with higher testing rates, with each additional center
associated with 0.7-1.0 pp higher testing rates.
Testing rates are higher in municipalities with an older population, less age variation, more
women, larger households and a more educated population. Testing rates are also higher in
municipalities with a higher proportion of religious weddings, with communities with a 10
pp higher proportion of religious weddings having 1.1-1.4 pp higher testing rate. Finally,
municipalities with a larger share of individuals speaking the two minority languages in the
region (Italian and Ladin) or those with more diversity in language spoken have higher
testing rates. One interesting, albeit not statistically significant, finding is that testing rates
are lower in municipalities with higher previous positive Covid-19 rates.
Our main results are remarkably similar if we weight each municipality by its population.
The only substantive differences we find are for the population variables. Now, both the
negative relationship between population and testing rates and the positive relationship
7between number of testing centers and testing rates are both about half their size as in the
unweighted estimates. The same is true if we exclude the larger municipalities, now neither
population nor number of testing centers is statistically significantly associated with testing
rates, but population density has a positive association with municipalities with an
additional 100 people per KMs^2 having 1.8-1.9 pp higher testing rates.
5. Discussion
Our findings point to a number of key community determinants of people’s willingness to
volunteer for the Covid mass testing program in the South Tyrol.
First, it is clear that convenience was an important factor; after controlling for population
and population density, individuals were more likely to get tested in communities where
there were more centers.
Second, communities where the population is older, more educated and living in larger
households had higher testing rates, consistent with a positive relationship between
socioeconomic status and willingness to contribute to public goods. The finding on age could
also be related to the increased risk of hospitalization or deaths associated with age9.
Similarly, the finding for household size could occur because large households have increased
social contacts and hence are at higher risk10.
Third, we find higher testing rates in communities with a higher female share, consistent
with a vast literature showing gender differences in preferences, including altruism (Croson
and Gneezy, 2009; Falk and Hermle, 2018).
Fourth, we find that more religious communities – proxied by share of religious weddings –
have higher testing rates consistent with the literature showing religious rituals being
associated with higher degrees of cooperation (Ruffle and Sosis, 2007) and, more generally,
showing the link between religiosity and civic responsibility (Monsma, 2007).
Fifth, we find some weak evidence that social cohesion is related to testing rates, with
communities with higher dispersion in terms of age having lower testing rates. However, we
9https://www.cdc.gov/coronavirus/2019-ncov/need-extra-precautions/older-adults.html
10Supporting this, we also find higher testing rates in communities with more employed people, but
this is not usually statistically significant.
8do not find a significant relationship between educational diversity, immigration share or
volunteering rates, which are arguably other proxies of social cohesion, and testing rates.
Finally, we find higher testing rates in municipalities with a higher share of speakers of
Italian and Ladin. Given their status as languages spoken by a minority of the population at
the provincial level, these localities also have more linguistic diversity, and therefore a lower
HH index. Higher linguistic diversity is thus associated with increased participation. This
result may be related to the fact that, among Italian regions, South-Tyrol has by far the
lowest vaccination coverage11, an issue mostly related to the German speaking population
(Kreidl and Morosetti, 2003) and this diffidence may spillover towards the tests. The minority
populations might have preferences more aligned with the rest of Italy or have worried about
negative spillovers from potential lower testing rates among the German-speaking majority.
Interesting, we found an insignificant relationship between the past Covid positive rates in
a community and the current testing rates. One could have expected a positive effect of higher
previous contagion, on the contrary the insignificant coefficient is consistently negative.
While we focus on a mass testing campaign, we suspect that similar patterns would reveal
themselves for vaccination uptake. Hence, these results can be useful for helping guide
policies designed to increase vaccine uptake, for example, by making it more convenient,
encouraging people to think about the importance of protecting other people and focusing
extra resources on lower socioeconomic status communities.
However, an important limitation of our study is that we can only measure the role of
community characteristics and it is possible that this hides important heterogeneity across
individuals. Beyond this, because individuals typically sort into communities with people
with similar characteristics, the correlation between community characteristics and the
measured outcome might be stronger at the community than individual level. Furthermore,
we can only measure a subset of community characteristics that are related to testing rates
and hence we might have not accounted for important unobservable characteristics that could
bias the relationships that we currently estimate.
11https://www.epicentro.iss.it/vaccini/dati_Ita. South Tyrol is also the region with the lowest usage of
antibiotics (Osservatorio Nazionale sull’impiego dei Medicinali, 2019).
9This notwithstanding, our results can be helpful in identifying communities particularly at
risk of not adhering to voluntary programs to fight the pandemic, in our case mass tests, but
in prospect also vaccination campaigns.
10Bibliography
Asadi, S., Cappa, C.D., Barreda, S. et al. Efficacy of masks and face coverings in controlling
outward aerosol particle emission from expiratory activities. Sci Rep 10, 15665 (2020).
https://doi.org/10.1038/s41598-020-72798-7
Bargain, O., and Aminjonov, U. (2020). Trust and Compliance to Public Health Policies in
Times of Covid-19. https://www.iza.org/publications/dp/13205/trust-and-compliance-to-
public-health-policies-in-times-of-Covid-19
Barrios, J. M., Benmelech E., Hochberg Y. V., Sapienza, P. and Zingales, L. (2021). Civic
capital and social distancing during the Covid-19 pandemic. Journal of Public Economics,
vol 193.
Bernhard, H., Fischbacher, U. and Fehr, E. Parochial altruism in humans. Nature 442,
912–915 (2006). https://doi.org/10.1038/nature04981
Brodeur, A., Grigoryeva, I., and Kattan, L. (2020). Stay-At-Home Orders, Social Distancing and
Trust. https://www.iza.org/publications/dp/13234/stay-at-home-orders-social-distancing-and-
trust
Croson, R. and Gneezy, U., 2009. Gender differences in preferences. Journal of Economic
literature, 47(2), pp. 448-74.
Durante, R., Guiso, L., and Gulino, G. (2020). Asocial Capital: Civic Culture and Social
Distancing during Covid-19. https://papers.ssrn.com/sol3/papers.cfm?abstract_id=3611606
Falk, A. and Hermle, J., 2018. Relationship of gender differences in preferences to economic
development and gender equality. Science, 362(6412).
Prather, K. A., Chia C. Wang, Robert T. Schooley, Reducing transmission of SARS-CoV-2,
Science 26 Jun 2020: https://doi.org/1422-1424 10.1126/science.abc6197
Holt, E. (2020). Slovakia to test all adults for SARS-CoV-2. The Lancet, 396(10260), 1386-
1387. https://doi.org/10.1016/S0140-6736(20)32261-3
Jay, J., Bor, J., Nsoesie, E.O. et al. Neighbourhood income and physical distancing during
the Covid-19 pandemic in the United States. Nat Hum Behav (2020).
https://doi.org/10.1038/s41562-020-00998-2
Kapitány-Fövény, M., Sulyok, M. Social markers of a pandemic: modeling the association
between cultural norms and Covid-19 spread data. Humanit Soc Sci Commun 7, 97 (2020).
https://doi.org/10.1057/s41599-020-00590-z
Kreidl, P. and Morosetti, G., 2003. Müssen wir in naher Zukunft mit einer Masernepidemie
in Südtirol rechnen?. Wiener Klinische Wochenschrift, 115, pp.55-60.
11Jussi Taipale, Paul Romer, Sten Linnarsson, Population-scale testing can suppress the
spread of Covid-19 medRxiv 2020.04.27.20078329; doi:
https://doi.org/10.1101/2020.04.27.20078329
Moran KR, Del Valle SY (2016) A Meta-Analysis of the Association between Gender and
Protective Behaviors in Response to Respiratory Epidemics and Pandemics. PLoS ONE
11(10):e0164541. https://doi.org/10.1371/journal.pone.0164541
Monsma, S.V., 2007. Religion and philanthropic giving and volunteering: Building blocks
for civic responsibility. Interdisciplinary Journal of Research on Religion, 3.
Niezing, J., 2017. South Tyrol: A minority conflict of the twentieth century. Routledge.
Osservatorio Nazionale sull’impiego dei Medicinali. L’uso degli antibiotici in Italia.
Rapporto Nazionale 2017. Roma: Agenzia Italiana del Farmaco, 2019.
Ostrom, E. (2009). What is social capital. In: Bartkus, V. O., & Davis, J. H. (Eds.). (2010).
Social capital: Reaching out, reaching in. Edward Elgar Publishing.
Putnam, R., 2001. Social capital: Measurement and consequences. Canadian journal of policy
research, 2(1), pp.41-51.
Ruffle, B.J. and Sosis, R., 2007. Does it pay to pray? Costly ritual and cooperation. The BE
Journal of Economic Analysis & Policy, 7(1).
12Table 1: Testing Rates Across Municipalities
Weighted by Population -
Weighted by Total
Unweighted Dropping Municipalities
Population
>15K Population
Mean 0,711 0,697 0,711
Standard Deviation 0,059 0,045 0,051
1st Percentile 0,552 0,621 0,576
5th Percentile 0,621 0,637 0,633
10th Percentile 0,638 0,651 0,638
25th Percentile 0,675 0,670 0,677
50th Percentile 0,712 0,689 0,715
75th Percentile 0,745 0,722 0,745
90th Percentile 0,782 0,757 0,775
95th Percentile 0,816 0,781 0,793
99th Percentile 0,847 0,826 0,840
Municipalities 116 116 111
Testing rates are the share population excluding those currently positive or in quarantine.
14Table 2: Summary of Municipality Characteristics
Weighted by Population -
Unweighted Weighted by Population Dropping Municipalities
>15K
Population/1000 4,63 30,23 4,72
(10,9) (41,1) (3,4)
Population Density 0,125 0,657 0,106
(1000 per KM^2) (0,254) (0,825) (0,097)
Number of Testing
Centers 3,0 15,1 2,7
(5,3) (21,5) (1,0)
Past COVID Positive Rate 0,012 0,013 0,011
(0,009) (0,006) (0,007)
Mean Age 41,6 42,5 41,5
(1,3) (1,6) (1,1)
Standard Deviation Age 23,5 23,7 23,5
(0,4) (0,4) (0,4)
Share Female 0,495 0,505 0,498
(0,015) (0,012) (0,010)
Mean Household Size 2,46 2,34 2,44
(0,16) (0,18) (0,14)
Employment Rate 0,533 0,536 0,539
(0,055) (0,040) (0,049)
Share Higher Education 0,407 0,440 0,412
(0,058) (0,054) (0,051)
HHI - Education 0,306 0,293 0,303
(0,013) (0,015) (0,010)
Share Immigrant 0,068 0,097 0,071
(0,041) (0,045) (0,033)
Share Speaking German 0,837 0,680 0,854
(0,265) (0,315) (0,239)
Share Speaking Italian 0,094 0,277 0,082
(0,149) (0,292) (0,113)
Share Speaking Ladin 0,069 0,042 0,064
(0,233) (0,175) (0,221)
HHI - Language Spoken 0,859 0,755 0,858
(0,137) (0,166) (0,124)
Share Religious Weddings 0,480 0,404 0,474
(0,135) (0,128) (0,112)
Share Volunteering 0,477 0,441 0,420
(0,227) (0,184) (0,166)
Municipalities 116 116 111
Standard deviations in parentheses. Share variables are as a proportion of the total or adult population in a municipality.
Table 3: The Relationship Between Community Characteristics and COVID-19 Testing Rates
15Weighted by Population - Dropping
Unweighted Weighted by Population
Municipalities >15K Population
Population/1000 -0.00616** -0.00680*** -0.00265** -0.00349*** -0.00187 -0.00265
(0.00252) (0.00231) (0.00120) (0.00122) (0.00229) (0.00222)
Population Density 0.0655 0.0610 -0.0317* -0.0201 0.181** 0.193**
(1000 per KM^2) (0.0516) (0.0480) (0.0172) (0.0179) (0.0785) (0.0773)
Number of Testing Centers 0.00726* 0.00955*** 0.00410** 0.00613*** 0.00468 0.00641
(0.00390) (0.00352) (0.00182) (0.00187) (0.00608) (0.00629)
Past COVID Positive Rate -0.908 -1.052 -0.501 -0.658 -0.484 -0.651
(0.692) (0.702) (0.567) (0.581) (0.506) (0.515)
Mean Age 0.0162** 0.0194*** 0.0171** 0.0208*** 0.0237*** 0.0261***
(0.00688) (0.00723) (0.00691) (0.00726) (0.00688) (0.00715)
Standard Deviation Age -0.0336** -0.0358** -0.0162 -0.0218 -0.0228 -0.0250*
(0.0152) (0.0153) (0.0146) (0.0151) (0.0140) (0.0142)
Share Female 1.289*** 1.473*** 1.391*** 1.618*** 1.063** 1.276**
(0.420) (0.399) (0.520) (0.531) (0.519) (0.530)
Mean Household Size 0.175*** 0.237*** 0.129** 0.199*** 0.230*** 0.285***
(0.0657) (0.0661) (0.0630) (0.0654) (0.0681) (0.0672)
Employment Rate 0.135 0.0601 0.166* 0.0843 0.179* 0.0815
(0.102) (0.102) (0.0970) (0.101) (0.0997) (0.105)
Share Higher Education 0.381*** 0.361*** 0.389*** 0.355*** 0.281** 0.256**
(0.0996) (0.108) (0.105) (0.117) (0.114) (0.119)
HHI - Education 0.225 0.243 0.439 0.565 0.634 0.577
(0.562) (0.579) (0.452) (0.453) (0.531) (0.532)
Share Immigrant 0.147 0.0859 0.0850 0.0267 0.255 0.236
(0.174) (0.184) (0.170) (0.181) (0.181) (0.183)
Share Speaking Italian 0.101** 0.0802*** 0.0653
(0.0449) (0.0265) (0.0563)
Share Speaking Ladin 0.0680*** 0.0640*** 0.0625***
(0.0211) (0.0213) (0.0216)
HHI - Language Spoken -0.150*** -0.129*** -0.0819
(0.0564) (0.0463) (0.0591)
Share Religious Weddings 0.109*** 0.137*** 0.127*** 0.158*** 0.125*** 0.158***
(0.0381) (0.0382) (0.0392) (0.0386) (0.0416) (0.0398)
Share Volunteering 0.00154 -0.0164 -0.0267 -0.0407 -0.0245 -0.0321
(0.0273) (0.0252) (0.0324) (0.0303) (0.0336) (0.0331)
R-squared 0.505 0.478 0.555 0.531 0.516 0.484
Municipalities 116 116 116 116 111 111
Note: *** pYou can also read