Community Development Corporations and Neighborhood Stability in Hartford and New Haven, Connecticut - Trinity College
←
→
Page content transcription
If your browser does not render page correctly, please read the page content below
Community Development Corporations and
Neighborhood Stability in Hartford and New
Haven, Connecticut

SEPTEMBER 2020

BY GABRIELL NELSON
PROGRAM COORDINATOR, THE CENTER FOR URBAN AND GLOBAL STUDIES,
TRINITY COLLEGE, HARTFORD, CT
Submitted to Professor Sean Fitzpatrick in partial fulfillment of the requirements for the degree
of Master of Arts in Public Policy

                                                                                                    1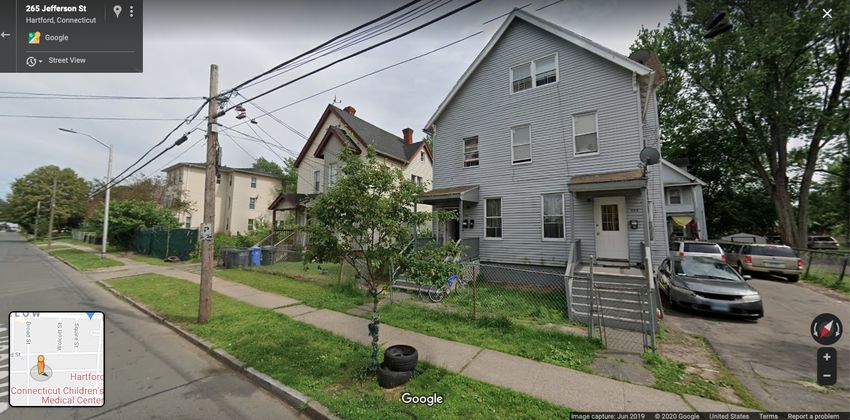
Table of Contents

     1. Executive Summary……………………………………………………………...……3
     2. Overview of the Community Development Corporations………………………..…...7
     3. Research Methods……………………………………………………………………10
           a. Sufficiently Spatially Concentrated Investment…………………………..…15
     4. Discussion of Findings………………………………………………………………17
           a. The Comparative Advantage of Hartford and New Haven
                  and the role of CDCs in Building on the Cities’ Strengths ………...……20
           b. Nation and State Level Data…………………………………………………22
           c. Hartford Property Values……………………………………………………24
           d. New Haven Property Values………………………………………………...37
           e. Hartford Owner Occupancy and Vacancy…………………………………...41
           f. New Haven Owner Occupancy and Vacancy……………………………….44
     5. Conclusion and Suggestions for Future Research…………………………………...45

Acknowledgements

Much gratitude to Professor Sean Fitzpatrick for serving as my advisor for this project. Thank
you to Jonathan Cabral and Andrew Bolger at CHFA for their advice and support. Thanks to
David Lukens for his research advice. I appreciate the time Stephen Cremin-Endes and Adam
Rawlings at NHS, Ken Jonshon at NINA, and Dean Iaiennaro at SINA took to talk with me
about their programs and observations. Thanks also to Matin Yaqubi and Davarian Baldwin who
assisted me with the literature review on New Haven. Finally, I am grateful for Garth Myers and
Xiangming Chen, who have been incredible supervisors and mentors to me at the Center for
Urban and Global Studies.

                                                                                              2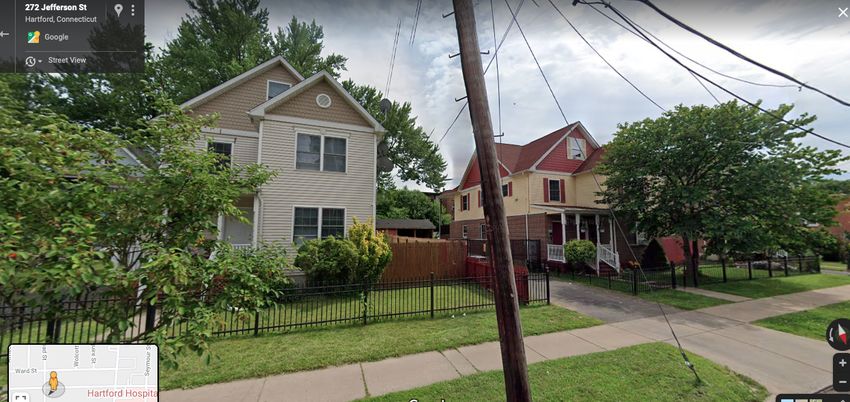
1. EXECUTIVE SUMMARY

    Neighborhood stability can be measured in a number of ways. The Center for Community
Progress defines neighborhood stability as the “physical, economic or social features of the
neighborhood that are associated with the preservation and potential increase in the value of a
property-owner’s investment in a neighborhood.”1 Destabilizing forces in a neighborhood
include crime, vacant properties, and low resident confidence in the neighborhood. A stable
neighborhood is not one that does not change, but one where residents can expect a high quality
of life to be maintained. A stable neighborhood has streets that are safe and clean, homes that are
well maintained, and landscaping that is kept in good condition. For urban neighborhoods with
an older housing stock, a high proportion of renters, and owners with insufficient capital (or
motivation) to maintain their housing units, these features of a stable neighborhood are often
missing.

    Community Development Corporations (CDCs) are not-for profit, community-based
organizations formed to provide investment capital and other support to neighborhoods suffering
disinvestment and related challenges.2 Among other things, CDCs can “fill the gap” in financial
capital available for housing revitalization in areas not adequately served by the private market,
providing and/or assembling public and philanthropic funding for housing construction and
rehabilitation. The hope is that targeted CDC investments will encourage other homeowners and
rental property owners in the area to invest in their properties and thus catalyze broader
improvement in the neighborhood’s quality of life.

    This study investigated the effects of CDC housing revitalization programs in Hartford and
New Haven, CT on neighborhood stability.3 Using a combination of quantitative and qualitative
data, this study sought to connect the observed impacts in Hartford and New Haven with the
literature on revitalization in formerly industrial cities. Data on three key indicators of

1
  https://www.communityprogress.net/increasing-neighborhood-stability-pages-240.php
2
  https://community-wealth.org/strategies/panel/cdcs/index.html
3
  The three CDCs studied were Southside Institutions Neighborhood Alliance (SINA) and Northside Institutions
Neighborhood Alliance (NINA) in Hartford and Neighborhood Housing Services (NHS) in New Haven. See page 8
for more details on the CDCs studied.

                                                                                                           3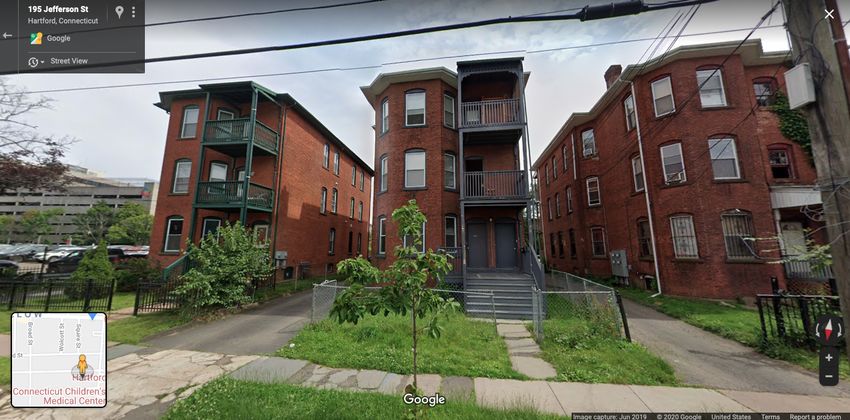
neighborhood stability (property values, owner occupancy rates, and vacancy rates) were
collected for the time period spanning 2000 to 2019. Street conditions were observed by a
Google Street View “windshield survey” of the CDC focus areas; conditions were observed in
2011 and again in 2019 using the time capsule feature on Google Street View.4 The collected and
observed data were contextualized through informal interviews with housing program leaders at
each of the CDCs.

    Based on the data examined, this study supports four conclusions. First, when viewed in the
context of the literature on urban decline, and specifically decline in formerly industrial cities (or
“legacy cities”), it became clear that Hartford and New Haven possess advantages over most
other legacy cities in their efforts to spur neighborhood improvement. Second, those working in
CDCs to improve homeownership opportunities in Connecticut cities need to rethink the
methods, goals, and measures of homeownership programs as the data indicates little impact
from such programs on homeownership levels, as opposed to broader indicia of neighborhood
improvement. Third, the impact of housing revitalization on property values and street conditions
depends significantly on the neighborhood context, specifically the property values in
surrounding neighborhoods. Fourth, investments in housing revitalization by CDCs and other
community-focused programs must be spatially targeted and sufficiently concentrated to produce
measurable results.

    a. Advantages of Hartford and New Haven

    Discussions of the “Rust Belt” cities of the Northeastern and Midwestern United States are
commonplace in the urban studies literature, with Detroit as the quintessential example. Hartford
and New Haven are often lumped into the declining Rust Belt city narrative. Alan Mallach’s
2018 book The Divided City provides a detailed account of the landscape of the legacy city,
Mallach’s term for the older, formerly industrial cities. There are, however, key differences
between Hartford and New Haven and other Rust Belt cities. For one, there is significant wealth

4
 A windshield survey is a survey method whereby a researcher observes a neighborhood from a moving vehicle.
Google Street View is a tool offered by Google where images captured by cameras on Google vehicles are compiled
on Google Maps. This tool provides the ability to study streets anywhere in the world from a computer and also
provides the ability to compare street conditions over time using the time capsule feature.

                                                                                                              4
surrounding Hartford and New Haven. Not only are these cities surrounded by affluent suburbs,
Connecticut is also one of the richest states in the country. Hartford and New Haven are also
geographically small compared with most other legacy cities. Because cities in New England did
not generally annex surrounding towns in the 19th and early 20th centuries as many cities did
elsewhere in the United States, the boundaries of Hartford and New Haven have not changed in
centuries. While this creates challenges in maintaining an adequate property tax base to fund
urban services, it has the advantage of concentrating the impact of public and philanthropic
investment in housing improvement. Hartford and New Haven also both have neighborhoods
that are stable or even thriving, further reducing the geographic area that requires investment
from government, non-profit, or other entities to promote stabilization of the neighborhoods.

      These facts paint a relatively hopeful picture for Hartford and New Haven, but are also a call
to action. We in Connecticut cannot point to their status as declining industrial cities as an
excuse for a deteriorating housing stock within two of the state’s flagship cities. The scale of
urban decline in Connecticut is relatively small, there is capital within the state to address urban
decline, and there are still thriving industries in Hartford and New Haven. This is not to say that
the problem of a declining housing stock and distressed neighborhoods in Hartford and New
Haven is a simple one to solve, but that it is a worthwhile project to pursue. Improving the
quality of life in Connecticut’s urban neighborhoods is an attainable goal.

      b. Rethinking Homeownership Methods, Goals, and Measures

      Increasing homeownership is an important goal of all three CDCs examined in this study.
Owner occupancy did increase in CDC-targeted areas at a rate faster than each city overall (or, in
most cases, decreased at a slower rate than each city overall) in two out of the three CDC focus
area census tracts in Hartford and two out of the five CDC focus area census tracts in New
Haven. Where there were homeownership gains, however, they were very slight. Overall, the
CDCs were unable to demonstrate measurable improvements in owner occupancy rates. Given
the broad dip in homeownership after the 2008 housing crash, CDCs faced an uphill battle to
fight in increasing owner occupancy rates over the study period of 2000 to 2019.5 It may be that

5
    United States Census, data access via Social Explorer

                                                                                                       5
there were too many forces working against increasing owner occupancy over this time period,
but this finding raises questions regarding the efficacy of CDCs’ current approaches to
increasing owner occupancy in urban neighborhoods.

   c. The Impact of Housing Revitalization on Property Values and Street Conditions
       Depends on the Neighborhood Context

   After examining median home sales values for the years 2001, 2010, and 2019, this study
concluded that the property value and street conditions changes that can be expected as a result
of CDC housing revitalization projects depend on the neighborhood context, specifically the
property values in surrounding neighborhoods. The table below summarizes the hypothesized
impacts of housing revitalization in different neighborhood contexts. Section 3 of this report, the
discussion of findings, goes into more detail about this finding in the context of Hartford and
New Haven.
 Surrounding Property            Þ Outcome of CDC Housing               Outcomes of CDC
 Values                            Revitalization Projects on           Housing Revitalization
                                   Property Values                      Projects on Street
                                                                        Conditions
 High/Low Property Value         Þ CDC focus area sees property         CDC focus area likely to
 Increases: A CDC Focus            value increases lower than the       see noticeable
 Area with low property            surrounding area                     improvement in street
 values located near a                                                  conditions and visible
 neighborhood with high                                                 spillover effects of
 property value increases.                                              housing projects on
                                                                        nearby houses
 Moderately Strong Property      Þ CDC focus area sees property         CDC focus area likely to
 Value Increases:                  value increases in line with         see noticeable
 A CDC Focus Area                  surrounding area                     improvement in street
 surrounded by a                                                        conditions and visible
 neighborhood with                                                      spillover effects of
 moderately strong property                                             housing projects on
 value increases                                                        nearby houses
 Low Property Values             Þ CDC focus area sees property         CDC focus area less
 Increases:                        value increases greater than         likely to see noticeable
 A CDC Focus Area                  the surrounding area                 improvement in street
 surrounded by a                                                        conditions and visible
 neighborhood with low                                                  spillover effects of
 property value increases                                               housing projects on
                                                                        nearby houses

                                                                                                   6
d. Investments in Housing Must Be Spatially Concentrated in Order to Produce Results
        at the Neighborhood Level

        CDC investments in housing must be spatially concentrated in order to produce results at
    the neighborhood level. This means that a CDC cannot renovate one or two houses on a
    block and expect to see the entire block change. The findings of this study indicate that,
    especially in the most distressed neighborhoods, a CDC must rehabilitate a significant
    portion of the housing stock in order to see measurable results at the neighborhood level.
    This finding is in line with the findings of a previous study of the impact of community
    development block grants (CDBG) focused on housing, which found that CDBG spending
    must be sufficiently spatially targeted in order to see measurable results. 6

        Rehabilitating a few houses on a block may benefit the families who live in those newly
    improved residences, but it is unlikely to have an impact on the stability of the street or
    neighborhood as a whole. This study used census tracts as the unit of measurement for
    neighborhoods. Three percent was set as the threshold for the amount of housing that must be
    rehabilitated in a census tract in order for it to be plausible that the housing rehabilitation
    efforts had a measurable impact at the neighborhood level. More information on the methods
    for determining sufficient spatial targeting and the three percent threshold are discussed in
    the research methods section of this paper.

    2. OVERVIEW OF THE COMMUNITY DEVELOPMENT CORPORATIONS
        STUDIED

    Community development corporations (CDCs) are key actors in bringing investment to urban
neighborhoods that have experienced capital flight and physical decline (i.e., have been
“disinvested’). CDCs are non-profit organizations that work to improve the neighborhoods they

6
 Galster, G., Walker, C., Hayes, C., Boxall, P., & Johnson, J. (2004). Measuring the impact of Community
Development Block Grant spending on urban neighborhoods. Housing Policy Debate, 15(4), 903–934.
https://doi.org/10.1080/10511482.2004.9521526

                                                                                                           7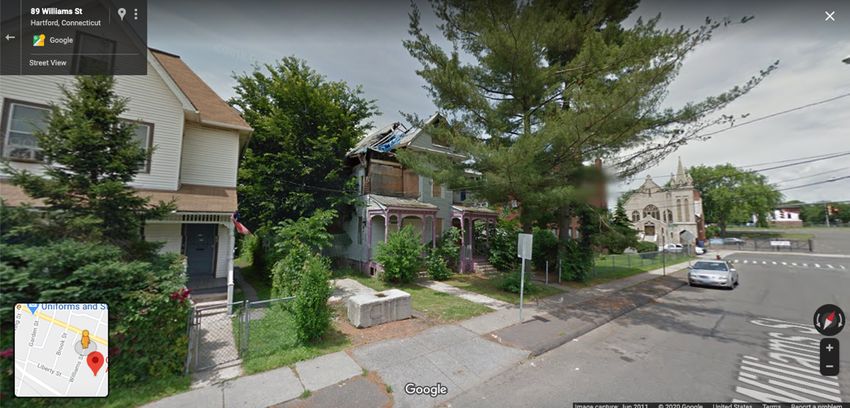
are based in. CDCs bring leadership, long-term commitment, and local knowledge to property
development. This strengthens real estate development efforts and makes them more effective at
stabilizing neighborhoods. CDC-led revitalization has been noted to have many tangible benefits,
including lower tax delinquency among homeowners who purchase homes from CDCs.7 In
order for CDC projects to improve an entire neighborhood, however, the hope is that CDC
housing investments will create a domino effect in the area.

    The three CDCs studied were the Southside Institutions Neighborhood Alliance (SINA) and
Northside Institutions Neighborhood Alliance (NINA) in Hartford, and Neighborhood Housing
Services (NHS) in New Haven. Each of these CDCs engages in the building (SINA’s focus) or
rehabilitation (NINA and NHS’s focus) of homes in urban neighborhoods. While SINA and
NINA focus on the neighborhoods adjacent to their anchor institution sponsors, the work of NHS
is spread across low-income neighborhoods throughout the city of New Haven. NHS has
rehabilitated the most homes out of the three CDCs, with nearly three hundred homes renovated
since 1979.

    Much of the housing stock in many of Hartford and New Haven’s neighborhoods requires
significant repairs. Many homes require so much investment in repairs that a homebuyer who
purchases the home and makes all necessary repairs will have put more money into the house
than it is worth. CDCs solve this problem through “gap financing,” i.e., the use of public
funding, private grants, and other targeted capital (such as low-income housing or historic
preservation tax credits) to fill the gap between the sale price of the home and the price to
acquire and rehabilitate the home. SINA, for example, spends an average of $350,000 to build a
new two-family home and then sells the home for between $260,000 and $270,000. Their
funding streams fill the $80,000-$90,000 “gap” between the selling price and the amount spent to
build the home. 8 Dean Iaiennaro, Director of Real Estate Development at SINA, reports that the
homes are of better quality than can be found on the private market in the area. The homes are

7
  Yasuyuki Fujii. Spotlight on the Main Actors: How Land Banks and Community Development Corporations
Stabilize and Revitalize Cleveland Neighborhoods in the Aftermath of the Foreclosure Crisis. Housing Policy
Debate. P. 296-315. Volume 26, Issue 2. 2016.
8
  Iaiennaro, Dean. Personal Conversation with the author. March 2020.

                                                                                                              8
Energy Star certified, have efficient furnaces, and are so well insulated that homeowners will not
hear any street noise.9

    CDC           City            Year       Focus Area      Number of    Institutional      Programs
                                  Founded                    Homes        Partners
                                                             Completed*
    SINA          Hartford, CT    1977       South           61           Trinity College,   Cityscape
                                             Central                      Hartford           Homes (home
                                             Hartford                     Hospital,          building
                                                                          Connecticut        program),
                                                                          Children’s         Cityscape
                                                                          Medical Center     Apartments,
                                                                                             Homeownership
                                                                                             Incentive
                                                                                             Program (HIP),
                                                                                             Walk to Work,
                                                                                             Education &
                                                                                             Health,
                                                                                             Community
                                                                                             Strengthening
                                                                                             (neighborhood
                                                                                             cleaning,
                                                                                             service awards,
                                                                                             volunteer
                                                                                             programs)
    NINA          Hartford, CT    2004       North           24           The Hartford,      Home
                                             Central                      Aetna, St.         rehabilitation,
                                             Hartford                     Francis            Homeownership
                                                                          Hospital,          Incentive
                                                                          Webster Bank       Program (HIP),
                                                                                             Asylum Hill
                                                                                             Walking Tours
    NHS           New Haven,      1979       Several         290          N/A                Home
                  CT                         Clusters                                        rehabilitation,
                                             Across City                                     homeowner
                                                                                             education,
                                                                                             garden and rain
                                                                                             garden
                                                                                             installation and
                                                                                             maintenance,
                                                                                             volunteer
                                                                                             programs, non-
                                                                                             profit real estate
                                                                                             services through
                                                                                             HOC realty
*Number of structures, not number of units

9
    Iaiennaro, Dean, Conversation with the author (March 2020).

                                                                                                                  9
3. RESEARCH METHODS

   a. A Note on Correlation and Causation

       Measuring the potential stabilizing effects of CDCs is difficult given the multiplicity of
factors affecting the real estate market in urban neighborhoods. This paper discusses the
correlation between changes in indicators in neighborhood stability in census tracts in Hartford
and New Haven, but does not seek to prove any causal relationship between CDC projects in
these neighborhoods and the changes observed.

   b. Qualitative Methods

       This study sought to combine quantitative data on median home sales values, owner
occupancy rates, and vacancy rates with qualitative data from street conditions observed by a
digital windshield survey and gathered from interviews with those working on housing
revitalization projects within the CDCs. The windshield survey was conducted using Google
Street View. A sampling of streets in each of the CDC focus area census tracts (FACTs) was
observed as captured by Google in 2011 and 2019. Street conditions, including the presence of
litter, landscaping, and graffiti, and home conditions, including visible deferred maintenance,
visible home improvements, and overall appearance of homes were reviewed. The focus of the
windshield survey was on observing noticeable changes on the streets between the Street View in
2011 and 2019. Special note was taken of positive changes on the street between 2011 and 2019,
such as improved landscaping, home improvements on structures adjacent to CDC projects, and
whether the CDC project homes were upkept.

c. Census Tract Selection

       This study used census tracts as the measuring unit for neighborhoods. Census tracts
provide a reliable, universal unit of measure for neighborhood-level data, but they are sometimes
drawn in ways that include both wealthy and poor areas or that do not the local understanding of
neighborhood boundaries. They are also sometimes not small enough to capture the changes

                                                                                                    10
effected by CDC housing investments. Nevertheless, because of their universality and the
relative ease of acquiring data at the census tract level, census tracts were chosen as the unit of
analysis for neighborhoods. Census tracts were selected based on the areas in which the three
CDCs work in Hartford and New Haven. In addition to the CDC focus areas, additional tracts
were selected to provide comparison cases.
SINA housing programs include its home building and renovation program, called
“Cityscape Homes,” and a homeownership incentive program (HIP) it administers for employees
of their three partner institutions (Hartford Hospital, Connecticut Children’s Medical Center, and
Trinity College). Between Cityscape Homes and the HIP program, SINA’s projects touch nearly
all of the South Side of Hartford. Census tracts where either program was active, even if just one
home was bought through the HIP program, were selected for this study. The exception is census
tract 5025, where one HIP home was sold. It is located in the South Meadows neighborhood of
Hartford, a mostly a commercial and industrial area with few residential properties. Because it is
not a primarily residential area, it was excluded from the study.
NINA’s primary program is its home renovation program, though it occasionally builds
new homes in Asylum Hill as well. NINA, like SINA, administers a HIP program. Twenty-two
HIP grants have been awarded to employees from The Hartford, Saint Francis, and Aetna
through NINA. The Hartford HIP grants were available for homes purchased throughout the city,
Saint Francis grants were available for homes in the Asylum Hill and Blue Hills neighborhoods,
and Aetna grants were available for Asylum Hill and Frog Hollow.10 Most of the neighborhoods
that NINA’s HIP covers were included in this study, with the exception of the Blue Hills
neighborhood, located in northwestern Hartford, which is a relatively stable middle class
neighborhood and therefore not facing significant disinvestment. The vast majority of NINA’s
work has been focused in census tract 5246. NINA has renovated a handful of homes in census
tracts 5031 and 5033, so those tracts were included as well for comparison purposes. To provide
further comparisons in the north central part of Hartford, several census tracts surrounding
census tract 5426 were selected.
10
Johnson, Ken. Via personal email communication. August 21, 2020.
11Census tracts in New Haven were selected based on the areas in which NHS has
renovated homes. This selection of census tracts represents a wide range of New Haven
neighborhoods, since NHS has worked in a majority of New Haven’s neighborhoods.
The home building and renovation programs of the three CDCs, along with the homes
sold through SINA’s HIP program, were also mapped with a census tract map layer to determine
how many homes in each census tract received CDC investment.11 This map aided in
determining which census tracts may have had a sufficient level of CDC investment to plausibly
account for changes seen at the census tract level.
d. Tables
Hartford Investments by SINA and NINA by Census Tract
Number Homes Built
Neighborhood Investment Type Number of HIP or Rehabilitated
SINA Home build/rev &
5027 Barry Square HIP 3 33
SINA Home build/rev &
5028 Frog Hollow HIP 1 28
5246 Asylum Hill NINA Home build/rev 0 20
5033 Asylum Hill NINA Home build/rev 0 2
5031 Asylum Hill NINA Home build/rev 0 2
5026 Barry Square SINA HIP 3 0
Behind the
5049 Rocks SINA HIP 1 0
Behind the
5045 Rocks SINA HIP 3 0
5048 South West SINA HIP 11 0
5247 South West SINA HIP 4 0
5003 Barry Square SINA HIP 1 0
5002 Barry Square SINA HIP 1 0
5024 South End SINA HIP 2 0
5023 South End SINA HIP 2 0
5043 Parkville SINA HIP 1 0
5042 West End Comparison case
5245.02 West End Comparison case
5017 Clay Arsenal Comparison case
5035 Upper Albany Comparison case
11
View the map at:
https://www.google.com/maps/d/edit?mid=1SoLFfpPhEpt16qz0GoCSbmBhukUB1v2U&usp=sharing
12New Haven Investment by NHS by Census Tract 12
Number of
Homes Built
or
Census Tract Neighborhood Rehabilitated
1403 The Hill 4
1404 City Point 10
1405 The Hill 8
1406 Dwight 11
1407 Dwight 32
1408 West River 25
1409 Edgewood 16
1410 Westville 1
1413 West Rock 3
1414 Beaver Hills 46
1415 Newhallville 41
1416 Dixwell 24
1418 Newhallville 11
1420 Downtown 1
1423 Fair Haven 3
1424 East Rock/Fair Haven 6
1425 Fair Haven 3
1542 West Haven 1
1655 3
e. Sufficiently Spatially Concentrated Investment
Previous studies of investment in distressed neighborhoods makes clear that spatial
concentration of investment is needed to see change on a neighborhood level.13 This means that
12
NHS reports that they have renovated slightly fewer than 300 homes. Adding up the totals here results in a total of
249 renovated homes. This discrepancy is due to multiple housing units being listed under a single address in some
cases. For example, in some instances, four townhomes were renovated on one street, and listed on one address line.
This study is using the number of structures renovated, rather than the number of units, and therefore a row of four
townhomes was counted here as one structure.
13
Galster, G., Walker, C., Hayes, C., Boxall, P., & Johnson, J. (2004). Measuring the impact of Community
Development Block Grant spending on urban neighborhoods. Housing Policy Debate, 15(4), 903–934.
https://doi.org/10.1080/10511482.2004.9521526
13organizations like CDCs that invest in urban neighborhoods must complete a sufficient number
of projects within a limited geographic area in order for those projects to materially impact the
surrounding neighborhood. For example, if a CDC renovates one home in a one square mile
neighborhood, it is unlikely to create any measurable impacts on the neighborhood level. If a
CDC renovates twenty homes in a one square mile area, however, it is more likely that positive
impacts will be visible at the neighborhood level.
The census tracts studied generally contain between 1,000 and 2,000 housing units.
Conceptually, one would not expect that a homeownership incentive program that has sold one,
two, three, or four homes in a given census tract would make a big difference on the
neighborhood conditions in across tract. One could reasonably expect, however, that if the sixty
most blighted homes and lots in that neighborhood were transformed into the sixty best homes in
that neighborhood, broader positive impacts would be observed.
For example, in southern Hartford, census tract 5027 contains 292 structures.14 In census
tract 5027, SINA has built or renovated 33 homes (many of them two-family homes). One would
intuitively expect that building or renovating 33 homes in a neighborhood with approximately
292 residential structures could impact the neighborhood’s stability, since these homes make up
more than 10% of the neighborhood.
Such common sense observations can guide us to areas where CDC investments have
been sufficiently spatially targeted to be expected to correlate with broader improvements in
neighborhood stability. These approximations do not tell us whether a CDC’s spatial
14
This number was arrived at through the following calculation. Census tract 5027 had 1,338 occupied housing
units in 2018. Of those units that were rented (roughly 87% of the units), 10.2% were 1-family units, 27.3% were 2-
4 family units, and 62.5% were 5+ family units.
1338 times .102= 136.48
1338 times .273= 365.27 divided by 3 = 121.76
1338 times .625= 167.25 divided by 5 = 33.45
Total approximate structures = 291.69
This is a low-end estimate of the number of residential structures in the neighborhood, since some buildings have far
more than five units, but helps to provide a rough estimate to lay out the conceptual framework to determine
sufficient spatial targeting.
14concentration of investment is sufficient to meet its specific goals for neighborhood stabilization
and improvement, but rather provides a “reality check” in considering whether changes seen at
the census tract level can reasonably be attributed to investments made by the CDC.
This method of assessing spatial concentration indicates that the SINA projects constitute
more than 10% of the housing units in census tracts 5027 and 5028. This model further estimates
that the NINA projects constitute approximately 5.7% of the housing units in census tract 5246.
Accordingly, although it cannot be demonstrated as scientific certainty on the basis of this study,
it seems reasonably to conclude that the SINA and NINA projects in those neighborhoods are
sufficiently spatially concentrated to produce census tract-wide impacts.
By contrast, NHS projects are spread out across New Haven. There are only two census
tracts where their projects constitute more than 5% of the housing structures in the
neighborhood- tracts 1408 and 1414. Census tracts 1407, 1415, and 1416 had more than 3% of
the housing rehabbed by NHS, and will also be included as NHS focus areas. All other census
tracts with NHS projects had less than 3% of their housing renovated by NHS. The census tracts
that constitute CDC focus areas will be starred on the data tables that follow for readability.
4. DISCUSSION OF FINDINGS
For the purposes of this study, three census tracts in Hartford and five census tracts in New
Haven were designated as “CDC focus areas” based on the investment activities of the CDCs.
The CDC focus area census tracts (“FACTs”) had at least 3% of their housing structures
rehabilitated by a CDC. The methods for determining the FACTs are discussed in greater detail
in the methods section of this paper. The following was found to be true of property values,
owner occupancy rates, and vacancy rates in the FACTs compared to the cities overall:
• Property values increased at a faster rate than the city overall in three out of three CDC
FACTs in Hartford and one out of five FACTs in New Haven.
15• Owner occupancy increased at a rate faster than the city overall (or decreased at a slower
rate than the city overall) in two out of three FACTs in Hartford and two out of five
FACTs in New Haven.
• Vacancy decreased at a faster rate than the city overall in none of three FACTs in
Hartford and two out of five FACTs in New Haven.
Comparing FACT performance to the cities overall is useful to understand the comparative
strength of neighborhoods. However, in order to determine whether CDC investment raised
property values above what they would have been absent CDC intervention, it is necessary to
compare FACTs to adjacent neighborhoods. This provides for a more granular comparison
between the FACT and nearby areas in the city than a citywide comparison allows. This is
particularly helpful in Hartford, where property values are relatively stagnant in the southern part
of the city and increasing at a comparatively fast rate in the central and northern central parts of
the city. FACTs were determined to have seen property values increases greater than they would
have absent CDC intervention based on how their property value increases compared with their
surrounding area. The SINA FACTs are hypothesized to have seen property values higher than
they would have without CDC intervention because the FACTs saw property value increases that
were higher than the rest of southern Hartford. In contrast, NINA’s FACT saw property value
increases in line with or less than the increases in surrounding census tracts, which makes it more
difficult to determine whether NINA’s investments spurred greater increases in property values.
neighborhoods across the city of Hartford are seeing property value increases for a variety of
reasons, including home renovations led by CDCs, school renovations, and other reasons not
explored as part of this study.
New Haven is a very different real estate market from Hartford. While Hartford’s median
home sales value increased about 11% between 2001 and 2019, New Haven saw a nearly 50%
increase in median home sale value. Several factors likely account for this difference: New
Haven is less than a two-hour train ride away from one of the hottest job and real estate markets
in the world, New York City, and is home to one of the world’s top universities, Yale University.
New Haven is seeing very strong property value increases throughout the city. While property
values did increase at least as fast as the state of Connecticut overall in the census tracts with the
16highest number of NHS renovations, they increased at a slower rate than the city of New Haven
overall. This is likely because the FACTs in New Haven are in neighborhoods located in the
more distressed areas of the city, while other areas of the city are attracting higher-income
residents able to invest in and improve distressed properties.
The SINA FACTs show the greatest property value increases above what the area would
likely have seen absent CDC intervention when compared with the NINA and NHS focus areas.
The rest of southern Hartford saw lower property value increases than the SINA FACTs, which
supports the inference that SINA’s investments have, at a minimum, contributed to property
value improvements in its target areas. By contrast, it is difficult to infer that NINA and NHS
investments in their respective FACTs contributed to higher property value increases than would
have occurred absent CDC intervention in the face of strong property value increases in nearby
neighborhoods.
Notwithstanding, SINA’s postulated performance in generating higher property value
increases than surrounding neighborhoods’, the NINA and NHS FACTs showed more obvious
improvements in the quality of street conditions as compared with the SINA area.15 Based on the
windshield survey, immediate spillover effects to nearby homes were easier to locate in the
NINA and NHS FACTs than in SINA’s. Additionally, the NINA and NHS FACTs had better
street conditions at the neighborhood level than the SINA FACTs. This may indicate that CDCs
working in areas with overall strong real estate markets will be more effective at creating
positive outcomes in street conditions, such as landscaping, home maintenance, and streets free
of trash, while CDCs in areas with weaker real estate markets will be more effective at
increasing property values, but will have a harder time improving street conditions in the
neighborhood.
15
This finding generated the question of whether the SINA area had lower property values than the NINA and NHS
areas prior to 2000. To answer this question, property values for the FACTs were reviewed from 1980. The SINA
area property values were in line with or had greater property values than the NHS and NINA areas in 1980, with
the exception of one NHS tract that had higher property values than the SINA tracts. One hypothesis to explain the
lower level of street conditions improvement in the SINA area is that there has been little investment in the
neighborhood outside of SINA, while other organizations have contributed more to revitalization efforts in the
NINA and NHS areas.
17In New Haven, where a number of census tracts are seeing very high property values
increases, one would not expect that the distressed areas that NHS is working in would see
higher property value increases than the nearby skyrocketing areas. Rather, one would hope to
see moderate property value increases combined with increases in positive street conditions. In
an area like the SINA neighborhood, located in the southern part of Hartford, where there have
been low property value increases area-wide, one would hope that the CDC investments would
show higher property value increases than the surrounding area. North central Hartford,
surrounding the NINA focus area, has seen overall moderately strong property value increases.
Here, the CDC FACT is following the trend of the nearby neighborhood with moderately strong
property value increases. The findings of this study lead to the hypothesis that the following
results would be seen in different neighborhood contexts:
Surrounding Property Þ Outcome of CDC Housing Outcomes of CDC
Values Revitalization Projects on Housing Revitalization
Property Values Projects on Street
Conditions
High/Low Property Value Þ CDC focus area sees property CDC focus area likely to
Increases: A CDC Focus value increases lower than the see noticeable
Area with low property surrounding area improvement in street
values located near a conditions and visible
neighborhood with high spillover effects of
property value increases. housing projects on
nearby houses
Moderately Strong Property Þ CDC focus area sees property CDC focus area likely to
Value Increases: value increases in line with see noticeable
A CDC Focus Area surrounding area improvement in street
surrounded by a conditions and visible
neighborhood with spillover effects of
moderately strong property housing projects on
value increases nearby houses
Low Property Values Þ CDC focus area sees property CDC focus area less
Increases: value increases greater than likely to see noticeable
A CDC Focus Area the surrounding area improvement in street
surrounded by a conditions and visible
neighborhood with low spillover effects of
property value increases housing projects on
nearby houses
18A 2005 study by the Urban Institute (UI) examined five CDC target neighborhoods
across the United States.16 The study determined that two out of the five neighborhoods saw
property value increases above what they would have absent CDC intervention. The UI study in
combination with this study provide strong evidence that property values will not increase above
what they would have absent CDC intervention in all neighborhoods where CDCs work, even if
there are other effects from the work of the CDCs, such as improved street conditions.
a. The Comparative Advantage of Hartford and New Haven and the role of CDCs in
Building on the Cities’ Strengths
One might expect property values to be declining in many neighborhoods in formerly
industrial cities, or “legacy cities,” as Alan Mallach calls them in his book The Divided City,
with dwindling demand for housing over time in many of such cities’ neighborhoods.17 Hartford
and New Haven, however, saw property values increase at a rate at least as fast as the state of
Connecticut as a whole from 2000 to 2018, with certain neighborhoods increasing at rates far
higher than the state’s median home value increases by census tract. Property value increases in
Hartford and New Haven have been more the norm than the exception over the past two decades.
Both cities have the advantage of being located in Connecticut, one of the wealthiest states in
the country. They both have strong institutions, notably Yale University and Yale New Haven
Hospital in New Haven, and a thriving insurance industry, three major hospitals, and several
smaller institutions of higher education in Hartford, including Trinity College, the UConn
Hartford campus, and the University of Hartford. New Haven has had significant wealth brought
into the city by Yale University. Trinity College alum Jacob Miller described the impact of Yale
on housing in New Haven in an unpublished thesis, writing, “Since very early in New Haven’s
history, Yale’s faculty has been comprised of industry leaders and innovators in the fields of
science, politics, art, literature and economics. These members of the City created upscale
neighborhoods, resulting in the microcosmic suburban sections of neighborhoods like Westville
16
Mallach, Alan. The Divided City. Island Press. 2018. Page 193.
17
Ibid.
19and East Rock.”18 Hartford, for its part, became known as the “insurance capital of the world”
after insurance companies began establishing headquarters in the city in the early 19th century.19
Although Hartford has lost some white-collar jobs over the past half century, it still retains its
core industry of insurance. Four of the top six employers in the Hartford region are insurance
companies.20 Three of these four insurance companies- The Hartford, Travelers, and Aetna- are
located in central Hartford. In New Haven, Yale University is the largest employer,
demonstrating how both cities have retained their most important employers even as many other
comparably sized Northeast and Midwest cities lost the employers that anchored their regions.
Despite the strengths of these cities, they still have neighborhoods that struggle with low
owner occupancy rates and large numbers of houses with deferred maintenance. Both cities have
weak property tax bases, due in part to a high proportion of tax-exempt public and not-for-profit
landholdings, leading to poor street maintenance and underfunded social services. CDCs are
helping to build and encourage more attractive and affordable housing in these cities, helping to
alleviate the problem of a decaying housing stock. One study indicates that homes built or
renovated by CDCs are sold to owners who are unlikely to be tax delinquent, helping these cities
to strengthen their struggling tax bases.21 For example, Dean Iaiennaro reports that the houses
and apartments that SINA has built or improved generate about $500,000 per year in taxes for
the City of Hartford.22
The conditions for revival are present in both cities: they benefit from proximity to the
financial and commercial centers of New York City and Boston, have their original urban fabric
(i.e. houses are reasonably close together with numerous central, walkable shopping streets
scattered throughout the city) largely intact, and are surrounded by affluent suburbs with healthy
real estate markets.23 “Density, culture diversity and vitality, linking and intersecting the whole
gamut of urban activities within a fine-grained spatial matrix, are seen as the key to urban
18
Miller, Jacob. Subprime Disaster Capitalism in New Haven. American Studies Senior Thesis. Apirl 25, 2014.
19
https://connecticuthistory.org/aetna-helps-make-hartford-the-insurance-capital-of-the-world/
20
https://www.metrohartford.com/doing-business-in-hartford-ct/site-selection/largest-employers/
21
Yasuyuki Fujii. Spotlight on the Main Actors: How Land Banks and Community Development Corporations
Stabilize and Revitalize Cleveland Neighborhoods in the Aftermath of the Foreclosure Crisis. Housing Policy
Debate. P. 296-315. Volume 26, Issue 2. 2016.
22
Iaiennaro, Dean. Personal Conversation with the author. March 2020.
23
Mallach page 108-111.
20renaissance,” write Amin and Graham in their article The Ordinary City. 24 In a similar vein,
Mallach writes of the key elements needed for a city to revitalize, asserting that: “Cities need to
maintain their urban character—their density, their diversity of buildings, and people, and their
mixture of uses and activities—to thrive.” 25 Hartford and New Haven have largely maintained
their density despite industrial decline. Their low vacancy rates compared with other legacy
cities are evidence of retained residential density. More broadly, Connecticut is one of the
wealthiest states in the country and both cities lie surrounded by relatively wealthy suburban
areas—indicating a level of continuing economic vitality in the urban cores of Hartford and New
Haven.
Despite these assets, Hartford and New Haven still have struggling neighborhoods and suffer
from low owner occupancy rates. There are certainly numerous factors influencing the continued
distress of some neighborhoods in both cities, but the old and decaying housing stock is certainly
a deterrent for prospective buyers. Many homes in the neighborhoods are older, have only one
bathroom, are smaller than today’s buyers prefer, and require more investment in improvements
than their current market value will justify.26 This is where CDCs can make the difference. CDCs
have funding to fill the gap between the investment needed to rehabilitate a home and the home’s
worth. They build new homes that appeal to modern buyers or rehabilitate old homes with
modern, energy efficient finishes that will meet the needs of potential buyers. The decayed
housing stock is one of the larger obstacles in revitalizing these two Connecticut cities and the
CDC model may be a partial solution.27
24
Amin, Ash and Graham, Stephen. The Ordinary City. The Royal Geographical Society. February 17, 1997.
25
Mallach page 108.
26
Mallach page 7.
27
It should be noted that CDC funding streams often require the homes built and improved by CDC to have deed-
restrictions tied to income.
21b. Nation and State Level Data
The overall picture of property values and owner occupancy in the United States over the
past two decades provides important context for looking at property values and owner occupancy
in specific Connecticut neighborhoods. The following chart shows the median home value (in
2018 dollars) for the United States and the state of Connecticut from 2000 to 2018 and the owner
occupancy rate for both geographies.
Median Home Value Owner Occupancy
Change 00-
2000 2010 2018 18 2000 2010 2018 Change 00-18
CT $234,835 $342,215 $272,700 16.12% 66.80% 69.20% 66.30% -0.50%
USA $163,478 $217,448 $204,900 25.30% 66.20% 66.60% 63.90% -2.30%
Connecticut’s median home value was 43.64% higher than the country as a whole in
2000.28 Home values in the state and country bloated in the housing bubble of the mid-2000s.29
By 2018, home values in the United States had risen to 25.3% above their 2000 values, while
Connecticut’s home values increased to 16.12% above their 2000 values. Connecticut’s median
home value, though still higher than the United States as a whole, experienced stagnation
compared with the rest of the country in the years following the Great Recession. As the
foregoing table indicates, the percentage of owner occupants has decreased across in the United
States over the past two decades. Owner occupancy increased slightly during the housing bubble
and has decreased to below 2000 levels in Connecticut and the entire United States. This means
that fewer people own their home. Home ownership has become less accessible in the nation as a
whole, Connecticut included.
28
A home is defined as a structure, not a unit, for the purposes of this paper.
29
It is important to note that the 2010 American Community Survey (ACS) 5-year estimates were used to collect the
2010 data. The ACS 5-year estimates for 2010 are an average of the values between 2006 and 2010, thus the
numbers for 2010 encompass the most inflated years of the housing bubble.
22Connecticut Median Residential Sales Values, 2011-2020 30
c. Hartford Property Values
As part of this study, median home sales values, owner occupancy rates, vacancy rates, and
median household income were collected for the CDC focus areas and comparison areas. The
median home sales values were collected for the years 2001, 2010, and 2019. All other data was
collected for the years 2000, 2010, and 2018. This section goes into a detailed examination of
these numbers, as well as presents the results of a Google Street View windshield survey of
neighborhood conditions.
30
Data gathered by the Warren Group; access provided by the Connecticut Housing Finance Authority. Accessed
June 10, 2020.
23Map of Southern Hartford Census Tracts
Map of North-Central Hartford Census Tracts
24Median Home Sale Value for Residential Properties in Hartford, 2001-2019 31
Tract Neighborhood Sales Price 2001 Sales Price 2010 Sales Price 2019 % Change
5027* Barry Square $163,012.33 $191,481.60 $233,000.00 42.93%
5028* Frog Hollow $129,832.83 $57,093.14 $217,000.00 67.14%
5246* Asylum Hill $117,498.71 $43,566.46 $190,000.00 61.70%
5033 Asylum Hill $135,603.71 $189,724.89 $180,000.00 32.70%
5031± Asylum Hill $133,828.36 $161,031.93 $128,750.00 -3.79%
5026 Barry Square $192,260.78 $172,157.77 $229,500.00 19.37%
Behind the
5049 Rocks $137,045.76 $152,248.37 $147,500.00 7.63%
Behind the
5045 Rocks $145,701.28 $162,144.51 $152,000.00 4.32%
5048 South West $172,389.14 $174,500.05 $164,900.00 -4.34%
5247 South West $147,143.87 $155,761.79 $147,450.00 0.02%
5003± Barry Square $216,388.04 $244,485.43 $234,107.27 8.19%
5002 Barry Square $163,012.33 $125,897.69 $152,000.00 -6.76%
5024 South End $152,914.22 $178,540.49 $159,250.00 4.14%
5023 South End $178,880.78 $204,364.15 $179,900.00 0.06%
5043 Parkville $139,832.83 $132,924.53 $151,400.00 8.32%
5042 West End $238,026.85 $338,752.61 $387,000.00 62.59%
5245.02 West End $472,375.10 $638,272.00 $386,500.00 -18.18%
5017 Clay Arsenal $38,949.85 $96,619.16 $197,450.00 406.93%
5035 Upper Albany $115,406.96 $102,474.86 $201,500.00 74.60%
City of
Hartford $141,229.26 $140,536.95 $157,750.00 11.70%
± The median sales price listed for 2001 in census tract 5031 is actually from 2002. The 2010 median sales price in
census tract 5003 is actually from 2011. The 2019 median sales price in 5003 is actually from 2016. These were the
closest years available for those years in those census tracts.
All dollar amounts are in 2020 inflation adjusted dollars.
A * represents a CDC focus area census tract (FACT)
The SINA focus area, census tracts 5027 and 5028, is located in between its three partner
institutions, Hartford Hospital, Connecticut Children’s Medical Center, and Trinity College.
31
Data gathered by the Warren Group; access provided by the Connecticut Housing Finance Authority. Accessed
June 10, 2020.
25Property values increased in this area at a rate faster than the city overall and faster than the rest
of southern Hartford. Property values in census tract 5027 increased 42.93% and property values
in census tract 5028 increased 67.14%.
NINA’s home building and renovation activities occurred primarily in census tract 5246.
Census tract 5246 contains part or all of the campuses of its partners, The Hartford, Aetna, and
St. Francis Medical Center. This census tract showed strong increases in property values, with a
61.70% increase between 2000 and 2018. The CDC focus neighborhoods in Hartford all saw
property values much higher than the Hartford median property value increase of 11.70%. 32
33
Colors: (1) Dark Blue =
Distressed; (2) Light Blue = At
Risk; (3) Green =
Functioning; (4) Yellow =
Strong ((5) White =
Insufficient Data).
The SINA FACTs saw property values increase more than census tracts where SINA
administers its HIP program. The HIP census tracts cover most of the southern part of the city.
Interestingly, parts of the southern half of the city that are generally considered some of the most
stable neighborhoods in the city saw lower, or only slightly higher, average increases in property
values. The tracts with high owner occupancy (>50%) out of those studied include 5023, 5048,
and 5247. These three census tracts are located in the South West neighborhood and the South
End neighborhood. These areas are considered to be stable because of the high owner occupancy
rate, the generally attractive housing stock, and their possessing many streets pleasantly lined
32
https://www.chfa.org/about-us/county-profiles-dashboard/
33
Settlemyer, Laura. Presentation to Professor Sean Fitzpatrick’s Public Management Course. Trinity College.
October 22, 2019.
26with mature trees. In a 2019 market value analysis commissioned by the City of Hartford’s
Blight Remediation Team, the South West and South End neighborhoods were two of the four
neighborhoods in the city found to have either “functioning” or “strong” housing markets.34 In
two of the three high owner occupancy census tracts in southern Hartford, property values
increased at a slower rate than the city’s average. This shows that the areas that are considered
the most stable in Hartford are not the areas seeing the largest increases in home value in the
city. In fact, some of the areas that are seeing the largest increases in home value in the city are
located in areas classified as “distressed” on the 2019 market value analysis.
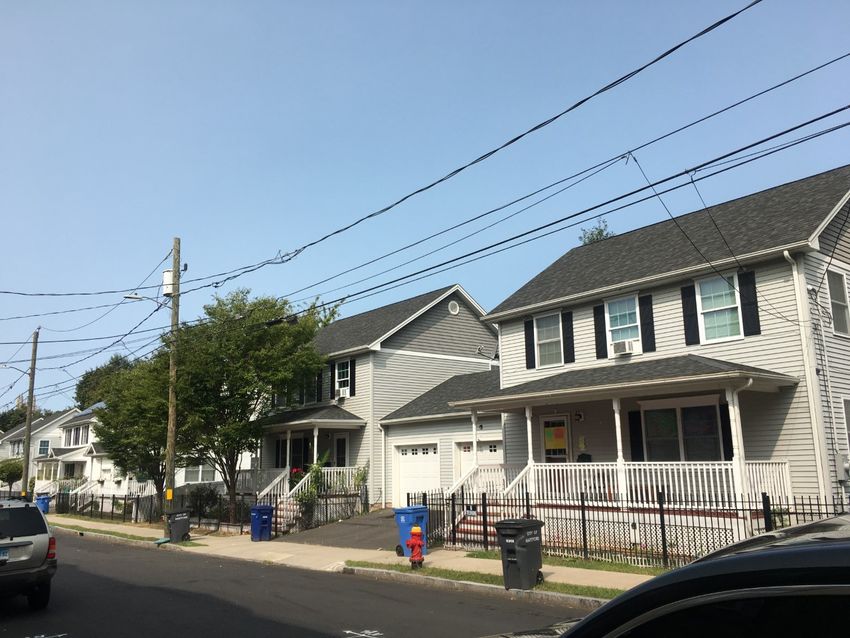
A Google Street View walk through the SINA neighborhood reveals that the homes
SINA has renovated over the past two decades remain well maintained. Despite the attractive
homes and landscaping of the SINA homes, many other properties in the neighborhood are in
need of repair.
Figure 1 The two Jefferson Street homes seen in the above picture were sold by SINA in 2001 and 2002. Nearly two decades later
they are still well maintained.
34
Settlemyer, Laura. Presentation to Professor Sean Fitzpatrick’s Public Management Course. Trinity College.
October 22, 2019.
27Figure 2 Adjacent to the two SINA homes pictured above are two homes that are moderately well maintained, but could use
some upgrades and maintenance. There are only a few vacant or blighted homes on Jefferson Street, a testament to how far it
has come.
Writes Iaiennaro:
Twenty years ago, Jefferson was in tough shape. The corner of Broad and Jefferson was
pretty much a bunch of vacant lots on which there was previously about four large multi-
family brick buildings which were demolished by the city (I think). There were also
maybe two vacant lots on the street and some vacant, blighted homes. We rehabbed
maybe four houses and built four new homes. As I remember, when we built the new
homes on the corner of Jefferson and Broad, it was a real test as to whether they would
sell or not. Eddie Perez who was at SINA at the time told me to build them and I said you
had better be willing to move the SINA offices there because I did not think they would
sell. It was a really tough area at the time, lots of gang, drug and prostitution activity. Of
course, the houses did sell and Eddie deserves the credit for the fact that he had the
vision.”35
Iaiennaro also reported that when SINA began its Cityscape Homes program, they sold
their two-family homes for between $150,000 and $175,000. As of 2020, they sell the two-
family homes they build and renovate in the neighborhood for $260,000-$270,000, 36 providing
further evidence of SINA’s success in the neighborhood.
35
Iaiennaro, Dean. Via email communication with the author. July 22, 2020.
36
Iaiennaro, Dean. Personal Conversation with the author. March 2020.
28Figure 3 This home at 51 School Street was sold by SINA in 2011. It was well
maintained as of this Google Street View capture in 2019.
Figure 4 These two adjoined homes on Colonial Street sold in 2012/2013. They were still well
maintained as of this capture by Google in 2019.
Figure 5 On School Street, this house sits vacant and blighted one building away from
SINA’s 51 School Street home shown above.
29Figure 6 Across the street from the SINA homes on Colonial Street are homes in
need of maintenance and repairs.
Figure 7 195 Jefferson Street is a three-family home between a three-family home renovated by
SINA and a three-family home bought by an employee of Hartford Hospital through its HIP
program administered by SINA. It is seen boarded up in 2011 in this photo.
Figure 8 191-193 Jefferson Street sold in 2002. 199 Jefferson Street was bought by an
employee of Hartford Hospital through their HIP program. The home is only steps
away from the Hospital. 195 Jefferson Street, unaffiliated with SINA, was a boarded-
up home in 2011. By 2019, it was no longer boarded and was occupied.
A look at nearly any home sold by SINA in the past twenty years on Google Street View
reveals a well-maintained home and landscaping. Whether the care of the SINA homeowners is
30spilling over to neighbors of SINA’s homes is questionable. Aside from the SINA homes, many
homes in the neighborhood are in need of updates and repairs, the streets could use repaving, and
there is trash on many streets. Though there are a couple of examples of potential spillovers
depicted in this section, it took careful observation of many homes in the neighborhood before a
spillover to a nearby house was found. It appears from the windshield survey that most nearby
houses are still in need of repair as of 2019. Not surprisingly, a 2019 survey by the Trinity
College Center for Hartford Engagement and Research (CHER) revealed the top concerns of
residents about the neighborhood surrounding the college (roughly the focus area of SINA’s
home renovations) as wild traffic, lack of cleanliness, lack of street maintenance, noise/parties,
and lack of home maintenance. 37
From a windshield survey perspective, it is clear that SINA is filling a gap in well-
maintained, affordable homes in the neighborhood, but the extent to which SINA’s efforts are
spilling over to encourage homeowners and others to invest in the neighborhood is unclear. This
does not mean that there are no spillovers happening—just that they are not widespread enough
to impact the number of homes in
the neighborhood in need of
Figure 9 I was walking down Colonial Street in
September 2020 to take the photo of a couple
significant repair. In some isolated
of SINA houses seen on the cover of this report
cases, though, it seems that
when I noticed this garden. The garden is
located between two four story apartment SINA’s investments are
buildings across the street from several SINA
homes. encouraging neighbors to repair their
homes, as can be seen with the home
pictured and described above at 195 Jefferson
Street.
A significant change in census tract 5027 during the period
studied was the opening of the Learning Corridor in
2000. As Trinity College professors Kevin Sullivan and
James Trostle have written:
The Learning Corridor is a 16-acre campus that includes four interdistrict magnet
schools: an early childhood and elementary grade Montessori school; an arts, science, and
37
Brown, Megan and Silva, Mabel. Trinity’s Relationship with the Hartford Neighborhood: Results from a
Community Resident Survey. Trinity College Center for Hartford Engagement and Research. October 7, 2019.
31You can also read