Community Health Needs Assessment 2016 - Henry Mayo ...
←
→
Page content transcription
If your browser does not render page correctly, please read the page content below
Community Health Needs Assessment
2016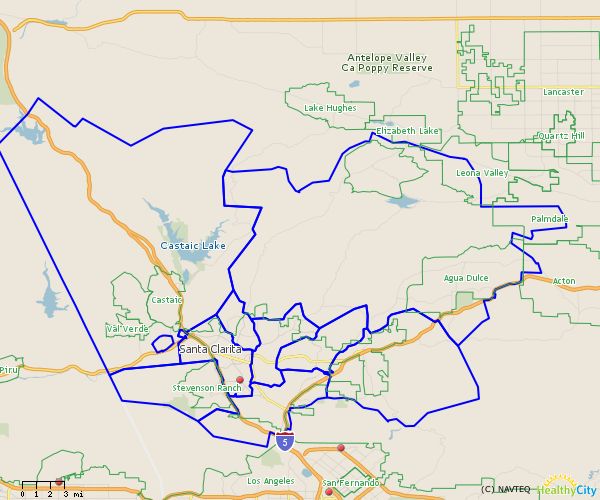
Table of Contents
Introduction ................................................................................................................................ 5
      Background and Purpose.................................................................................................... 5
      Service Area ....................................................................................................................... 5
      Project Oversight ................................................................................................................ 7
      Author ................................................................................................................................. 7
Methods ..................................................................................................................................... 8
      Secondary Data Collection .................................................................................................. 8
      Primary Data Collection ...................................................................................................... 8
      Information Gaps ................................................................................................................ 9
      Public Comment.................................................................................................................10
Identification of Significant Health Needs ..................................................................................11
      Review of Primary and Secondary Data .............................................................................11
      Significant Health Needs ....................................................................................................11
      Resources to Address Significant Needs ...........................................................................11
Priority Health Needs ................................................................................................................12
      Impact Evaluation ..............................................................................................................13
Community Demographics ........................................................................................................14
      Population ..........................................................................................................................14
      Race/Ethnicity ....................................................................................................................15
      Language ...........................................................................................................................16
Social and Economic Factors ....................................................................................................17
      Social and Economic Factors Ranking ...............................................................................17
      Poverty ..............................................................................................................................17
      Households ........................................................................................................................18
      Households by Type ..........................................................................................................19
      Free or Reduced Price Meals.............................................................................................19
      Public Program Participation ..............................................................................................20
      Unemployment ...................................................................................................................20
      Educational Attainment ......................................................................................................21
      Homelessness ...................................................................................................................21
      Crime and Violence ............................................................................................................22

                                                                                                                                           1
Henry Mayo Hospital – Community Health Needs Assessment
Community Input – Social and Economic Factors ..............................................................23
Health Care Access ..................................................................................................................25
Health Insurance Coverage ...............................................................................................25
Sources of Care .................................................................................................................26
Barriers to Care..................................................................................................................28
Access to Primary Care Community Health Centers ..........................................................28
Delayed Care .....................................................................................................................29
Community Input – Access to Care ....................................................................................29
Dental Care........................................................................................................................31
Community Input – Dental Care .........................................................................................31
Birth Characteristics ..................................................................................................................33
Births .................................................................................................................................33
Teen Birth Rate ..................................................................................................................33
Prenatal Care.....................................................................................................................33
Low Birth Weight ................................................................................................................34
Infant Mortality ...................................................................................................................35
Breastfeeding.....................................................................................................................35
Mortality/Leading Causes of Death ...........................................................................................36
Leading Causes of Premature Death .................................................................................36
Leading Causes of Death...................................................................................................36
Cancer Mortality .................................................................................................................37
Heart Disease Mortality ......................................................................................................38
Stroke Mortality ..................................................................................................................39
Respiratory (Lung) Disease Mortality .................................................................................40
Diabetes ............................................................................................................................42
Chronic Disease........................................................................................................................44
Health Status .....................................................................................................................44
Disability ............................................................................................................................44
Asthma ..............................................................................................................................44
Community Input – Asthma ................................................................................................45
Diabetes ............................................................................................................................45
Community Input – Diabetes ..............................................................................................46
2
Henry Mayo Hospital – Community Health Needs AssessmentHeart Disease ....................................................................................................................47
High Blood Pressure ..........................................................................................................47
Community Input – Heart Disease .....................................................................................48
Cancer ...............................................................................................................................48
Community Input – Cancer ................................................................................................49
HIV/AIDS ...........................................................................................................................49
Sexually Transmitted Diseases ..........................................................................................50
Teen Sexual History ...........................................................................................................50
Hospitalization and ER Rates.............................................................................................50
Health Behaviors.......................................................................................................................52
Health Behaviors Ranking ..................................................................................................52
Overweight and Obesity .....................................................................................................52
Fast Food...........................................................................................................................53
Soda Consumption ............................................................................................................54
Fruit Consumption..............................................................................................................54
Access to Fresh Produce ...................................................................................................54
Physical Activity .................................................................................................................54
Community Input – Overweight and Obesity ......................................................................55
Mental Health and Substance Abuse ........................................................................................57
Mental Health .....................................................................................................................57
Community Input – Mental Health ......................................................................................58
Tobacco/Alcohol/Drug Use ................................................................................................60
Cigarette Smoking .............................................................................................................60
Alcohol and Drug Use ........................................................................................................60
Community Input – Substance Abuse ................................................................................61
Preventive Practices .................................................................................................................63
Flu and Pneumonia Vaccines.............................................................................................63
Immunization of Children ...................................................................................................63
Mammograms ....................................................................................................................64
Pap Smears .......................................................................................................................64
Community Input – Preventive Practices ............................................................................64
Attachment 1. Community Interviewees ....................................................................................66
3
Henry Mayo Hospital – Community Health Needs AssessmentAttachment 2. Community Resources .......................................................................................67
Attachment 3. Impact Evaluation ...............................................................................................70
4
Henry Mayo Hospital – Community Health Needs AssessmentIntroduction
Background and Purpose
Henry Mayo Newhall Hospital (Henry Mayo) is a 238-bed nonprofit hospital that serves
the Santa Clarita Valley in Los Angeles County, California. The mission of the hospital
is to improve the health of our community through compassion and excellence in health
care services. Founded in 1975, Henry Mayo is a fully accredited, acute care hospital
facility and level II trauma center that provides inpatient and outpatient
services. Services include a nationally recognized Advanced Primary Stroke Center,
the Sheila R. Veloz Breast Imaging Center, a behavioral health unit, outpatient wound
care, maternity, cancer and comprehensive cardiovascular care.
Henry Mayo has seen the Santa Clarita Valley experience tremendous growth and an
aging population. As a result, the need for expanded health care services has
dramatically increased. To grow with the community, the hospital has embarked on a
major long-term planning project which includes the construction of a new inpatient
hospital building that will add up to 120 new beds, new medical office buildings
designed to support hospital programs and services, a new central plant, new parking
structures and a life-saving helipad. Recent improvements include the complete
renovation and expansion of the intensive care unit (ICU), the current construction of a
neonatal intensive care unit (NICU), and a new operating room. In the last five years,
the hospital also expanded and updated its entire emergency and imaging departments,
adding new and replacement technologies to improve the quality of your care.
Henry Mayo Newhall Hospital has undertaken a Community Health Needs Assessment
(CHNA) required by state and federal law. California Senate Bill 697 and the Patient
Protection and Affordable Care Act IRS section 501(r)(3) direct tax exempt hospitals to
conduct a Community Health Needs Assessment and develop an Implementation
Strategy every three years. The Community Health Needs Assessment is a primary
tool used by the hospital to determine its community benefit plan, which outlines how it
will give back to the community in the form of health care and other community services
to address unmet community health needs. This assessment incorporates components
of primary data collection and secondary data analysis that focus on the health and
social needs of the service area.
Service Area
Henry Mayo Newhall Hospital is located at 23845 McBean Parkway, Valencia,
California 91355. The service area includes portions of Service Planning Area (SPA) 2
(San Fernando) in Los Angeles County.
5
Henry Mayo Hospital – Community Health Needs AssessmentThe hospital service area includes 10 zip codes, representing 9 cities or communities.
To determine the service area, Henry Mayo Newhall Hospital takes into account the zip
codes of inpatients discharged from the hospital. The Henry Mayo Hospital service
area is presented below. Newhall zip code 91322 is not yet tracked by any of the data-
reporting sites, such as the Census bureau, or L.A County or California Departments of
Health; therefore this zip code is omitted in the following report, and all data are based
on the remaining 9 zip codes.
Henry Mayo Newhall Hospital Service Area
Geographic Area Zip Code SPA/County
Agua Dulce / Saugus 91350, 91390 SPA 2, Los Angeles County
Canyon Country 91351, 91387 SPA 2, Los Angeles County
Castaic / Val Verde 91384 SPA 2, Los Angeles County
Newhall 91321, 91322 SPA 2, Los Angeles County
Santa Clarita 91354 SPA 2, Los Angeles County
Stevenson Ranch 91381 SPA 2, Los Angeles County
Valencia 91355 SPA 2, Los Angeles County
Source: HealthyCity.org
6
Henry Mayo Hospital – Community Health Needs AssessmentProject Oversight
The Community Health Needs Assessment process was overseen by:
Patrick J. Moody
Director, Marketing, Public and Community Relations
Henry Mayo Newhall Hospital
Author
Biel Consulting, Inc. conducted the Community Health Needs Assessment. Biel
Consulting, Inc. is an independent consulting firm that works with hospitals, clinics and
community-based nonprofit organizations. Melissa Biel, DPA, RN conducted the
Community Health Needs Assessment. She was joined by Sevanne Sarkis, JD, MHA,
MEd and Denise Flanagan, BA. Biel Consulting, Inc. has extensive experience
conducting hospital Community Health Needs Assessments and working with hospitals
to develop, implement, and evaluate community benefit programs.
www.bielconsulting.com
7
Henry Mayo Hospital – Community Health Needs AssessmentMethods
Secondary Data Collection
Secondary data were collected from a variety of local, county, and state sources to
present community demographics, social and economic factors, health care access,
birth characteristics, leading causes of death, chronic disease, health behaviors, mental
health and substance abuse, and preventive practices. These data are presented in the
context of Los Angeles County and California State, framing the scope of an issue as it
relates to the broader community.
Sources of data include the U.S. Census American Community Survey, Los Angeles
County Department of Public Health, California Health Interview Survey, California
Department of Public Health, California Employment Development Department, the
California Cancer Registry, County Health Rankings, Los Angeles Homeless Services
Authority, the California Department of Education, and others. When pertinent, these
data sets are presented in the context of California State.
Secondary data for the hospital service area were collected and documented in data
tables with narrative explanation. The tables present the data indicator, the geographic
area represented, the data measurement (e.g. rate, number, or percent), county and
state comparisons (when available), the data source, data year and an electronic link to
the data source. Analysis of secondary data included an examination and reporting of
health disparities for some health indicators. The report includes benchmark
comparison data that measures Henry Mayo’s community data findings with Healthy
People 2020 objectives. Healthy People 2020 objectives are a national initiative to
improve the public’s health by providing measurable objectives and goals that are
applicable at national, state, and local levels.
Primary Data Collection
Targeted interviews were used to gather information and opinions from persons who
represent the broad interests of the community served by the hospital. Twenty-two
interviews were completed from June through September, 2016. For the interviews,
community stakeholders identified by Henry Mayo were contacted and asked to
participate in the needs assessment. Interviewees included individuals who are leaders
and representatives of medically underserved, low-income, and minority populations, or
regional, state or local health or other departments or agencies that have current data or
other information relevant to the health needs of the community served by the hospital
facility.
8
Henry Mayo Hospital – Community Health Needs AssessmentThe identified stakeholders were invited by email to participate in a one hour phone
interview. Appointments for the interviews were made on dates and times convenient to
the stakeholders. At the beginning of each interview, the purpose of the interview in the
context of the assessment was explained, the stakeholders were assured their
responses would remain confidential, and consent to proceed was given. A list of the
stakeholder interview respondents, their titles and organizations can be found in
Attachment 1.
Initially, significant health needs were identified through a review of the secondary
health data collected and analyzed prior to the interviews. These data were then used
to help guide the interviews. The needs assessment interviews were structured to
obtain greater depth and richness of information and build on the secondary data
review. During the interviews, participants were asked to identify the major health
issues in the community, and socioeconomic, behavioral, environmental or clinical
factors contributing to poor health. They were asked to share their perspectives on the
issues, challenges and barriers relative to the significant health needs, and identify
potential resources to address these health needs, such as services, programs and/or
community efforts. The interviews focused on these significant health needs:
Access to health care
Cancer
Cardiovascular disease
Diabetes
Mental health
Overweight/obesity
Preventive practices (screenings, vaccines)
Substance abuse (alcohol, drugs, tobacco)
Analysis of the primary data occurred through a process that compared and combined
responses to identify themes. All responses to each question were examined together
and concepts and themes were then summarized to reflect the respondents’
experiences and opinions. The results of the primary data collection were reviewed in
conjunction with the secondary data. Primary data findings were used to corroborate
the secondary data-defined health needs, serving as a confirming data source. The
responses are included in the following Community Health Needs Assessment
chapters.
Information Gaps
Information gaps that impact the ability to assess health needs were identified. Some of
the secondary data are not always collected on a regular basis, meaning that some data
9
Henry Mayo Hospital – Community Health Needs Assessmentare several years old. Primary data collection and the prioritization process were also
subject to limitations. Themes identified during interviews were likely subject to the
experience of individuals selected to provide input. The final prioritized list of significant
health needs is also subject to the affiliation and experience of the individuals who
participated in the prioritization process.
Public Comment
In compliance with IRS regulations 501(r) for charitable hospitals, a hospital Community
Health Needs Assessment (CHNA) and Implementation Strategy are to be made widely
available to the public and public comment is to be solicited. In compliance with these
regulations, the previous hospital Community Health Needs Assessment and
Implementation Strategy were made widely available to the public on the website
http://www.henrymayo.com/our-community/our-community. Public comment was
requested on these reports. To date, no written comments have been received.
10
Henry Mayo Hospital – Community Health Needs AssessmentIdentification of Significant Health Needs
Review of Primary and Secondary Data
The analysis of secondary data yielded a preliminary list of significant health needs,
which then informed primary data collection. The primary data collection process
helped to validate secondary data findings, identify additional community issues, solicit
information on disparities among subpopulations, and ascertain community assets to
address needs.
Health needs were identified from secondary data using the size of the problem (relative
portion of population afflicted by the problem) and the seriousness of the problem
(impact at individual, family, and community levels). To determine size or seriousness of
the problem, the health need indicators identified in the secondary data were measured
against benchmark data, specifically county rates, state rates and/or Healthy People
2020 objectives. Indicators related to the health needs that performed poorly against
one or more of these benchmarks met this criterion to be considered a health need.
The analysis of secondary data yielded a preliminary list of significant health needs,
which then informed primary data collection. The primary data collection process was
designed to validate secondary data findings, identify additional community issues,
solicit information on disparities among subpopulations, ascertain community assets to
address needs and discover gaps in resources.
Significant Health Needs
The following significant health needs were determined:
Access to health care
Asthma
Cancer
Dental Care
Diabetes
Heart disease
Mental health
Overweight/obesity
Preventive practices (screenings, vaccines)
Substance abuse (alcohol, drugs, tobacco)
Resources to Address Significant Needs
Through the interview process, community stakeholders identified potential community
resources to address the identified health needs. These are presented in Attachment 2.
11
Henry Mayo Hospital – Community Health Needs AssessmentPriority Health Needs
The identified significant health needs were prioritized with input from the community.
Interviews with community stakeholders were used to gather input on the identified
health needs. The following criteria were used to prioritize the health needs:
The perceived severity of a health issue or health factor/driver as it affects the
health and lives of those in the community;
The level of importance the hospital should place on addressing the issue.
Calculations totaling severity and importance scores from the community stakeholder
interviews resulted in the following prioritization of the significant health needs:
Each of the stakeholder interviewees was sent a link to an electronic survey (Survey
Monkey) in advance of the interview. The stakeholders were asked to rank each
identified health need. The percentage of responses were noted as those that identified
the need as having severe or very severe impact on the community, had worsened over
time, and had a shortage or absence of resources available in the community. Not all
survey respondents answered every question, therefore, the response percentages
were calculated based on respondents only and not on the entire sample size. Mental
health, substance abuse, and overweight and obesity had the highest scores in the
survey. Diabetes also had a high ranking for worsening over time; and access to care,
heart disease and cancer also rated high on insufficient resources available to address
the need.
Severe and Very Severe Insufficient or
Significant Health Worsened Over
Impact on the Absence of
Needs Time
Community Resources
Access to health care 46.2% 22.2% 58.3%
Asthma 20.0% 0% 25.0%
Cancer 70.0% 30.0% 55.6%
Dental Care 11.1% 14.3% 0%
Diabetes 42.9% 62.5% 44.4%
Heart disease 71.4% 28.6% 57.1%
Mental health 100% 72.7% 100%
Overweight/obesity 54.5% 62.5% 66.7%
Preventive practices 30.0% 0% 20.0%
Substance abuse 84.6% 72.7% 72.7%
The interviewees were asked to rank order the health needs according to highest level
of importance in the community. The total score for each significant health need
(possible score of 4) was divided by the total number of responses for which data were
provided, resulting in an overall average for each health need. Mental health, access to
care and substance abuse were ranked as the top three priority needs in the service
area. The calculations of the community input resulted in the following prioritization of
12
Henry Mayo Hospital – Community Health Needs Assessmentthe significant health needs:
Significant Health Needs Priority Ranking (Total Possible Score of 4)
Mental health 4.00
Access to health care 3.86
Substance abuse (alcohol, drugs, tobacco) 3.85
Heart disease 3.69
Overweight/obesity 3.64
Cancer 3.62
Diabetes 3.57
Preventive practices (screenings, vaccines) 3.46
Asthma 3.42
Dental Care 3.29
Impact Evaluation
In 2013 Henry Mayo conducted their previous Community Health Needs Assessment
(CHNA). Significant health needs were identified from issues supported by primary and
secondary data sources gathered for the Community Health Needs Assessment. In
developing the Implementation Strategy associated with the 2013 CHNA, Henry Mayo
chose to address access to care, cardiovascular disease, and diabetes. The evaluation
of the impact of actions the hospital used to address these significant health needs can
be found in Attachment 3.
13
Henry Mayo Hospital – Community Health Needs AssessmentCommunity Demographics
Population
The population of the Henry Mayo Newhall Hospital service area is 276,958.
Population, 5-Year Estimates, 2010-2014
Zip Code Population
Agua Dulce/Saugus 91390 19,691
Canyon Country 91351 32,433
Canyon Country 91387 42,518
Castaic/ Val Verde 91384 28,949
Newhall 91321 34,576
Santa Clarita 91354 29,034
Saugus 91350 35,826
Stevenson Ranch 91381 20,296
Valencia 91355 33,635
Henry Mayo Service Area 276,958
Los Angeles County 9,974,203
Source: U.S. Census Bureau, American Community Survey, 2010-2014, DP05.http://factfinder.census.gov
Of the area population, 51.0%% are male and 49.0% are female.
Population by Gender
Henry Mayo Service Area Los Angeles County
Male 51.0% 49.3%
Female 49.0% 50.7%
Source: U.S. Census Bureau, 2010-2014 American Community Survey, 5-year estimates, DP05.http://factfinder.census.gov
Children and youth, ages 0-17, make up 26.8% of the population; 63.9% are adults,
ages 18-64; and 9.3% of the population are seniors, 65 and over. The median age in
the service area is 36.2, higher than the county's median age of 35.3.
Population by Age
Henry Mayo Service Area Los Angeles County
0–4 6.0% 6.5%
5–9 7.3% 6.3%
10 – 14 8.3% 6.5%
15 – 17 5.1% 4.2%
18 – 20 4.5% 4.5%
21 – 24 5.0% 6.2%
25 – 34 12.3% 15.3%
35 – 44 14.8% 14.2%
45 – 54 16.3% 13.8%
55 – 64 11.0% 10.9%
14
Henry Mayo Hospital – Community Health Needs AssessmentHenry Mayo Service Area Los Angeles County
65 – 74 5.8% 6.3%
75 – 84 2.4% 3.6%
85+ 1.2% 1.7%
Median Age 36.2 35.3
Source: U.S. Census Bureau, American Community Survey, 2010-2014, DP05.http://factfinder.census.gov
When the service area is examined by zip code, Stevenson Ranch has the largest
percentage of youth, ages 0-17 (32%). Newhall has the highest percentage of residents
65 and older (13%), followed by Valencia (12.7%).
Population by Youth, Ages 0-17, and Seniors, Ages 65+
Youth Seniors
Zip Code
Ages 0 – 17 Ages 65+
Agua Dulce/Saugus 91390 27.1% 9.7%
Canyon Country 91351 26.5% 8.9%
Canyon Country 91387 28.5% 8.1%
Castaic/ Val Verde 91384 22.7% 5.2%
Newhall 91321 26.2% 13.0%
Santa Clarita 91354 28.8% 8.8%
Saugus 91350 27.3% 9.1%
Stevenson Ranch 91381 32.0% 7.3%
Valencia 91355 23.2% 12.7%
Henry Mayo Service Area 26.8% 9.3%
Los Angeles County 23.5% 11.6%
Source: U.S. Census Bureau, American Community Survey, 2010-2014, DP05.http://factfinder.census.gov
Race/Ethnicity
In the Henry Mayo Hospital service area, 50.8% of the population is White; 30.4% is
Hispanic/Latino; 10.6% of the residents are Asian; 3.4% are Black/African American;
0.1% are American Indian/Alaskan Native; 0.1% are Native Hawaiian/Pacific Islander;
and 4.6% are another race or multiple race/ethnicity. This is a much higher percentage
of Whites and a lower percentage of other races/ethnicities (other than ‘other/multiple’)
than found at the county level.
Race/Ethnicity
Henry Mayo Service Area Los Angeles County
White 50.8% 27.3%
Hispanic/Latino 30.4% 48.1%
Asian 10.6% 13.8%
Black/African American 3.4% 8.0%
American Indian/Alaska Native 0.1% 0.2%
Native Hawaiian/Pacific Islander 0.1% 0.2%
Other / Multiple 4.6% 2.4%
Source: U.S. Census Bureau, American Community Survey, 2010-2014, DP05.http://factfinder.census.gov
15
Henry Mayo Hospital – Community Health Needs AssessmentLanguage
English is spoken at home by the majority (69.5%) of service area residents. Spanish is
spoken in the home among 19.1% of the population, while 6.6% of the population
speaks an Asian language; and 4.8% of the population speaks another language at
home. This is a much higher percentage of English-speakers, and a lower percentage
of Spanish, Asian, and other Indo-European-language speakers than found at the
county level.
Language Spoken at Home, Population 5 Years and Older
Henry Mayo Service Area Los Angeles County
Speaks Only English 69.5% 43.3%
Speaks Spanish 19.1% 39.4%
Speaks Asian/Pacific Islander Language 6.6% 10.8%
Speak Other Indo-European Language 3.2% 5.4%
Speaks Other Language 1.6% 1.1%
Source: U.S. Census Bureau, American Community Survey, 2010-2014, DP02.http://factfinder.census.gov
When communities in the service area are examined by zip code, the areas with the
highest concentrations of English-only speakers are Agua Dulce/Saugus and Valencia.
The highest concentration of Spanish-speakers is found in Newhall and Canyon
Country (91351 zip code).
Language Spoken at Home by Zip Code
Zip Asian/Pacific Other Indo
English Spanish
Code Islander European
Agua Dulce/Saugus 91390 80.0% 13.1% 2.6% 3.1%
Canyon Country 91351 62.1% 29.0% 5.3% 2.5%
Canyon Country 91387 64.1% 22.1% 7.6% 3.4%
Castaic/ Val Verde 91384 66.5% 26.4% 4.7% 2.1%
Newhall 91321 57.8% 33.8% 4.4% 2.8%
Santa Clarita 91354 74.5% 7.8% 11.1% 4.3%
Saugus 91350 75.0% 14.7% 5.6% 2.9%
Stevenson Ranch 91381 72.7% 6.5% 12.4% 6.6%
Valencia 91355 79.0% 10.3% 6.7% 2.4%
Henry Mayo Service Area 69.4% 19.1% 6.6% 3.2%
Los Angeles County 43.2% 39.4% 10.8% 5.4%
Source: U.S. Census Bureau, American Community Survey, 2010-2014, DP02.http://factfinder.census.gov
16
Henry Mayo Hospital – Community Health Needs AssessmentSocial and Economic Factors
Social and Economic Factors Ranking
Through the County Health Rankings database, social and economic indicators are
examined as a contributor to the health of a county’s residents. California’s 58 counties
are ranked according to social and economic factors with 1 being the county with the
best factors to 58 for the county with the poorest factors. This ranking examines high
school graduation rates, unemployment, children in poverty, social support, and others.
Los Angeles County is ranked as 42, in the bottom half of all California counties
according to social and economic factors.
Social and Economic Factors Ranking
County Ranking (out of 58)
Los Angeles County 42
Source: County Health Rankings, 2015. www.countyhealthrankings.org
Poverty
Poverty thresholds are used for calculating all official poverty population statistics. They
are updated each year by the Census Bureau. For 2014, the federal poverty level (FPL)
for one person was an annual income of $11,670 and for a family of four was $23,850.
The hospital service area has a much lower rate of poverty than Los Angeles County or
the state, with 8.7% of the population at or below 100% of the federal poverty level
(FPL) compared to 18.4% for the county and 16.4% for California. The service area
population at or below 200% FPL (low income) is 20.7%, which is lower than Los
Angeles County (40.9%) and the state (36.4%).
Poverty Level
Henry Mayo Service Area Los Angeles County CaliforniaPoverty Levels of Individuals, Children under Age 18, and Seniors 65+
ZCTA Individuals Children Seniors
Agua Dulce/Saugus 91390 5.6% 5.7% 0.8%
Canyon Country 91351 12.9% 19.0% 5.0%
Canyon Country 91387 10.6% 16.0% 5.5%
Castaic/ Val Verde 91384 9.5% 12.3% 3.0%
Newhall 91321 16.1% 24.5% 10.6%
Santa Clarita 91354 4.3% 3.5% 2.7%
Saugus 91350 5.1% 5.2% 4.4%
Stevenson Ranch 91381 4.1% 3.0% 3.4%
Valencia 91355 6.2% 1.6% 9.9%
Henry Mayo Service Area 8.7% 10.9% 6.0%
Los Angeles County 18.4% 26.0% 13.4%
California 16.4% 22.7% 10.2%
Source: U.S. Census Bureau, American Community Survey, 2010-2014, S1701. http://factfinder.census.gov
According to the 2014 California Health Interview Survey, 25.3% of adult residents of
SPA 2 living below 200% of the Federal Poverty Level reported food insecurity. While
this represents more than a quarter of the low-income population, it is well below both
the state average of 38.4%, and the county level of 39.5%.
Food Insecurity, Adults below 200% of Poverty
Percent
SPA 2* 25.3%
Los Angeles County 39.5%
California 38.4%
Source: California Health Interview Survey, 2014; http://ask.chis.ucla.edu/
* = statistically unstable due to sample size
Households
In the hospital service area there are 87,638 households and 91,170 housing units. The
median household income is $89,668 and the average (mean) household income is
$106,350. These are higher than Los Angeles County’s median and mean household
income.
Household Income
Henry Mayo Service Area Los Angeles County
Median Household Income $89,668 $55,870
Average Household Income $106,350 $82,109
Source: U.S. Census Bureau, 2010-2014 American Community Survey, 5-year estimates, DP03. http://factfinder.census.gov
When looked at by zip code, the median household income ranges quite widely, from
$57,654 in Newhall 91321 to $114,608 in Stevenson Ranch.
18
Henry Mayo Hospital – Community Health Needs AssessmentMedian Household Income
ZCTA Households Median Income
Agua Dulce/Saugus 91390 6,243 $105,659
Canyon Country 91351 10,139 $70,858
Canyon Country 91387 13,441 $82,076
Castaic/ Val Verde 91384 6,908 $102,273
Newhall 91321 11,022 $57,654
Santa Clarita 91354 9,570 $111,098
Saugus 91350 11,114 $97,921
Stevenson Ranch 91381 6,527 $114,608
Valencia 91355 12,674 $89,596
Henry Mayo Service Area 87,638 $89,668
Los Angeles County 3,242,391 $55,870
California 12,617,280 $61,489
Source: U.S. Census Bureau, American Community Survey, 2010-2014, DP03.http://factfinder.census.gov
Households by Type
When households are examined by type, the service area has a higher percent of family
households with children under 18 years old (40.1% of all households), and a lower
percent of female as head of household with children (7% of all households), and
seniors 65+ living alone (6.6% of all households), when compared to the county and
state.
Households by Type
Family Female Head of
Total Seniors, 65+,
Households with Household with own
Households Living Alone
Children under 18 Children under 18
Number Percent Percent Percent
Henry Mayo Service Area 87,638 40.1% 7.0% 6.6%
Los Angeles County 3,242,391 31.3% 7.8% 8.1%
California 12,617,280 32.4% 7.1% 8.6%
Source: U.S. Census Bureau, American Community Survey, 2010-2014, DP02. http://factfinder.census.gov
Free or Reduced Price Meals
The percentage of students eligible for the free or reduced price meal program is one
indicator of socioeconomic status. In the Los Angeles Unified School Districts, over
75% of the student population is eligible for the free or reduced price meal program,
indicating a high level of low-income families. This rate is higher than county and state
rates. Castaic Union, William S. Hart Union and Saugus Union School Districts have
fewer than a third of their students who are eligible for the program.
19
Henry Mayo Hospital – Community Health Needs AssessmentFree or Reduced Price Meals Eligibility
Percent Eligible Students
Acton Agua Dulce School District 40.6%
Castaic Union School District 29.7%
Los Angeles Unified School District 75.6%
Newhall School District 39.7%
Saugus Union School District 21.2%
Sulphur Springs School District 52.1%
William S. Hart Union High School District 27.4%
Los Angeles County 66.5%
California 58.6%
Source: California Department of Education, 2014-2015. http://data1.cde.ca.gov/dataquest/
Public Program Participation
Residents in SPA 2 have lower rates of participation in the WIC and Food Stamp
government sponsored public programs as compared to county residents. In SPA 2,
40.1% of residents below 200% of the FPL indicated they could not afford food, and
14.9% utilize food stamps. These rates indicate a percentage of residents who may
qualify for food stamps but do not access this resource. WIC benefits are more readily
accessed. Among children in SPA 2, 47% access WIC benefits and, 3.1% are
TANF/CalWorks recipients, which is lower than state and county rates.
Public Program Participation
Los Angeles
SPA 2 California
County
Not Able to Afford Food (Educational Attainment
Among service area adults, ages 25 and older, 10.9% lack a high school diploma; this is
less than half of the county rate of 23.2%. 45.4% of service area adults are high school
graduates and 43.7% are college graduates. In Los Angeles County, 40% of residents
are high school graduates and 36.7% are college graduates.
Educational Attainment of Adults, 25 Years and Older
Henry Mayo Service Area Los Angeles County
th
Less than 9 Grade 4.4% 13.6%
Some High School, No Diploma 6.5% 9.6%
High School Graduate 18.9% 20.6%
Some College, No Degree 26.5% 19.5%
Associate Degree 9.8% 6.8%
Bachelor Degree 23.1% 19.5%
Graduate or Professional Degree 10.8% 10.4%
Source: U.S. Census Bureau, American Community Survey, 2010-2014, DP02. http://factfinder.census.gov
High school graduation rates are determined by taking the number of graduates for the
school year divided by the number of freshman enrolled four years earlier. The high
school graduation rate for LAUSD (70.2%) is lower that the county (77.9%), and state
(81%) rates, and does not meet the Healthy People 2020 objective of a 82.4% high
school graduation rate. Acton / Agua Dulce and William S. Hart Union school districts
have graduation rates that are higher than the county and state, and that exceed the
Healthy People 2020 objective.
High School Graduation Rates, 2013-2014
High School Graduation Rate
Acton Agua Dulce School District 86.7%
Los Angeles Unified School District 70.2%
William S. Hart Union High School District 95.3%
Los Angeles County 77.9%
California 81.0%
Source: California Department of Education, 2013-2014. http://dq.cde.ca.gov/dataquest/.
Homelessness
Every two years, the Los Angeles Homeless Services Authority (LAHSA) conducts the
Greater Los Angeles Homeless Count to determine how many individuals are homeless
on a given day. Data from this survey show an increase in homelessness from 2013 to
2015. In 2015, SPA 2 had 5,216 homeless persons, 78.2% of whom were single adults
and 21% were families. The percent of unsheltered homeless has risen in SPA 2; the
percentage of unaccompanied minors has decreased since 2013.
21
Henry Mayo Hospital – Community Health Needs AssessmentHomeless Population, 2013-2015 Homeless Count Comparison
SPA 2 Los Angeles County
2013 2015 2013 2015
Total Homeless 4,836 5,216 39,463 44,359
Sheltered 28.3% 26.6% 36.3% 30.1%
Unsheltered 71.7% 73.4% 63.7% 69.9%
Individual Adults 77.9% 78.2% 78.9% 81.1%
Family Members 20.9% 21.0% 18.8% 18.2%
Unaccompanied Minors (Calls for domestic violence are categorized as occurring with or without a weapon. The
domestic violence calls in Santa Clarita were primarily with weapons. The with weapon
call rate for Santa Clarita (76.6%) and the L.A. County Sheriff’s Office (who respond to
calls in the unincorporated areas) were higher than the county rate.
Domestic Violence Calls, 2014
Total Without Weapon With Weapon
Santa Clarita 518 23.4% 76.6%
L.A. County Sheriff’s Dept. 3,389 13.7% 86.3%
Los Angeles County 39,145 34.5% 65.5%
California 158,547 60.9% 39.1%
Source: California Department of Justice, Office of the Attorney General, 2014. https://oag.ca.gov/crime/cjsc/stats/domestic-violence
Community Input – Social and Economic Factors
Stakeholder interviews identified the most important socioeconomic, behavioral,
environmental and clinical factors contributing to poor health in the community:
There is a large influx of homeless individuals who have nowhere to go and there
are very few resources for them in the Santa Clarita Valley.
We have a growing homeless population and many of them have multiple health
issues that bring them to our ED. Those are infection, diabetes, mental health
issues. The homeless situation is increasing. We have frequent flyers and
patients who don’t want to follow-up on their own care. We do have a homeless
coalition that just started in the last 6 months. There are a couple of shelters
around but they do not provide year-round service, only in the winter.
Homelessness is an interesting issue in Santa Clarita. The city has really avoided
wanting to embrace the issue. They tried to not provide a permanent facility. The
homeless have their own network, they know how to operate, where facilities are
and how to work the system and the city doesn’t want people settling here.
Access to healthy foods in some areas. Healthy food costs more.
We have poverty in a community that is viewed as very affluent. It makes it
difficult to acknowledge that it exists and it is impacting care and services in this
community. We have a fairly significant population of homeless or housing
insecure. As a community we are openly beginning to acknowledge this fact. No
supportive housing options, no resources to address it.
Very conservative environment. So when you talk about the undocumented, it’s
not openly discussed. It is at a crisis level before there are access services.
When we do provide those services, there is small amount of money for
undocumented care, so it’s an underserved population in the community.
Samuel Dixon (community clinic) has more clients to serve than they have the
capacity to serve.
23
Henry Mayo Hospital – Community Health Needs Assessment We have a Latino community in Newhall and lower-income areas going into
Canyon Country where there is a lack of healthy living.
A lot of people work in other parts of LA versus working here in the Santa Clarita
Valley so we have to be on the roads a lot more. It’s also a lot hotter out here.
If English is not your first language, you may have fear and lack of education. In
some cultures, people don’t do certain things; they just don’t know and haven’t
been taught anything different.
It’s hard for people to find a job out here and stay out here due to the high price
of property and rentals, and it’s getting worse and worse. Soon people will be
living very far out of town to work here.
Our community likes to believe things don’t happen here. We have to really wake
people up that it happens at every level in this valley.
We have stigmas against things we don’t want in our Valley like homelessness:
we only have a homeless shelter that is open for three months a year.
Impoverished, poor, and undocumented, don’t have access to care. They
struggle to survive day-to-day so their health needs get pushed to the side until it
can’t be ignored anymore.
Homelessness has increased incredibly in the Santa Clarita Valley. Unlike
downtown LA, we don’t have Skid Row but we have the Wash and a lot of
homeless people live there. Temperatures and temperature ranges are different
here. Its bitter cold and very hot: extremes here. People suffer with no place to
live. What is a little different from LA is that the homeless aren’t as visible here,
they are couch surfing, living at a friend’s house, etc.; they are invisible. Not an
encampment.
High rents are becoming a real huge issue out here. People can’t find living
arrangements they can afford. So we are seeing an uptick in homelessness.
Low level of education, no high school diploma, language can be a barrier as
well. Lack of resources in our community is also a significant barrier.
Socioeconomic level for a segment of the population that is at poverty level such
as day laborers and uninsured.
Our community has this sense that we are affluent. And I think there is a certain
pressure to keep up or be perceived as being part of the so-called affluent class.
We are a fishbowl. Not a lot of diversity or access to different types of
communities, so we are an internal, self-absorbed type of community. And
coming off the downfall of the economy, so many people in the Santa Clarita
Valley lost their homes. People are maxed out.
Not enough money to eat is a big issue. We have seniors who will choose not to
buy their medications because otherwise they won’t have enough money to
cover rent.
24
Henry Mayo Hospital – Community Health Needs AssessmentHealth Care Access
Health Insurance Coverage
Health insurance coverage is a key component to accessing health care. The Healthy
People 2020 goal is for 100% insurance coverage. While none of the zip codes in the
service area meet that goal, some come closer than others. As a whole, the service
area has a higher rate of insurance coverage (88.4%) than the county (79.1%) or the
state (83.3%). The highest rate of coverage is found in Santa Clarita (93.4%) and the
lowest in Newhall 91321 (80%).
Health Insurance Coverage by Zip Code
Zip Code Percent
Agua Dulce/Saugus 91390 92.4%
Canyon Country 91351 82.2%
Canyon Country 91387 86.9%
Castaic/ Val Verde 91384 90.2%
Newhall 91321 80.0%
Santa Clarita 91354 93.4%
Saugus 91350 90.5%
Stevenson Ranch 91381 92.2%
Valencia 91355 92.5%
Henry Mayo Service Area 88.4%
Los Angeles County 79.1%
California 83.3%
Source: U.S. Census Bureau, American Community Survey, 2010-2014, S2701.http://factfinder.census.gov
In SPA 2, 88.1% of the population is insured, which is higher than the county rate.
Insurance Coverage
SPA 2 Los Angeles County California
Insured 88.1% 86.7% 88.1%
Uninsured 11.9% 13.3% 11.9%
Source: California Health Interview Survey, 2014. http://ask.chis.ucla.edu/
SPA 2 has a lower percentage of Medi-Cal coverage (20.8%), and a higher percentage
of employment-based insurance (46.8%), and privately purchased insurance (9.2%)
than the county or state.
25
Henry Mayo Hospital – Community Health Needs AssessmentInsurance Coverage
SPA 2 Los Angeles County California
Medi-Cal 20.8% 24.4% 22.5%
Medicare Only 1.7% 1.4% 1.4%
Medi-Cal/Medicare 1.6% 3.7% 3.0%
Medicare & Others 7.9% 7.4% 9.0%
Other Public 0.1% 0.8% 1.0%
Employment Based 46.8% 41.5% 44.8%
Private Purchase 9.2% 7.4% 6.4%
No Insurance 11.9% 13.3% 11.9%
Source: California Health Interview Survey, 2014. http://ask.chis.ucla.edu/
When insurance coverage for SPA 2 was examined by age groups, adults, ages 18-64,
had the highest rate of uninsured. Coverage for children was primarily through
employment-based insurance and Medi-Cal. Seniors have high rates of Medicare
coverage.
Insurance Coverage by Age Group
Ages 0-17 Ages 18-64 Ages 65+
Los Angeles Los Angeles Los Angeles
SPA 2 SPA 2 SPA 2
County County County
Medi-Cal 40.0% 45.5% 16.7% 21.0% 1.6% 1.8%
Medicare Only N/A N/A 0.1% 0.1% 14.4% 10.9%
Medi-Cal/Medicare N/A N/A 0.5% 1.4% 11.5% 23.5%
Medicare & Others N/A N/A 0.0% 0.2% 70.6% 60.0%
Other Public 0.2% 0.8% 0.0% 0.9% 0.0% 0.6%
Employment Based 50.1% 44.4% 53.5% 48.0% 0.8% 1.4%
Private Purchase 9.6% 4.9% 10.5% 9.7% 1.1% 0.3%
No Insurance 0.0% 4.4% 18.6% 18.8% 0.0% 1.6%
Source: California Health Interview Survey, 2014. http://ask.chis.ucla.edu/
Sources of Care
Residents who have a medical home and access to a primary care provider improve
continuity of care and decrease unnecessary ER visits. Children and seniors are more
likely to have a usual source of care in SPA 2 than adults 18-64. 87.3% of SPA 2
children and 73.9% of adults have a usual source of care, which are both slightly lower
than county levels; 96.7% of seniors have a source of care, which is higher than the
county level.
26
Henry Mayo Hospital – Community Health Needs AssessmentUsual Source of Care
Ages 0-17 Ages 18-64 Ages 65+
Los Angeles Los Angeles Los Angeles
SPA 2 SPA 2 SPA 2
County County County
Usual Source of Care 87.3% 90.3% 73.9% 79.9% 96.7% 92.3%
Source: California Health Interview Survey, 2014. http://ask.chis.ucla.edu/
When access to care through a usual source of care is examined by race/ethnicity,
Latinos are the least likely to have a usual source of care, followed by African
Americans, then Asians; Whites are the most-likely to have a usual source of care.
Usual Source of Care by Race/Ethnicity
SPA 2 Los Angeles County California
African American 79.5% 85.6% 86.2%
Asian 81.8% 81.8% 85.0%
Latino 77.8% 80.8% 81.7%
White 89.8% 90.7% 91.0%
Source: California Health Interview Survey, 2012-2014. http://ask.chis.ucla.edu/
A doctor’s office, HMO, or Kaiser is the usual source of care for 61.3% of SPA 2
residents; clinics and community hospitals are the source of care for 16.4%. The ER is
a source of care for a small percentage of area residents (1%).
Sources of Care
SPA 2 Los Angeles County California
Dr. Office/HMO/Kaiser 61.3% 57.6% 60.7%
Community Clinic/Government Clinic/
16.4% 23.6% 23.0%
Community Hospital
ER/Urgent Care 1.0% 1.7% 1.4%
Other 1.1% 0.9% 0.7%
No Source of Care 20.2% 16.2% 14.2%
Source: California Health Interview Survey, 2014. http://ask.chis.ucla.edu/
17.2% of residents in SPA 2 visited an ER over the period of a year, which was lower
than the state and county levels (18%). In SPA 2, youth visited the ER at the highest
rates (23.6%), followed by seniors 65 and over (20.9%), both of which were higher than
county and state rates. SPA 2 residents living in poverty (lower than 100% FPL) visit
the ER at lower rates (12.5%) than found in the county or state/
27
Henry Mayo Hospital – Community Health Needs AssessmentUse of Emergency Room
SPA 2 Los Angeles County California
Visited ER in Last 12 Months 17.2% 18.0% 18.0%
0-17 Years Old 23.6% 21.4% 19.5%
18-64 Years Old 13.7% 16.6% 17.3%
65 and Older 20.9% 18.5% 18.9%Even with Community Health Centers serving the area, there are a significant number of
low-income residents who are not served by one of these clinic providers. The FQHCs
and Look-Alikes have a total of 17,877 patients in the service area, which equates to
32.3% penetration among low-income patients and 6.5% penetration among the total
population. From 2012-2014 the clinic providers added 2,459 patients; a 15.9%
increase in patients served by Community Health Centers. However, there remain
37,487 low-income residents, approximately 67.7% of the population at or below 200%
FPL, that are not served by a Community Health Center.
Low-Income Patients Served and Not Served by FQHCs and Look-Alikes
Patients served Low-Income Not
Penetration Penetration of
Low-Income by Section 330 Served
among Low- Total
Population Grantees
Income Patients Population Number Percent
In Service Area
55,364 17,877 32.3% 6.5% 37,487 67.7%
Source: UDS Mapper, 2014. http://www.udsmapper.org
Delayed Care
Residents of SPA 2 delayed or did not get medical care (12.2%) when needed at a
slightly higher rate than the county or state and also showed a higher rate of delayed
and unfilled prescriptions (9.8%).
Delayed Care
Los Angeles
SPA 2 California
County
Delayed or Didn’t Get Medical Care In Past 12 Months 12.2% 11.7% 11.3%
Delayed / Didn’t Get Prescription Meds In Past 12 Months 9.8% 7.9% 8.7%
Source: California Health Interview Survey, 2014. http://ask.chis.ucla.edu/
Community Input – Access to Care
Stakeholder interviews identified the following issues, challenges and barriers related to
access to health care:
Lack of transportation is a barrier to care. People may not be familiar with the bus
system, prefer to get a ride from friends. Currently there are not enough primary
care physicians.
As the Santa Clarita Valley has grown, I don’t know that our general medicine
has kept pace with services needed out here. We don’t have the infrastructure in
place.
It’s hard to connect – you have to be savvy to find resources if someone isn’t
leading you along the way.
Not having insurance or coverage and fear of being identified in a system that
may act adversely toward them. Cultural and language barriers. In our
29
Henry Mayo Hospital – Community Health Needs AssessmentYou can also read