COMPANY PRESENTATION April 2020 - DIC Asset AG
←
→
Page content transcription
If your browser does not render page correctly, please read the page content below
COMPANY PRESENTATION

              April 2020

                           1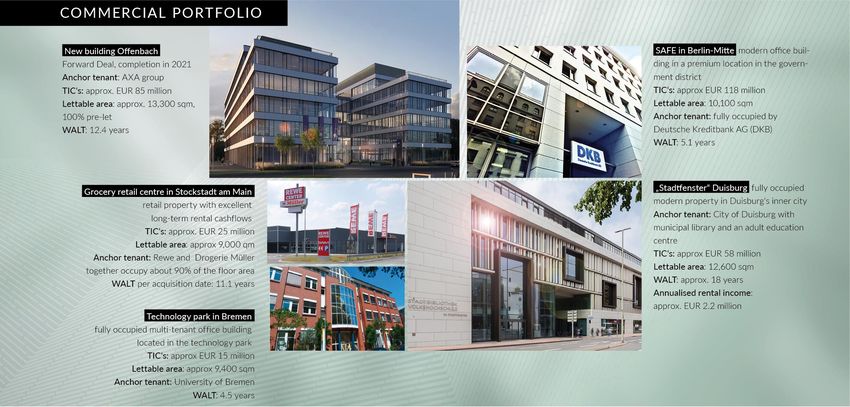
DIC ASSET AG – KEY STRENGTHS

S-DAX listed player in the                 Dynamic           Stable and diversified                         Solid and diversified
commercial real estate                     local expertise   income streams                                 financial structure
market in Germany, fully                   in German         based on two solid
complying to highest                       real estate       revenue pillars,
market standards and                       since 2002        “Commercial Portfolio”
regulations              Experienced                         and “Institutional     Internal asset and                         Highly attractive
                         management team                     Business”              property management                        dividend stock, with
                                                                                    and development                            long track record of
                                                                                    platform with experts                      competitive dividend
                                                                                    in six regional offices                    yield
                                                                                    creating added value

                                                                                                                                             2
1   DIC ASSET AG AT A GLANCE

        DIC ASSET AG AT A GLANCE
2   ASSET AND PROPERTY MANAGEMENT

3   COMMERCIAL PORTFOLIO

4   INSTITUTIONAL BUSINESS

5   FINANCIALS / OUTLOOK

6   SHARE

7   APPENDIX

                                    3
EXPERIENCED MANAGEMENT TEAM
Sonja Wärntges Patrick Weiden Johannes v. Mutius
Chief Executive Officer (CEO) Chief Capital Markets Officer Chief Investment Officer
DIC Asset AG DIC Asset AG DIC Asset AG
Certified economist Certified business administrator Certified business administrator
Excellent management track Capital market expert with a proven Approximately 20 years of
record, various senior positions track record, served as Division experience in senior positions in the
in prestigious companies Head Equity & Debt Capital Markets real estate industry
at Bankhaus Lampe
Long-term experience in the
real estate industry
4
GERMANY-FOCUSED COMMERCIAL REAL ESTATE PORTFOLIO
COMBINED WITH STRONG REAL ESTATE PLATFORM
TOTAL EUR 7.6bn AuM
c. EUR 1.9bn real estate assets c. EUR 5.7bn AuM
Commercial Portfolio Institutional Business
(Balance Sheet Investments) (Managed Accounts)
Attractive and diversified real estate products for
Directly held portfolio of high quality assets in top institutional investors providing steady income
locations Provides all real estate services (transaction, asset,
Steady income from core/core plus and value-add property and development management, sourcing of
properties debt capital)
66% office, 20% retail, 5% logistics and 9% other1 Strong convergence of interests through strategic
co-investments
Property Management and Development
Transactions
Rental income Management Fees Development Fees
Sales profits Transaction Fees Equity Returns
Highly resilient business model with diversified income streams
Note: Financial information based on FY2019
1 Based on rental income FY 2019
5
UNIQUE AND DIVERSIFIED REAL ESTATE BUSINESS MODEL WITH
STABLE AND RECURRING CASHFLOW STREAMS
                                                                               TOTAL EUR 7.6bn AuM
                            Commercial Portfolio                                                                                         Institutional Business

                               EUR 1.9bn
                               Portfolio value
                                                                                                                                                   EUR 5.7bn
                                                                                                                                          Assets under management
                             EUR 101.9m
                        Rental income FY2019                                                                                                       EUR 62.9m
                             EUR 116.6m                                                                                                         Management Fees
                                   EBITDA1
                                                                                                                                                    EUR 5.4m
                                                                                                                                       Equity return on co-investment
                                    6.5%
                               EPRA vacancy                                                                                                        EUR 36.4m
                                                                                                                                                       EBITDA1
                                   6.0 yrs
                                     WALT                                                                                                                  19
                                                                                                                                        Mandates under Management
                               EUR 10.41
                            Rent/sqm./month                                                                                                                75
                                                                                                                                                       Investors3
                                    5.4%
                                 Rental yield                                                                                                              87
                                                                                                                                                      Properties
                                       93
                                  Properties

                                Total adjusted GAV is ~EUR 2.7bn2, including fair value of the Institutional Business
Note: Financial information based on FY2019
¹ Incl. profit from disposal; additional EBITDA contribution from TLG dividend of EUR 11.5m for 2019 not included; 2 Includes property portfolio (EUR 1,900m), equity co-investments (EUR 131m), receivables
from third parties (EUR 131m) and fair value of Institutional Business (EUR 557m); 3 Including pension funds, insurance companies, savings banks, family offices
                                                                                                                                                                                                               6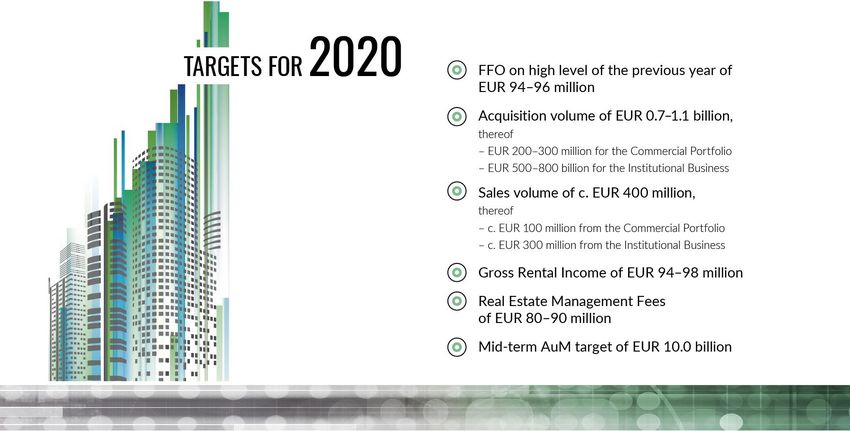
BUSINESS MODEL WITH RECURRING AND DIVERSIFIED INCOME
TLG dividend
EUR12m
Gross rental Rental income is broadly diversified in terms of
income regions, sectors and tenants
EBITDA
Profit from
EUR 165m
disposal of
Sales for portfolio optimisation
investment
Institutional Commercial property
Business Portfolio
EUR36m EUR117m
Fees for asset and property management as well as
property development, capex and lettings:
FV of Correlates strongly with the volume of assets under
Institutional Business management – economies of scale
3
EUR557m Management Transaction and performance fees: Generated on
Institutional Business
fee income top and based on certain activities and events;
includes fees associated with the structuring of
investment products, with acquisitions and sales,
Co-investments and those generated when predefined key
EUR131m2 GAV performance indicators are exceeded, the latter
EUR 2.7bn being one-off performance related
Receivables Commercial
from third Portfolio
parties 1
EUR131m EUR1,900m
Equity Added to this are equity returns generated from
returns minority interests in the Institutional Business
segment
Note: Financial information based on FY2019
1 Fair value of investment properties; 2 Fair value of equity investments; 3 Fair value of the Institutional Business based on audited valuation
7
HIGHLY COMPLEMENTARY DUAL BUSINESS MODEL
Combining balance sheet portfolio with capital light asset management business

                                       Benefits of the combined business model                          Proof of concept

                                                                                                        Avg. size per investment
                                       Strong scale of platform enables faster growth by
                                   1   enlarging the scope of available investment opportunities            EUR 10m-500m

                                                                                                                  AuM
                                       Well-known and proven investor in German real estate with
                                   2   critical market mass                                                   EUR 7.6bn1

           1    +     1   ~   3
                                   3
                                       Purchasing power towards contractors and in transaction
                                       processes
                                                                                                          Transaction volume
                                                                                                           >EUR 2bn in 2019

                                       More efficient use of the integrated real estate management             Synergies
                                   4   platform                                                            EUR 3.5m in 2020

                                                                                                     7 regional offices managing 180
                                       Growing business network through broad market access and
                                   5   established trusted brand for German commercial real estate
                                                                                                      properties with gross leasable
                                                                                                             area of 2m sqm

                                                                                                       Revenue, management fees,
                                   6   Diversification of income streams mitigates business risk
                                                                                                      equity returns, disposal profits

1   Based on FY2019
                                                                                                                                         8
FULLY INTEGRATED REAL ESTATE PLATFORM COVERING THE
ENTIRE STRATEGIC VALUE CHAIN
Regional footprint Regional presence
~250 employees across 7 locations (as of 31.12.2019) DIC has a network of seven offices throughout Germany
With locations in the most important economic centres
and largest real estate markets, DIC has for itself and for
its investment partners direct access to local markets and
(off-market) investment opportunities
North
Office Hamburg With local representation in the various markets, DIC is
able to give its tenants and properties optimised focus and
East attention
Office Berlin
West
Office Düsseldorf
Office Cologne
Central
Office Frankfurt Integrated Real Estate Platform
In comparison with other property companies and
Office Mannheim
investment managers, DIC considers the internal
South
management of the entire strategic real estate value chain
Office Munich
to be fundamental
DIC experts can therefore generate value-add throughout
the entire life cycle of a property
9
OUR REAL ESTATE MANAGEMENT VALUE CHAIN
Inhouse and on site teams as key differentiator in the market
7 offices in Germany responsible for ~180 properties and Gross Lettable area of ~2m sqm
USP Onsite teams operate nationwide to ensure portfolio value is maintained and increased through an active asset management approach
Direct access to tenants, target-oriented letting management, planning and implementation of capex/TI measures
Asset Mgmt.
Asset Mgmt Letting Mgmt.
Letting Mgmt
for Commercial Portfolio and Institutional Business
Owner representation Negotiation of rental contracts in line
Reporting of portfolio/property with business plan
performance Property marketing
Market and risk analysis Space management
WALT Occupancy
Planning of value enhancement Local market access allows
Service approach
measures identifying opportunities at first hand
Due diligence Knowledge of applications
Property life
cycle
Property Mgmt. Development/Technical Property Mgmt.
Tenant support Revitalization/Repositioning concepts
Rental contract mgmt Rents Value for investments with high potential
Active cost mgmt. & service charge for value enhancement
optimization Implementation of service concepts
Property accounting Controlling of capex/TI measures
Steering and controlling of service
providers
10INTEGRATED PLATFORM WITH PROVEN TRACK RECORD
We provide value across the complete real estate life cycle for our own portfolio as well as for
investment vehicles investors
Acquisition/Optimisation Asset and Property Management Refurbishment and repositioning of
Portfolio Management
assets
Coordination of acquisition process by
investment team Potential repositioning of assets,
Asset Management
executed by the development team,
On-going market screening Local property and facility management1 ranging between EUR 30-250m
with access to off-market opportunities Close coordination with letting team in
Refurbishing/capex planning
Investments in Commercial Portfolio and order to perfectly meet
Contract with tenants tenant requirements after pre-letting
Institutional Business enable DIC to
acquire in a large range of individual No greenfield developments
asset sizes (EUR 20-500m)
Selected sales
Increasing rents (2.0% l-f-l rental Value creation
Acquisitions 2019: value of EUR 300m
Commercial growth) Example Wilhelminenhaus Darmstadt:
Selected sales 2019: 11 properties with
Portfolio a value of EUR 154m
EPRA vacancy reduction from 7.2% to property value uplift from EUR 60.5m to
6.5% y-o-y in 2019 EUR 123.5m
Acquisitions 2019: 16 properties for
Asset Management fees of EUR 11.9m2
EUR 1.66bn
Institutional Selected sales 2019: 4 properties with a Property Management fees of EUR Redevelopment of landmark assets
value of EUR 132m 4.6m2
Business Development fees of EUR 14.5m2
Setup fees of EUR 7.8m2 Significant growth through GEG
Performance fees of EUR 13.7m2 acquisition
1 Facility management by external parties; 2 Based on FY2019
11OUR “DYNAMIC PERFORMANCE” APPROACH TO BUSINESS
Creativity Speed Trust
A large real estate player adapting Speed in the transactions as well as Trust in all we do and with all
to markets and being creative in all our internal processes business partners and stakeholders
aspects concerning the property
Examples Examples Examples
Strong corporate finance Fast accounting/reporting season Retaining capital providers and increasing
know-how allowing to focus on business investment volumes of existing investors
in the Institutional Business (59%)
Structuring investment vehicles Speed in acquisitions to secure
Anchor shareholders invested in the
properties in competitive markets
Warehousing company since IPO
Low hierarchies – fast decision Consistent outperformance of
Business model
making operational and financial targets
Financing sources
Entrepreneurial spirit throughout Good and significant relationships with all
Use/redevelopment of real organization German financing institutions
estate/buildings
Allocating the best employees for Established player in the capital markets,
Re-letting alternatives/scenarios fast hiring processes first bond in 2011
ESG topics: Redevelopment vs. Trust of employer and trust of
new construction, protecting employees in the company and the
inner city centres platform
12ORGANIZATIONAL STRUCTURE – FULLY INTEGRATED PLATFORM
Fully integrated platform with ~250 highly skilled employees
FTEs: DIC Asset AG
Management Board
S. Wärntges (CEO/CFO) J. von Mutius (CIO) P. Weiden (CCMO)
Group Management
Corporate Development & Strategy Investor Relations Finance, Accounting, Treasury & Controlling
68 Communication & Marketing Administration
Business segments
Commercial Portfolio Institutional Business
(Balance sheet investments) (Managed accounts)
Investment Portfolio Management Investment Vehicles Management Real Estate Management Development
Acquisitions & Sales Portfolio analysis Structuring new vehicles Property accounting Planning of developments
Due Diligence Portfolio strategy Implementing investment Quality control and refurbishments
34 Business plan modelling Portfolio controlling structures Legal (rental contract law) Key contact to assign
Distribution construction
Legal structuring Letting
Investor liaison
Asset & Property Management
Seven own nationwide operating local offices with regional heads
Berlin Cologne Düsseldorf Mannheim External sources:
145 Hamburg Munich Frankfurt
Facility Management
Technical Property Management
13OUR FULLY INTEGRATED SERVICE MODEL
In-house competence for provision of full suite of value-adding services
Corporate Functions
Acquisition Value enhancement & preservation Exit
Portfolio/Fund Asset Property Investment
Investment Financing Development
Management Management Management Management
Deal sourcing & Review of Portfolio Property Condition Development Contract
structuring financing management strategies control of the and negotiation
structures property refurbishment
Due diligence Structuring of Business plans Closure
know-how
Bank selection, investment Inspections of
Off-market deals Representation
tendering, vehicles technical
and bidding of the owner’s
benchmarking installations
procedures Investor interests
Contract reporting Repairs
Contract Increase in rental
negotiation negotiation & Performance income Object
closure analysis accounting &
Closure Optimization of
Fulfilment of the service charge
Risk & running costs
pay-out settlement
compliance
condition Refurbishments
Administration & Control of
reporting property
management
141 DIC ASSET AG AT A GLANCE
DIC ASSET AG AT A GLANCE
2 ASSET AND PROPERTY MANAGEMENT
3 COMMERCIAL PORTFOLIO
4 INSTITUTIONAL BUSINESS
5 FINANCIALS / OUTLOOK
6 SHARE
7 APPENDIX
15SUPERIOR PLATFORM TRACK RECORD THROUGH THE CYCLE (I)
Strong letting performance and centrally controlled property repositioning
Letting Performance Our internal asset and property management
Commercial Portfolio team is present at six locations in Germany with
Institutional Business c. 150 real estate specialists
Total (2014-2015)
In 2019, letting services with a volume of 211.3
thousand sqm (EUR 32.7 million) were realised, of
which 97.8 thousand sqm relates to the
Institutional Business (EUR 18.4 million).
Implementation of property repositionings
controlled centrally from Frankfurt (own team
in T sqm including architects and engineers):
in EUR Modernisation or conversion of existing
million
properties
Upside potential via refurbishments and
repositioning of existing properties
Complete range of services for all planning
and implementation phases in-house
Expiring
rental
contracts 196.8 181.2 188.3 232.1 143.2 145.5
(in sqm)
16SUPERIOR PLATFORM TRACK RECORD THROUGH THE CYCLE (II)
Transaction Volume 2019 Exceeds EUR 2 billion for the First Time
Transaction Volume Our transaction teams have already surpassed the record
in EUR million figure for 2018 (EUR 1.2 billion) with a transaction volume
of EUR 2.2 billion
On the acquisition side, 21 properties with a total volume of
over EUR 1.9 billion (total investment cost) were purchased:
5 properties for around EUR 0.3 billion for the
Commercial Portfolio
16 properties for around EUR 1.6 billion for the
Institutional Business
On the sales side, the sale of 15 properties with a total value
of around EUR 0.3 billion has been notarised:
11 properties for around EUR 0.2 billion from the
Commercial Portfolio
4 properties with a value of EUR 0.1 billion from the
Institutional Business
17PERFORMANCE OF THE ASSET AND PROPERTY MANAGEMENT (I)
Strong Increase in Average Rent Achieved for Contracts Signed
Letting Structure Average Rent Letting Structure Letting performance in the fiscal
in sqm in Euro/sqm annualised rental income in EURm year 2019 amounted to 211,300
sqm, of which 58% (122,000 sqm)
was attributable to new leases and
42% (89,300 sqm) to renewals
The average rent per sqm of signed
contracts rose significantly by 14%,
from EUR 11.27 to EUR 12.88
Our letting teams were able to
secure agreements with annualised
rental income of EUR 32.7 million
(2018: EUR 35.7 million):
The Commercial Portfolio
Top Lettings Lease Maturity contributed EUR 14.3 million
annualised rental income in % (44%)
The Institutional Business
generated EUR 18.4 million
(56%)
The 2020 lease expiry volume is at
around 5%. Around 64% of leases
expire in 2024 or later
18PERFORMANCE OF THE ASSET AND PROPERTY MANAGEMENT (II)
Selected Acquisitions
19PERFORMANCE OF THE ASSET AND PROPERTY MANAGEMENT (III)
Selected Acquisitions
201 DIC ASSET AG AT A GLANCE
DIC ASSET AG AT A GLANCE
2 ASSET AND PROPERTY MANAGEMENT
3 COMMERCIAL PORTFOLIO
4 INSTITUTIONAL BUSINESS
5 FINANCIALS / OUTLOOK
6 SHARE
7 APPENDIX
21HIGHLY DIVERSIFIED EUR 2 BN COMMERCIAL PORTFOLIO
Top 20 assets with strong core profile – almost fully let with 7.5 years WALT
1 ~EUR 2bn Commercial Portfolio with 93 Type of use1, 2
assets across Germany
Residential Hotel/Restaurant
2 Stable cash flow profile with EUR 102m Logistics 1% 7%
5%
annualised rental income representing current
Taubenstr. 7–9,
Berlin
#1 Top Asset
gross yield of 5.4% Other commercial use
1%
3 Diversified portfolio by asset class and Retail 3
Office
20%
location, focus on Top 7 cities as well as 66%
strong metropolitan areas (“ABBA”)
4 Strong tenant base with long WALT of 6.0
years and no interdependency from single Regional structure of portfolio 1,2
Werdener Str. 4,
Dusseldorf
#2 Top Asset tenant or individual property
Top 7
5 Portfolio KPI’s significantly improved in recent 41%
years
Small - mid
sized cities
6 Positive like-for-like growth of 2% on average 59%
across last 4 years
7 EPRA vacancy rate reduced to 6.5%
Wilhelminenstr. 1–3,
Darmstadt
#3 Top Asset
As per 31.12.2019; 1 Excl. project development and warehousing; 2 By rental income FY2019; 3 Including supermarket and Kaufhof stores
22HISTORICAL DEVELOPMENT OF COMMERCIAL PORTFOLIO
Evolution in numbers: strong development across all KPIs
Average value per property increased since 2017 due to
portfolio optimization…
Number of assets –5.3pp
13.7 14.5 16.8 20.4
11.8%
142 9.5%
113 101 7.2%
93
6.5%
2016 2017 2018 2019
x.x Average value per property (EUR m) 2016 2017 2018 2019
…and significant increase of WALT (including attractive new Positive L-f-l rental growth each year…
acquisitions) L-f-l rental growth %
WALT (Years)
+1.6 yrs 2.7%
5.8 6.0 2.0%
5.1
4.4 1.4% 1.4%
2016 2017 2018 2019 2016 2017 2018 2019
…reflected in rising annualised rental income since 2017… …and again growing portfolio
EUR m Fair value of investment properties (EUR m)
+EUR
6.3m +15.9%
106.3 95.5 97.6 101.8 1,948 1,900
1,639 1,697
2016 2017 2018 2019 2016 2017 2018 2019
1 2017-2019 based on EPRA vacancy rate; 2016 vacancy rate based on sqm
23DIVERSIFIED TENANT BASE AND DURABILITY OF CONTRACTS
LEADING TO PREDICTABILITY IN CASH FLOWS
Independency from Top 10 tenants Overview of lease expiry for Commercial Portfolio
Rental Creditreform 47.0%
income p.a. Rental WALT Credit score Number of
Tenant (EUR m) income (%) (years) rating (S&P) (100–600) assets
1 8.9 8.7% 6.3 n/a 178 3
17.1%
5.3 5.2% 2.0 AA 102 1 9.3% 11.3%
8.0% 7.3%
FHH 5.0 4.9% 10.3 n/a 120 4
2020 2021 2022 2023 2024 2025 onwards
4.3 4.3% 5.1 n/a 196 1
Diversified tenant structure in line with portfolio strategy
4.1 4.0% 7.0 n/a 299 1
by annualised rental income
Others Education
3.9 3.9% 18.7 AA+ 224 2 5% 3%
Hotels/restaurants
Staatl. 6%
Vermögens- Retail/logistics
3.5 3.5% 3.9 n/a 212 2 IT/telco/multimedia
und 26%
Hochbauamt 7%
2.5 2.5% 14.7 n/a 199 2 Industry/disposal/utilities
8%
2.5 2.5% 14.0 n/a 239 2 Banking/insurance Public sectors
11% 18%
1.9 1.8% 19.1 n/a 170 2
Service providers
16%
Top 10 tenants 42.0 41.3% 7.8 n/m n/m 20
Total 101.8 100.0% 6.0 n/m n/m 93 Nearly 1,000 rental contracts for ~830 tenants
As per 31.12.2019, all figures excl. developments and warehousing
1 Including new rental contract from January 2020
24HIGH DIVERSIFICATION AMONG TYPES OF USE
Granular cash flow from stable tenant base in Commercial Portfolio*
Office
% of monthly rental income, as of 29 February 2020
Public
Sector
27% High degree of public sector tenants for
Other
Banks and office spaces (27% of monthly rental
40% EUR 5.2 m Insurance income)
9%
Other Consulting, WALT of 12.0 years for public sector
Financial Marketing,
Services Services
15% 9% Overall WALT of 6.3 years for office
spaces
Retail
% of monthly rental income, as of 29 February 2020
Other Food, Drugstores and Local supply make
Non-food Department
30% Store up 29% of monthly rental income for retail
Textile (Kaufhof) spaces (WALT 3.5 years)
5% 36%
EUR 1.6 m
Drugstore & Kaufhof (36%) with WALT of 6.1 years
other Local
Supply
10% Food
19%
Hotel
% of monthly rental income, as of 29 February 2020 81% of monthly rental income of EUR 0.5 m
stems from two Hotel properties (NH Hoteles
Other in Dusseldorf and Mercure in Frankfurt)
19%
EUR 0.5 m
Former Renaissance Hotel Dusseldorf at
Mercure
12% >80% vacancy, earmarked for redevelopment
NH
Hoteles
69% WALT (excl. redevelopments) 7.5 years
*Diagrams excluding other commercial uses, residential and parking (combined monthly rental income of EUR 0.5 m, as of 29 February 2020) and Logistics (EUR 0.6 m)
25COMMERCIAL PORTFOLIO SEGMENT
Portfolio Quality Further Improved
Development of Commercial Portfolio* As of 31 December 2019, the Commercial
Portfolio comprised 93 properties with a
market value of approx. EUR 1.9 billion
(31 December 2018: EUR 1.7 billion,
101 properties) and rental space of
842,300 sqm
As a result of the strong letting
performance, the EPRA vacancy rate fell
significantly by 70 basis points year-on-
year to 6.5% (31 December 2018: 7.2%)
Annualised rental income rose to EUR
Like-for-like Rental Income 101.8 million (31 December 2018: EUR
EPRA Vacancy Rate WALT
in EUR million* 97.6 million) due to lettings and
in %* in years*
acquisitions, while like-for-like rental
income grew by 2.0% to EUR 88.9 million
The weighted average lease term (WALT)
increased year-on-year from 5.8 years to
6.0 years
261 DIC ASSET AG AT A GLANCE
DIC ASSET AG AT A GLANCE
2 ASSET AND PROPERTY MANAGEMENT
3 COMMERCIAL PORTFOLIO
4 INSTITUTIONAL BUSINESS
5 FINANCIALS / OUTLOOK
6 SHARE
7 APPENDIX
27OVERVIEW OF INSTITUTIONAL BUSINESS
EUR 5.7bn AuM across 19 mandates and long-dated track record of recurring income generation
Breakdown by AuM
19 (EUR 5.7bn)
M andates By Asset Class By Investment partners By Locat ion
AuM of under Family offices, private
EUR 5.7bn M gmt. Other individuals
15% Pension funds
10% Other
Invested 40%
22%
Equity EUR Savings
banks,
2.8bn banks
17%
Avg 4.5% 87
Office
Target IRR Properties 85% Insurance Top 7
companies 78%
33%
Reinvest ment 1 By St ruct ure of Mandat e By Deal St ruct ure By Invest ment St at us
Other
5% Pool Funds
Investment
Closed Separate 40%
Investment in Phase
1 investment investment KG Accounts 39%
vehicle 19% 45%
41% Investment in
>1
investment Open-ended
vehicle fund
Holding
59% 49%
Phase
Investment
61%
KG Club Deal
27% 15%
Unique selling proposition derives from unrivalled real estate expertise & market access, option for warehousing as an additional
accelerator of funds and outsourced regulatory reporting & risk management services (KVG)
Note: Financial information based on FY2019; 1 Breakdown by committed capital (EUR 3.6bn)
28DEAL STRUCTURES TAILORED TO INVESTOR NEEDS
EUR EUR EUR
2.3bn 0.9bn 2.6bn
Pool funds Club deals Separate accounts
Pool funds specialized in regions Investments for institutional We initiate joint investment
or asset classes with a proven investment partners in real estate strategies for selected
track record in Germany's top 10 markets for investment partners within the
commercial real estate, either in framework of individual
Funds legally structured as special
single-asset or portfolio mandates
funds under the German or
transactions
Luxembourg regime The investment strategies may
GEG secures property(ies) in not interfere with the existing
Joint investments with investment
order to mitigate the transaction pool funds and club deals
partners, co-investment by DIC
uncertainty; the investment
Strong individual property size partners then join
Typically a portfolio of 7-8 Joint investments with investment
properties acquired over time partners, co-investment by DIC
Individual property size EUR 20-60m Individual property sizes Individual property sizes
Typically a portfolio of 7-8 properties Typically 2-3 properties with 2-3 Typically individual property; no
acquired over time institutional investors portfolio investments
=AuM (2019)
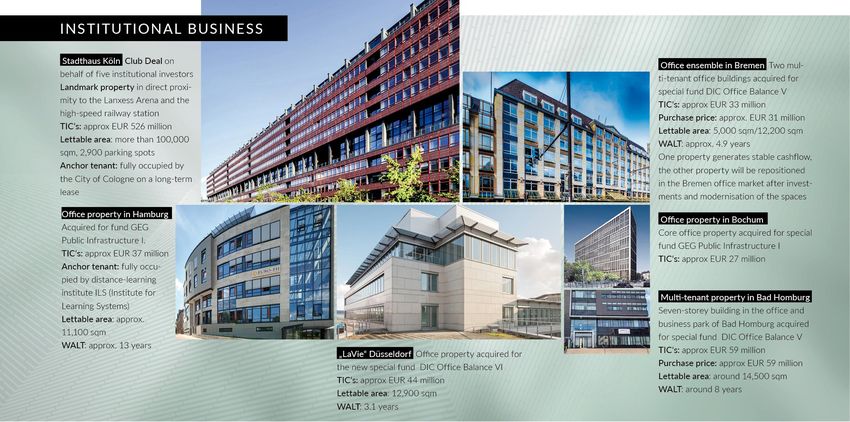
29PORTFOLIO SPOTLIGHT
Strong focus on CORE assets in Top 7 locations
Hamburg, Berlin,
Dusseldorf, Dortmund Frankfurt,
Stadthaus, Opera Offices:
CABO: HCC: Type: Fee IBC Campus: Pressehaus
Cologne: Type: Club Alexanderplatz:
Type: Manage- Type: Club Type: Manage- development
to-core (value) (finished) deal Type: Individual
to-core (value) deal
mandate
Dusseldorf, Frankfurt, Global
Business Campus Hamburg Tower:
am Park: Type: Individual mandate
Type: Club deal (under refurbishment)
Berlin
Frankfurt,
Neuss, Police RIVERPARK
Training Center: Tower & Suites:
Type: Infrastructure fund Type: Individual mandate
(under refurbishment)
Dusseldorf Frankfurt,
Cologne, Triforum: Cologne
Villa Kennedy:
Type: Club deal Type: Individual
mandate
Frankfurt
Mainz, DB Frankfurt,
Cargo- Garden Tower:
Headquarter: Type: Individual
Type: Infrastructure mandate
Munich
Frankfurt,
Frankfurt, Japan
Schillerportal:
Center: Type: Individual
Type: Individual mandate mandate
Munich, Junges Munich,
Frankfurt, Frankfurt,
Quartier Munich, Pasing
WINX: Sapporo- Eurotheum:
Obersendling: Central:
Type: Fee bogen: Type: Individual
Type: Opportunistic
development Type: Infrastructure mandate
Type: Club deal
fund
DIC office location
Asset location
30IMPLEMENTATION OF THE INVESTMENT STRATEGY
Typical Institutional Business investment case
Sale
Sales period begins after
approx. 8-10 years
Reinvestment of proceeds
into new investment
vehicles
Holding or sale & reinvestment
Acquisition Execution of the respective, individual property strategy for
the realisation of value enhancement potential
Acquisition financed with committed equity and After repositioning, the now optimised properties are
bank financing at 45% LTV on purchase price managed and a stable cash flow is ensured
Occasionally warehousing of selected assets as an Optionally, some of the stabilized properties can be sold and
accelerator of funds the capital released reinvested in the investment vehicle
Management fee elements
Promote/performance fee
Asset/property management/
Acquisition and setup fee (one time, success based)
development fee
(one time, not success based - recurring) Exit fee
(recurring)
(one time, not success based - recurring)
31HIGHLY PROFITABLE INVESTMENT MANAGEMENT BUSINESS
Institutional Business Volume (AuM) Market value of equity investments in Institutional Business
in EUR bn in EUR m
CAGR
c.63.4% Sale of a co-
5.7 investment
155.6
3.9
129.9 130.7
96.6 99.4
1.5
1.1
0.8
2015 2016 2017 2018 2019 2015 2016 2017 2018 2019
Income from Institutional Business
in EUR m Share of profit of associates without project developments and sales Transaction- and Performance Fees Asset-, Property Management and Development Fees
CAGR
c.52.4% 68.3
31.7
39.2
11.8
23.5
21.2
31.2
8.5 10.8 21.8
8.3
5.6 10.3 10.0
2.7 2.4 2.7 5.6 5.4
2015 2016 2017 2018 2019
Steadily increasing income generation from Institutional Business, with strong visibility across different recurring income streams
32RECURRING FEE INCOME FROM INSTITUTIONAL BUSINESS
Types of fees Recognition of fee income Classification
Warehousing income
Setup1
Sourcing/ Set up fees for new investment vehicles
Transaction
acquisition
Transaction fee income recognised as
Acquisition
percentage of transaction volume
Real Estate investment lifecycle
Asset / property Recurring fee income recognised as
management percentage of AuM
Investment/ Asset / property
property management management / development
Repositioning of office and retail projects
Development
recognized as percentage of construction cost
Transaction fee income recognised as
Sales fees Transaction
percentage of transaction volume
Exit/ Income recognized upon successful exit of
Promote
Realisation sale of the properties
Performance
Fee payable when return hurdles of
Performance fees
investment vehicle are met or exceeded
Recurring (not success based) One-time (success based)
Source: Company information
1Setup fee for new investment vehicles where DIC secure 1-2 properties as start assets for the investment vehicle; 2 Based on 2019 reporting and excl. earnings transfer from previous year (accounting
adjustment)
33EQUITY RETURNS– DIC PARTICIPATES ALONGSIDE OTHER INVESTORS
IN CERTAIN INVESTMENT VEHICLES (ESPECIALLY POOL FUNDS)
Equity return
from co-investments Recognition of equity return Classification
Regular equity return from own investment
Equity return in DIC investment vehicles (fixed return Equity return
levels)
Dividend
Gain in value of equity stake in investment
Return upside Equity return
vehicle following positive performance
Recurring (not success based) One-time (success based)
341 DIC ASSET AG AT A GLANCE
DIC ASSET AG AT A GLANCE
2 ASSET AND PROPERTY MANAGEMENT
3 COMMERCIAL PORTFOLIO
4 INSTITUTIONAL BUSINESS
5 FINANCIALS / OUTLOOK
6 SHARE
7 APPENDIX
35HIGHLIGHTS FY 2019
AuM of +40% FFO y-o-y New Transaction Record
EUR 7.6 EUR 95 million
achieved, in line with
EUR 2.2. billion achieved,
thereof EUR 1.9 billion
billion guidance acquisitions
Gross Rental Income Valuation Result
EUR 102 million achieved, +7.0% uplift in Commercial
slightly above guidance Portfolio, total AuM +11.1%
Real Estate Loan-to-value
Management Fees declines by 530 bp to 47.8%
up +87% to EUR 63 million
Adjusted NAV Dividend Proposal
reaches EUR 22.26 EUR 0.66 per share,
per share increase by 38% y-o-y
36FUNDS FROM OPERATIONS
Strong Growth of FFO in 2019
Reconciliation to FFO FFO per share FFO rose by c. 40% to
in EUR EUR 95.0 million, mainly as a result of
significantly higher real estate
management fees (acquisition-driven),
an increase in the share of the profit of
associates, higher net rental income
and improved net interest result. The
transaction-related increase in
operating expenses had an offsetting
effect
FFO per share increased by 36% to
EUR 1.32 (adjusted pursuant to IFRS;
2018: EUR 0.97)
37SEGMENT REPORTING
Funds from Operations in 2019 at Record High
FFO Contribution of the Segments FFO from the Commercial Portfolio
increased by 9% to EUR 47.5 million,
mainly as a result of higher net rental
income
FFO margin of Commercial Portfolio
equals c. 47% (in relation to gross rental
income of EUR 101.9 million)
FFO from the Institutional Business
increased by 66% to EUR 37.6 million,
due to sharp increase in management fee
income after platform expansion through
Segment Reporting acquisition of GEG and transaction
in EUR million activities in second half of 2019
FFO margin of Institutional Business
equals c. 55% (in relation to the sum of
EUR 62.9 million management fees and
EUR 5.4 million share of profit from
associates)
FFO contribution from last TLG dividend
equals EUR 9.9 million (2018: EUR 1.8
million)
38ADJUSTED NET ASSET VALUE
Reconcilation of EPRA-NAV to Adjusted NAV incl. Fair Value of the Institutional Business
EPRA-NAV
EPRA-NAV excluding the valuation of cash flows from real
estate management services amounted to EUR 1.244 billion
as of 31 December 2019 (31 December 2018:
EUR 1.086 billion), representing an increase of around 15%
Based on an audited DCF valuation of our Institutional
Business, an additional value of EUR 557 million,
respectively EUR 7.71 per share is included in the
Adjusted NAV
Of this amount, EUR 194 million (or EUR 2.68 per share)
has already been included in the EPRA-NAV calculation via
the goodwill of GEG and other intangible assets/liabilities
The remaining portion reflects the unrecognized value of
real estate management services and leads to an Adjusted
NAV per share of EUR 22.26 as per 31 December 2019
39SOLID FINANCIAL PROFILE DUE TO CONSERVATIVE FINANCIAL
POLICY AND SUCCESSFUL PORTFOLIO OPTIMISATION
LTV1 Average interest rate2 Financial profile has been significantly
(%) (%) strengthened in the last 5 years
-530bp
-170bp LTV1 decreased to 47.8% in 2019,
3.7 3.7 marking a drop of 5.3pp y-o-y and a
62.6% 59.9% 57.0% total decline of 14.8pp over the past 5
53.1% 2.6 2.5
47.8%
2.0 years
The average interest rate on loans and
borrowings decreased by 10bps in the
last 5 years, reflecting successful
2015 2016 2017 2018 2019 2015 2016 2017 2018 2019 optimization of the capital structure
The interest cover ratio (ICR, the ratio
of adj. EBITDA to net interest result)3
improved significantly to 3.8x in 2019,
Net ICR3 Net debt/EBITDA4 compared to ICR of 1.7x 5 years ago
(x) (x)
Net debt/EBITDA4 decreased
14.2x significantly by ~2.0x from 2018 to
10.8x 11.5x 2019, showing continued commitment
3.8x 10.1x 9.4x to deleveraging
2.8x
1.9x 5 2.3x
1.7x
2015 2016 2017 2018 2019 2015 2016 2017 2018 2019
1LTV as reported; excl. warehousing; 2 Based on total interest bearing liabilities; 3 Net ICR calculated as net interest expense over adj. EBITDA (excl. profit on disposal); 4 Net debt/EBITDA calculated as interest
bearing financial liabilities minus cash over EBITDA (excl. profit on disposal); 5 Excludes one off financing cost of EUR 56.3m
40FINANCIAL STRUCTURE
Significant Strengthening of Financial Profile
Maturities of Financial Debt Composition of Financial Debt Repayment of 14/19 Bond with a
as at 31.12.2019, incl. bonds/IFRS 5 in EUR million volume of EUR 175 million and a
coupon of 4.625% in September 2019
In July 2019, issue of a promissory
note with a total volume of EUR 150
million and tap by another EUR 30
million in November, average interest
rate of 1.55%
At the beginning of December,
initiation of Commercial Paper
Program with an issuance of EUR 40
million for three months with 0.1% p.a.
41REVISED FORECAST 2020 DUE TO COVID-19 PANDEMIC
42DIC’S MID-TERM GROWTH TARGET
Further Growth of Real Estate Platform in Germany
Growth of Assets under Management and FFO Further growth is planned in both segments
Commercial Portfolio and Institutional Business –
with a mid-term goal of Assets under Management
of c. EUR 10 billion
Strategic mid-term target of maintaining a 50:50
FFO balance between the Commercial Portfolio and
the institutional Business
431 DIC ASSET AG AT A GLANCE
DIC ASSET AG AT A GLANCE
2 ASSET AND PROPERTY MANAGEMENT
3 COMMERCIAL PORTFOLIO
4 INSTITUTIONAL BUSINESS
5 FINANCIALS / OUTLOOK
6 SHARE
7 APPENDIX
44CAPITAL INCREASE IN JANUARY 2020
Successful 9.49 % Capital Increase from Authorized Capital for Further Growth
Shareholder Structure after Capital Increase Increase of share capital by 9.49% by issuing
6,857,774 new shares; statutory subscription
rights of shareholders were excluded
New shares with the same rights as the
existing shares (qualified for dividend for
fiscal year 2019)
Placed at EUR 16.00 per share
Gross proceeds of approx. EUR 110 million
available for further growth, especially
purchases for the Commercial Portfolio
New number of total shares: 79,071,549
(since 21 January 2020)
Trading of new shares in regulated market
(Prime Standard) since 24 January 2020
All percentages in shareholder structure as of the day of the last voting rights announcement
451 DIC ASSET AG AT A GLANCE
DIC ASSET AG AT A GLANCE
2 ASSET AND PROPERTY MANAGEMENT
3 COMMERCIAL PORTFOLIO
4 INSTITUTIONAL BUSINESS
5 FINANCIALS / OUTLOOK
6 SHARE
7 APPENDIX
46INCOME STATEMENT 2019
Profit for the Period driven by Strong Growth in All Earnings Streams
1 Gross rental income of EUR 101.9 million up 2% y-o-y (2018: EUR 100.2 million)
and above EUR 98–100 million guidance range as a result of successful asset
1 management activities
2 2 Profit on disposal of properties increased by more than 100% mainly due to
profitable disposals from Commercial Portfolio in the fourth quarter 2019
3 Real estate management fees significantly up 87% to EUR 62.9 million
3 (2018: EUR 33.6 million), driven by the GEG acquisition and subsequent AuM
growth. AM/PM/Development fees increased by 62% to EUR 21.0 million
4 (2018: EUR 13.0 million) while Transaction/Performance fees more than doubled
to EUR 41.9 million (2018: EUR 20.6 million) due to higher transaction volume
4 The share of the profit of associates increased by 16% to EUR 18.3 million
(2018: EUR 15.8 million), incl. contribution from TLG dividend of EUR 12.9 million
5 for the last time (2018: EUR 10.2 million)
5 Operating expenses rose by 51% to EUR -45.8 million (2018: EUR -30.3 million),
driven by the integration of GEG. This figure includes one-off transaction costs of
EUR 3.4 million
6 Net interest result improved to EUR -32.4 million (2018: EUR -36.8 million) as a
result of higher interest income and better financing conditions
6 7 Profit for the period rose by 70% to EUR 80.7 million (2018: EUR 47.6 million) due
to the increase in real estate management fees and the higher disposal profit
7
47BALANCE SHEET PER 31.12.2019
Increase in Total Assets due to Acquisitions
1 Total assets as of 31 December 2019 rose by EUR 167.3 million, mainly due
to the increase of investment properties from net acquisitions for the
Commercial Portfolio (+ EUR 164.0 million)
1 2 Non-current assets increased slightly by EUR 19.0 million, main changes
compared to 31 December 2018:
Other Investments decreased by EUR 329.0 million after the
2 disposal of the TLG shares
Goodwill increased by EUR 177.9 million after the GEG acquisition
3 Investment properties increased by EUR 164.0 million
3 Current assets increased by EUR 148.3 million mainly due to GEG assets, an
4 increase in the cash position after financing activities (especially promissory
note and commercial paper issues), and an increase in non-current assets
held for sale (in respect of assets held for the Institutional Business segment)
4 Total equity rose by a total of EUR 72.9 million to EUR 968.8 million as a
5 result of the strong profit for the period and the increase in capital reserves
recorded in connection with the scrip dividend (cash dividend had an
offsetting effect)
5 Total loans and borrowings increased by approx. EUR 31.1 million y-o-y to
EUR 1,512.2 million (31 December 2018: 1,481.1 million), mainly due to the
following changes:
decrease of corporate bonds position after repayment of the
6
14/19 bond
increase of financial liabilities after the promissory note and
commercial paper issues
6 At 36.5%, the equity ratio is improved compared to 31 December 2018,
despite an increase in total assets
48EUR 2.7BN OF TANGIBLE GAV CAPTURES ASSET VALUE OF
COMMERCIAL AND INSTITUTIONAL BUSINESS
in EURm 31.12.2019
Loan to value (LTV)
Assets
Book value of investment properties 1 1,623.0
1 Book value of investment properties Fair value adjustment 277.0
(Commercial Property segment) Fair value of investment properties, total1 2 1,900.0
Fair value of investment properties Fair value of equity investments (indirect property) 3 130.7
2 Goodwill 177.9
based on an audited valuation1 4
Service agreements 5 40.8
3 Fair value of equity investments (indirect Carrying amount of receivables from third parties 6 130.5
property) including equity interest in
associates and other investments Fair value of assets (value) A 2,379.9
4 Deduct goodwill (177.9)
Goodwill related to acquisition of GEG Deduct service agreements (40.8)
5
Service agreements are intangible assets Add fair value of Institutional Business 7 557.0
recognised as within the scope of the
Adjusted fair value of assets (value) B 2,718.9
purchase price allocation following the
acquisition of GEG Liabilities
6 Carrying amount of receivables from
Non-current liabilities to banks 967.4
related parties Current liabilities to banks 178.9
Related party liabilities 16.6
MainTor EUR 89m Corporate bond 324.9
RETT Blocker Unite Portfolio +EUR 36m Less cash and cash equivalents -351.2
Net liabilities (loan) C 1,136.5
Other +EUR 5m
Total =EUR131m LTV2 (=C/A) 47.8%
Adjusted LTV2 (=C/B) 41.8%
Thereof EUR 120m non-current
7
Fair value of Institutional Business based Accounting for capital increase of EUR 107m (January 2020):
LTV2 (=(C-EUR 107m)/A) 43.2%
on audited valuation Adjusted LTV2 (=(C-EUR107m)/B) 37.9%
Adjusted GAV sums up to EUR 2.7bn, accounting for fair value of Commercial Portfolio and Institutional Business segment
LTV (2019) of 47.8%2, reduced by 530 basis points compared to 2018 due to optimized financing structure and increased market value of
Commercial Portfolio assets
Adjusted LTV (2019) of 41.8%2 including fair value of Institutional Business segments
1The fair values calculated (net value after deducting transaction costs) are based entirely on the findings of the independent valuers contracted for this purpose, Cushman & Wakefield, Jones Lang LaSalle and
ENA Experts, who have undertaken a valuation in accordance with internationally recognised standards; 2 LTV excl. warehousing
49TOP 20 ASSETS IN COMMERCIAL PORTFOLIO*
As at 31.12.2019
50REAL ESTATE PLATFORM: CASE STUDIES (COMMERCIAL PORTFOLIO)
Transformational refurbishments and repositioning in Darmstadt and Frankfurt
“Wilhelminenhaus” Darmstadt
Renewal with state of Hesse (19y) Before modernization KPIs (30.11.2017)
Market value (EUR m) 60.5
Capex & TI EUR 31.9m WALT (years) 3.3
Vacancy (%) 0.0%
Energy savings of 40%
Ann. rental income (EUR m) 4.3
– Large photovoltaic system on the roof Yield 7.1%
– Better thermal insulation
– New windows
– New solar shadings system Improved KPIs (30.04.2020)
Handicap – accessibility improved Market value (EUR m) 123.5
Value creation (EUR m) 13.6
Complete renovation, energy modernisation and structural WALT (years) 16.8
alterations for handicap accessibility Vacancy (%) 0.0%
Ann. rental income (EUR m) 4.5
Energy savings of around 40 %
Yield 4.2%
“Lighthouse” Frankfurt
Former Deutsche Boerse headquarters Before modernization KPIs (31.12.2017)
transformed to multi-tenant use Market value (EUR m) 33.5
WALT (years) 3.4
15-years lease with BG BAV (Public tenant) for Vacancy (%) 78.5%
50% of spaces, other 50% for tenant mix Ann. rental income (EUR m) 0.7
Yield 2.1%
Capex & TI of EUR 7.2m
Improved KPIs (31.12.2019)
Transformational project Market value (EUR m) 50.8
Value creation (EUR m) 10.1
Repositioning the asset after former tenant had left
WALT (years) 8.9
Steady decrease of vacancy from Vacancy (%) 0.5%
~80% to 0% in 2 years Ann. rental income (EUR m) 2.4
Yield 4.7%
51REAL ESTATE PLATFORM: CASE STUDIES (COMMERCIAL PORTFOLIO)
Restructuring of KAISERPASSAGE, Frankfurt Property
Status Quo Pre-Refurbishment
Small-scale retail business (49 stores located in the arcade)
Short lease terms, and therefore high rate of tenant fluctuation
Increased capex requirements due to the age of the building, raised in the 1950s-1960s
Management Approach
Restructuring and redesigning the retail units/arcade, straightening the arcade passage
Merging same rental units 97%
Units pre-let
Modernising the lightning concept, facade and shop frontage prior to
construction
Total Capex & TI of EUR 25.5m start
Rental income Vacancy rate WALT Market value
in EUR m p.a. in % years in EUR m
>100% (42.3)pp +10.5 x3.5
43,9% 56,5
2,1 12,4
0,8 16,2
1,9
1,6%
Pre 2019 Pre 2019 Pre Current Pre 2019
refurbishment refurbishment refurbishment refurbishment
52REAL ESTATE PLATFORM: CASE STUDIES (INSTITUTIONAL BUSINESS)
Office Balance fund series – BKA Wiesbaden
Overview of “BKA Wiesbaden” repositioning / refurbishment
Repositioning of 25,000 sqm property after previous anchor tenant AXA moved out
Successful letting to single public-sector in its entirety with lease until 2030
Restructuring work completed on time and new tenant Federal Criminal Police Office
(BKA) will move in end of Q1 2020
Total Capex & TI of EUR 29.5m
Rental income Vacancy rate WALT
in EUR m p.a. in % years
>80% +10.0 x1.9
123,
6,1 10,0 5
3,4 66,5
0% 0% 0,0
Pre repositioning 2020 Pre repositioning 2020 Pre repositioning 2020 Pre repositioning 2020
53SUSTAINABILITY STANDARDS
ESG Milestones and future targets Green building principles
We have a proactive and long term approach to environmental sustainability, aiming to
Environment
reduce CO₂ emissions and minimize resource and costs of consumption
Energy and cost-effective management of our real
estate
1 Overview of reporting activities
Regular sustainability report since 2011 Long-term approach to upgrades of existing buildings
GRI standards and EPRA SBPR reporting standards for increased transparency and to project developments
and international comparability
Optimisation and reduction of CO₂ emissions and
Regular response to carbon disclosure project
resource consumption
DVFA governance score in lower MDAX range
2 Highlights Society
Accelerated reporting processes relative to wider peer universe
Developing a positive corporate culture along with a
Smart-meter roll-out for additional improvements in data collection and analysis
safe and pleasant working environment
Energy supply contracts re-tendered for gradual conversion of Commercial
Cultivating long-term partnerships
Portfolio to 100% green electricity
Implementation of stakeholder approach and calculation of economic value Handling historically evolved neighbourhoods
generated and distributed according to GRI respectfully
Sponsoring charitable and social commitments to
promote the common good
Global Tower
(Frankfurt) Economy
DIC targets the highest Investments in sustainable value-added through
certification (DGNB acquisitions and redevelopments of existing buildings
Platin) at completion for
IBC Campus ( Frankfurt) all properties in Stable long-term cashflows on the basis of an optimised
Frankfurt obtained LEED-Gold development (e.g., diversified real estate portfolio
score in 2019 TOWER Frankfurt) Balanced financial structure with a long-term horizon
Proactive approach to ESG showcased by reporting on sustainability matters for close to 10 years
Integration of ESG principles into normal course of business with sustainability focused re-development projects
54CONTACT / FINANCIAL CALENDAR
Head of Investor Relations & 30.04.20 Publication Quarterly Statement Q1 2020
Corporate Communications 29.07.20 Publication Half-Year Report 2020
phone: +49 69 94 54 858-1492 18./19.08.20 BHL German Conference 2020, Baden-Baden
fax: +49 69 94 54 858-9399 10.09.20 SRC Forum Financials & Real Estate 2020, Frankfurt
e-mail: ir@dic-asset.de 22.09.20 Berenberg/Goldman Sachs
German Corporate Conference, Munich
23.09.20 Baader Investment Conference, Munich
01.10.20 Commerzbank German Real Estate Forum, London
28.10.20 Publication Quarterly Statement Q3 2020
11/20 Deutsches Eigenkapitalforum, Frankfurt
Investor Relations Manager
11/20 DZ Bank Equity Conference 2020, Frankfurt
phone: +49 69 94 54 858-1465
fax: +49 69 94 54 858-9399
e-mail: ir@dic-asset.de
55DISCLAIMER
This publication constitutes neither an offer to sell nor a solicitation to buy or subscribe to any securities. In case of an offer of securities the information legally
required to be provided to investors will be contained only in a securities prospectus as approved by the competent authority. The information contained herein
is not for distribution, directly or indirectly, in or into the United States of America (including its territories and possessions of any State of the United States of
America or the District of Columbia) and must not be distributed to U.S. persons (as defined in Regulation S of the U.S. Securities Act of 1933, as amended
("Securities Act")) or publications with a general circulation in the United States of America. This publication constitutes neither an offer to sell nor a solicitation
to buy or subscribe to any securities in the United States of America. None of the securities of DIC Asset AG have been registered under the Securities Act and
may not be offered or sold in the United States of America absent registration or an exemption from registration under the Securities Act.
This publication is only addressed to and directed at persons in member states of the European Economic Area who are "qualified investors" within the meaning
of Article 2(1)(e) of the Prospectus Directive (Directive 2003/71/EC as amended) ("Qualified Investors"). In addition, in the United Kingdom, this publication is
being distributed only to, and is directed only at, Qualified Investors who (i) are persons who have professional experience in matters relating to investments
falling within Article 19(5) of the Financial Services and Markets Act 2000 (Financial Promotion) Order 2005, as amended (the "Order"), (ii) are high net worth
entities falling within Articles 49(a) to (d) of the Order, or (iii) other persons to whom it may otherwise lawfully be communicated. This presentation should not
be regarded by the recipient as a substitute for the exercise of its own judgment. Nothing contained herein is, or shall be relied upon as, a promise or
representation as to the past or future. No representation or warranty, expressed or implied, is made as to, and no reliance should be placed on, the fairness,
accuracy, completeness or correctness of the information, or opinions contained in this presentation. Neither DIC Asset AG nor any of its advisors or
representatives shall have any responsibility or liability whatsoever (for negligence or otherwise) for any loss howsoever arising from any use of this document
or its contents or otherwise arising in connection with this presentation.
This presentation speaks as at the date hereof (unless an earlier date is otherwise indicated in the presentation) and in giving this presentation, no obligation is
undertaken and nor is any representation or undertaking given by any person to provide the recipient with additional information or to update, revise or
reaffirm the information contained in this presentation or to correct any inaccuracies therein which may become apparent. This presentation may contain
certain forward-looking statements, forecasts, estimates, strategic targets, projections and opinions ("Forward Statements"). No representation is made or will be
made that any Forward Statements will be achieved or will prove to be correct. Actual future results and operations could vary materially from the Forward
Statements. Similarly no representation is given that the assumptions disclosed in this presentation upon which Forward Statements may be based are
reasonable.
UNLESS EXPRESSLY STATED OTHERWISE, ALL INFORMATION, DATA, VIEWS AND FORWARD-LOOKING STATEMENTS CONTAINED IN THIS COMPANY
PRESENTATION ARE BASED ON INFORMATION, DATA AND FORECASTS AVAILABLE TO THE COMPANY AT THE TIME OF THE PUBLICATION OF THIS
COMPANY PRESENTATION. THE COMPANY IS NOT OBLIGED TO UPDATE THIS COMPANY PRESENTATION UNDER RELEVANT LAWS AND THEREFORE
WILL NOT UPDATE THIS COMPANY PRESENTATION WHATSOEVER. ALL INFORMATION AND DATA CONTAINED IN THIS COMPANY PRESENTATION
ARE BASED ON INFORMATION AND DATA, WHICH WAS PREVIOUSLY PUBLISHED BY THE COMPANY IN CONNECTION WITH ITS CONTINUOUS
REPORTING OBLIGATIONS UNDER RELEVANT FINANCIAL OR SECURITIES LAWS.
Company presentation as of April 2020
56You can also read