Investor Presentation - January 2020 - Investor ...
←
→
Page content transcription
If your browser does not render page correctly, please read the page content below
Investor Presentation
January 2020
Agenda
 Equity Story & Market Fundamentals              Sustainability                 9M 2019 Business Update    Additional Information

 Equity Story                   Sustainability                    9M 2019               Additional
      &                                                           Business             Information
                                                                                                          See Page Finder on
   Market                                                          Update                                 page 72 for detailed
Fundamentals                                                                                                    agenda

                                                                                       pages 41-70
      pages 2-20                       pages 21-26                pages 27-45            pages 46-72

Investor Presentation – January 2020                                   page 2
Europe’s Leading Owner and Operator of Residential Real Estate
     Equity Story & Market Fundamentals                                      Sustainability                                   9M 2019 Business Update                                     Additional Information

         Long-term owner and full-scale                                                              Geographic split                                                                                       Stockholm
                                                                                                                                                                                            38k
                                                                                                                                                                                                            Gothenburg
                                                                                                            9%                                                                          apartments1           Malmö
         operator of Europe’s largest listed
                                                                                                     6%

         multifamily housing portfolio with
                                                                                                                                                                                                              15 urban
                                                                                                                                                                                           356k                growth
         ca. 415k apartments for small and                                                                                                                                              apartments2           markets

         medium incomes                                                                                                 85%

                                                                                                                                                                                                                Mainly
         ~€50bn fair market value                                                                                                                                                          23k                  Vienna
                                                                                                                                                                                        apartments
                                                                                           Germany             Austria         Sweden
         ~€26bn market capitalization

     Growing recurring cash earnings per share and DPS                                                                Two types of sustainable shareholder returns6
      Dividend policy: ~70% of recurring cash earnings are distributed as dividends

                                                                                                  2.243                                                               9.2%                  9.3%
                                                                                   2.06                                                                                                                           8.4%
                                                                   1.90
                                                   1.63                                                                                         7.1%
                                                                                                         1.574
                                                                                          1.44                                                                        5.6%
                                   1.30                                   1.32                                             5.4%                                                             6.1%                  4.8%
                                                          1.12                                                                                  3.8%
    0.95            1.00                  0.94
                           0.74                                                                                            2.6%
           0.67

                                                                                                                           2.8%                 3.3%                  3.6%                  3.2%                  3.6%

      2013            2014            2015           2016            2017            2018           2019E                  2014                 2015                  2016                  2017                  2018

                       Recurring cash earnings ("FFO")5                         Dividend                                                  Dividend yield               Organic asset value growth
1   Pro forma incl. Hembla. 2 Incl. 28k apartments in other strategic locations plus 4k in non-strategic locations that are not shown on the map. 3 Based on upper end of guidance, as indicated. 4 To be proposed to the next AGM
     in May 2020. 5 2013-2018 FFO is “FFO1” and 2019 FFO is “Group FFO.” 6 Dividend yield plus l-f-l organic asset value growth from operating performance and investments (excluding yield compression).
Investor Presentation – January 2020                                                                         page 3
Highlights of Vonovia’s Unique Business Drivers
 Equity Story & Market Fundamentals      Sustainability               9M 2019 Business Update      Additional Information

                            Megatrends                                                B-to-C Business

                                                               Granular B-to-C operating business on the back
   Long-term focus built around the megatrends
                                                                of multifamily housing for small and medium
       urbanization, energy efficiency, and
                                                                incomes with ca. 13 years average customer
              demographic change
                                                                     retention (average lease duration)

                     Full-scale Operator                             Standardization & Industrialization

   Full service provider with insourcing strategy                  Unparalleled track record of industrialization,
   for best-in-class service levels and maximum                       standardization, and optimization of a
           process control and efficiency                             homogeneous and scalable asset class

        Resilience & Downside Protection                             Two Types of Shareholder Returns
    Resilient and largely predictable top- and
                                                                          Sustainably growing dividends
  bottom-line growth in regulated markets with
                                                                                         +
      structural supply/demand imbalance.
                                                                    Organic value appreciation of real estate
      Robust business model with downside
                                                                   portfolio from rent growth and investments
 protection plus additional upside potential from
            acquisition opportunities

Investor Presentation – January 2020                      page 4
Consistent Strategy with Strong Track Record since IPO
 Equity Story & Market Fundamentals         Sustainability            9M 2019 Business Update    Additional Information

                                           Reputation & Customer Satisfaction

                                       PROPERTY MANAGEMENT Efficient operations of scalable business via
                                       industrialization, standardization and optimization

                                           FINANCING Solid and diversified capital structure that allows
                                           access to capital at any point in time

                                               PORTFOLIO MANAGEMENT The right product in the right
  Long-term owner and                          location plus investments to support organic growth
   full-scale operator of
  Europe’s largest listed
    multifamily housing                        VALUE-ADD Leverage B-to-C customer relations to enhance
  portfolio for small and                      cash flows through internal savings and additional income
     medium incomes

                                           MERGERS & ACQUISITIONS Seize and identify accretive
                                           acquisition opportunities within clearly defined acquisition criteria

                                       EUROPEAN ACTIVITIES Measured roll out of Vonovia’s unique business
                                       model to selected European metropolitan areas

Investor Presentation – January 2020                         page 5
Vonovia Operates and Manages Four Segments
 Equity Story & Market Fundamentals           Sustainability                  9M 2019 Business Update         Additional Information

             Rental                         Value-add                         Development                  Recurring Sales
                                                                              Construction of
                                         Ancillary service
         Efficient                                                            apartments for                   Disposal of
                                             business
      management of                                                          (i) own portfolio           individual apartments
                                       for internal savings
       own portfolio                                                       (ii) disposal to third           to retail buyers
                                       and external income
                                                                                   parties

   Average duration of our             Leveraging long-term                Vonovia is one of the          Steady sales volume of ca.
   rental contracts is 13              customer relations to               largest builders of new        2k apartments p.a.
   years                               generate additional cash            homes in Germany
                                       flows from internal                                                Sales prices of 20-30%
   No cluster risk because of          savings and external                Size, efficiencies and         above fair market value
   B-to-C business                     income                              innovation lead to building    capture the spread
   granularity                                                             costs below fair market        between book value and
                                       Customer benefit through            values                         retail value
   High degree of insourcing           better service and/or
   and standardization along           lower cost
   our value chain

Investor Presentation – January 2020                              page 6
Full-scale Operator with Insourcing Strategy
 Equity Story & Market Fundamentals            Sustainability                    9M 2019 Business Update          Additional Information

Residential real estate is a granular operating business. Vonovia has built a scalable platform to
 efficiently manage large portfolios and to provide the full range of services largely in-house.

   Property Management                                                             Technical Service

              ~1,500                                                                      ~5,000
    Lettings agents & caretakers                                                           Craftsmen

Face to the customer and eyes and ears on the ground in                       Wholly owned craftsmen subsidiary (“VTS”) for large share
our local markets                                                             of maintenance and modernization plus pooling of entire
                                                                              purchasing power

 Residential Environment                                                              Service Center

                 ~800                                                                     ~1,000
        Landscape gardeners                                                             Service Agents

Maintenance of gray and green areas and snow/ice                              Centralized property management including inbound calls
removal in the winter                                                         and e-mails, ancillary cost billing, contract management,
                                                                              maintenance dispatch and rent growth management

      Best-in-class                    Fully SAP                High degree of               Efficient process         Superior cost
      service levels                    based                   standardization               management                 control

Investor Presentation – January 2020                                 page 7
Property Management
          Scalable Operating Business
 Equity Story & Market Fundamentals                 Sustainability                   9M 2019 Business Update                   Additional Information

                                                                                  Portfolio size (average number of apartments, ‘000)
  Our strategy is to own for generations and create
    scale effects and efficiencies (buy & hold), and                                                                                              361
                                                                                                                         343         346
                                                                                                               324
   therefore different from a financial investor with
        a limited investment horizon (buy & sell)
                                                                                      179        184

    >8m             >2.5m              >0.7m         >0.6m

 Invoices to        Inbound
                                       Ancillary    Maintenance      …
                                       expenses     & repair jobs
 process p.a.       calls p.a.
                                       bills p.a.       p.a.
                                                                                     2013       2014           2015   2016          2017         2018
              Granular Operating Business

     Unique scalable platform to efficiently manage a                             Proof of scalability
     large residential real estate portfolio driven by                                                                              74%           75%
                                                                                     830                              71%
     industrialization, standardization and optimization                                        754            68%
                                                                                                64%            645
                                                                                     61%
     with best-in-class service                                                                                          570
                                                                                                                                     498
     Digitalization still in early stage with cost-reduction                                                                                      445
     potential in the medium- and long-term
     Impact of scale to continue with acquisitions –
                                                                                     2013       2014           2015   2016          2017         2018
     incremental Cost per unit (Germany) is around €250
                                                                                      EBITDA Operations margin Germany          Cost per unit Germany (€)

Investor Presentation – January 2020                                     page 8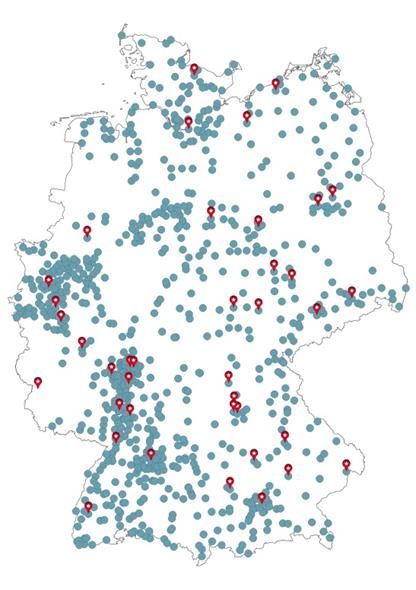
Financing
                 Solid Capital Structure & Diverse Funding Mix
     Equity Story & Market Fundamentals                                     Sustainability                                          9M 2019 Business Update                                    Additional Information

    KPI / criteria
                                                                                            Sep. 30,                      Evolution of LTV and Interest Cover Ratio
                                                                                              2019
    Corporate rating (Scope; since 12/2019)                                                            A-

    Corporate rating (S&P)                                                                        BBB+                                                                                                 4.6            4.7
                                                                                                                           49.0%             49.7%
    LTV                                                                                         40.3%                                                           47.3%
                                                                                                                                                                                     3.7
    Net debt/EBITDA multiple1                                                                     11.1x                                                            3.0                                             42.8%
                                                                                                                                                2.7                               41.6%                                     target
                                                                                                                                                                                                     39.8%
    ICR                                                                                             4.9x                      2.2                                                                                           range

    Fixed/hedged debt ratio2                                                                       97%

    Average cost of debt2                                                                         1.6%

    Weighted average maturity (years)2                                                                8.4                   2013               2014              2015               2016              2017          2018
                                                                                                                                               LTV (%)                                Interest Cover Ratio
    Unencumbered assets                                                                            53%

    Diverse funding mix with no more than 12% of debt maturing annually3
       €m
    3,000
                                                                                                                                                                                                   Corporate bond
    2,500                                                                                                                                                 10%

    2,000                                                                                                                                                                                          Equity hybrid
                                                                                                                                                13%
    1,500
                                                                                                                                                                              63%                  Structured loans
    1,000                                                                                                                                     10%

      500                                                                                                                                        4%                                                Mortgage loans

          0                                                                                                                                                                                        Subsidized modernization
              2019 2020 2021 2022 2023 2024 2025 2026 2027 2028 2029 2030 2031 from                                                                                                                debt & EIB loans
                                                                               2032

1   Adj. net debt quarterly average over Total EBITDA (LTM); adj. for IFRS 16 effect.   2   Excl. equity hybrid. 3 incl. Bonds 022A, 022B, 022C issue date Oct. 7, 2019 (see Appendix for list of bonds)

Investor Presentation – January 2020                                                                              page 9
Portfolio Management
          Focus on Urban Locations & Value-enhancing Investments
 Equity Story & Market Fundamentals                  Sustainability                        9M 2019 Business Update                   Additional Information

 Concentrating the portfolio in the right locations                                 Investments into existing portfolio and new construction

                                                                                      New construction: Construction of apartments for our
   ~70k non-core apartments sold since IPO in 2013
                                                                                      own portfolio through entirely new buildings or floor
   ~99% of current portfolio located in urban growth                                  additions to existing buildings applying modular and

   regions for long-term ownership and subject to structural                          conventional construction methods.
                                                                                      Upgrade Building: Energy efficient building modernization
   supply-demand imbalance (“Schwarmstädte”)
                                                                                      usually including new facades, roofs, windows and heating
                                                                                      systems.

           March 2015                           Strategic Portfolio                   Optimize Apartment: Primarily senior-friendly apartment
                                                                                      renovation usually including new bathrooms, modern
   347k units in 818 locations              350k units in ~400 locations
                                                                                      electrical installations and new flooring.

                                                                                      €m                                                                      1,300
                                                                                                                                                                -
                                                                                           New construction                                                   1,600
                                                                                           Upgrade Building
                                                                                                                                                ~1,400
                                                                                           Optimize Apartment
                                                                                                                                       1,139

                                                                                                                              779

                                                                                                                     472
                                                                                                           356
                                                                                                 172
                                                                                       71

                                                                                      2013      2014      2015       2016    2017      2018     2019E         2020E
   Vonovia location
  High-influx cities (“Schwarmstädte”). For more information: http://investoren.vonovia.de/websites/vonovia/English/4050/financial-reports-_-presentations.html

Investor Presentation – January 2020                                        page 10
Illustrative Overview of Investment Program Funding
Equity Story & Market Fundamentals Sustainability 9M 2019 Business Update Additional Information
Rental Income
Comprehensive investment program to drive
- Maintenance expenses
- Operating expenses organic growth and portfolio improvements
+ EBITDA Value-add
Size of investment program is calibrated to
+ EBITDA Recurring Sales
remain within LTV target range
+ EBITDA Development
= Total EBITDA Funded with retained cash, proceeds from
- Interest expenses
recurring sales plus (often subsidized) loans
- Current income taxes
- Consolidation/non-cash items
€1.3bn – €1.6bn
= Group FFO
~70% for dividend1 ~30% Incremental Including funding from KfW and
debt EIB
cash scrip retained earnings
- Capitalized maintenance
Sales 2,500 units * avg. fair value
- Hybrid coupon & minorities proceeds (~€130k) @30% est. gross
margin
- One-offs
Earnings
Earnings available for
= contribution
investment program
Investment Program
1 Average historic cash/scrip ratio has been 55%/45% since inception in 2016
Investor Presentation – January 2020 page 11Value-add
Leveraging B-to-C Nature of the Business
Equity Story & Market Fundamentals Sustainability 9M 2019 Business Update Additional Information
Value-add: lower cost & higher income Evolution of Value-add segment (Adj. EBITDA, €m)
Savings from Additional
121.2
insourcing of services revenues from 102.1
to ensure maximum walking back the
57.0
process management value chain and 37.6
23.6
and cost control offering services at 10.5
market prices but on 2013 2014 2015 2016 2017 2018 2019E
a lower cost basis
EBITDA contribution from different Value-add initiatives
due to scale and
Craftsmen cost savings (VTS)
efficiencies
Multimedia
Residential environment
Smart metering
Customer benefit is in lower cost
and/or better service quality Energy
Other (e.g. 3rd party
management, insurance,
security packages, e-mobility)
Investor Presentation – January 2020 page 12Mergers & Acquisitions
Opportunistic and Based on Strict Set of Criteria
Equity Story & Market Fundamentals Sustainability 9M 2019 Business Update Additional Information
Portfolio growth by number of apartments (‘000) Major transactions since IPO
417 04/2014
First sizeable portfolio
acquisition
~11k units
First sizeable corporate
317 10/2014
acquisition
180 ~21k units
80 Mixed cash/stock public
03/2015
takeover
~145k units
IPO Sales Acq. 9M 20191 Sizeable all equity financed
07/2015
portfolio acquisition
~19k units
Acquisition criteria
Public takeover and first
01/2017
acquisition outside Germany
Strategic Rationale Financial Discipline ~23k units
Long-term view of the At least neutral to
portfolio with a focus investment grade Public takeover and acquisition
rating 06/2018
on urban growth of critical mass in Austria
(assuming 50% equity/ ~48k units
regions 50% debt financing)
Earnings Accretion Value Accretion Public takeover and acquisition
07/2018
of “nucleus” in Sweden
~14k units
Accretive to EBITDA Adj. NAV/share or
Rental yield similar2 Acquisition of critical mass in
12/2019
Sweden
~21k units
1 pro forma incl. Hembla
2 EPRA has published new Best Practice Recommendations to replace EPRA NAV with a revised but broadly similar metric
Investor Presentation – January 2020 page 13European Activities
Implementation of Vonovia Business Model in Comparable Markets
Equity Story & Market Fundamentals Sustainability 9M 2019 Business Update Additional Information
Vonovia has developed an operating platform and
15 Urban
a unique business model for the efficient Growth Stockholm
Regions Gothenburg
management of large residential portfolios in Malmö
regulated environments. Randstad
(greater
Amsterdam)
We are convinced that this business model can be
applied outside of Germany in comparable
markets: large urban rental markets with a supply-
demand imbalance and a regulated rental
environment.
Île-de-France
(greater Paris)
No specific target rate or ratios in terms of German
vs. non-German exposure disciplined but highly
opportunistic approach. Mainly
Vienna
M&A activities in European target markets are
subject to the same criteria as in Germany.
Germany Austria Sweden France Netherlands
• Primary home market and • Run scalable operating • Prove that Vonovia • Largest long-term • Continue market
expected to remain dominant in business (Austrian SAP business model works potential research
the foreseeable future. client successfully outside Germany • Active market • Highly opportunistic
• Home of Vonovia business implemented) • Market consolidation on engagement and approach in case of
model that we are seeking to • “Austrian model” along the basis of Victoria networking to safeguard acquisition opportunity
repeat in similar markets build-hold-sell value Park and Hembla pole position for when
chain combination opportunity arises
Investor Presentation – January 2020The Megatrends that Support Our Long-term Business
Equity Story & Market Fundamentals Sustainability 9M 2019 Business Update Additional Information
% of population living in cities
Increasing urbanization in 87%
Germany and Europe meets a 84%
structural supply/demand 79%
imbalance in most European cities. 77%
Owning apartments in the right
locations is key to sustainable
Urbanization long-term organic growth. Germany W. Europe
2015 2050E
% of modernized housing units
Ca. 35% of greenhouse gas
~5%
emissions in Germany originate in
real estate. Energy efficient
modernization of the housing stock ~3%
with a view towards reducing CO2
~1%
emissions is paramount for
Energy Germany to achieve its climate
protection targets. Avg. Germany Required run Vonovia 2018
efficiency rate Germany
% of population above/below 65 years
Demographic changes demand the
refurbishment of apartments to 21% 31% 18% 28%
enable an ageing population to
stay in their homes with little or no 79% 82%
69% 72%
assistance for longer. Ca. 3 million
additional apartments for elderly
Demographic people will be needed by 2030. 2015 Germany 2050 2015 Europe 2050
change 65 or older younger than 65
Sources: United Nations, Prognos AG
Investor Presentation – January 2020 page 15Residential Market Fundamentals
Robust Rent Growth in Regulated Environments
Equity Story & Market Fundamentals Sustainability 9M 2019 Business Update Additional Information
Regulated residential markets Unregulated residential markets
In regulated markets like Germany or Sweden, rent growth is on a In unregulated markets like
sustainable upward trajectory and largely independent from GDP the USA, rents go up and down
developments broadly in line with the GDP
development
Germany Sweden USA
6 6 6
4 4 4
2 2 2
0 0 0
2001
2002
2003
2004
2005
2006
2007
2008
2009
2010
2011
2012
2013
2014
2015
2016
2017
2018
2001
2002
2003
2004
2005
2006
2007
2008
2009
2010
2011
2012
2013
2014
2015
2016
2017
2018
2001
2002
2003
2004
2005
2006
2007
2008
2009
2010
2011
2012
2013
2014
2015
2016
2017
2018
-2 -2 -2
-4 -4 -4
-6 -6 -6
GDP, quarterly development y-o-y Rent growth; quarterly development y-o-y
Sources: Federal Statistics Office, GdW (German Association of Professional Homeowners), REIS, BofA Merrill Lynch Global Research, OECD, Statistics Sweden.
Note: Due to lack of q-o-q rent growth data for the US and Sweden, the annual rent growth for a year is assumed to also be the q-o-q rent growth of that year.
Investor Presentation – January 2020 page 16Residential Market Fundamentals
Structural Supply-Demand Imbalance
Equity Story & Market Fundamentals Sustainability 9M 2019 Business Update Additional Information
Average annual residential completions of the last five years fall short of estimated required volumes:
Germany: only 75% of required volumes completed
Sweden: only 49% of required volumes completed
Germany (‘000 units) Sweden (‘000 units)
700 100
90
600
80
500 70
60
400
50
300
40
200 30
20
100
10
0 0
1991
1992
1993
1994
1995
1996
1997
1998
1999
2000
2001
2002
2003
2004
2005
2006
2007
2008
2009
2010
2011
2012
2013
2014
2015
2016
2017
2018
2019
2020
2021
2022
2023
2024
2025
1991
1992
1993
1994
1995
1996
1997
1998
1999
2000
2001
2002
2003
2004
2005
2006
2007
2008
2009
2010
2011
2012
2013
2014
2015
2016
2017
2018
2019
2020
2021
2022
2023
2024
2025
Completions (`000) Est. required volume (`000)
Sources: German Federal Statistics Office, GdW (German Association of Professional Homeowners). Swedish National Board of Housing, Building and Planning, Statistics Sweden, Le service de la donnée et des études
statistiques (SDES), Abbé Pierre Foundation
Investor Presentation – January 2020 page 17Residential Market Fundamentals
Large Gap between In-place Values and Replacement Costs
Equity Story & Market Fundamentals Sustainability 9M 2019 Business Update Additional Information
Vonovia (German portfolio) – fair value per sqm (€; total lettable area) vs. construction costs
Factor 2.5x – 3x
1,677
1,475
1,264
964 1,054
901
2013 2014 2015 2016 2017 2018 Market costs for
new constructions
Victoria Park – fair value per sqm (SEK; total lettable area) vs. construction costs
Factor 3x – 3.5x
14,319 15,793
12,108
10,375
8,662
6,580
2013 2014 2015 2016 2017 2018 Market costs for
new constructions
building land
Note: VNA 2010 – 2014 refers to Deutsche Annington Portfolio at the time; construction costs excluding land. The land value refers to the share of total fair value allocated to land. Allocation between building and land in
Sweden assumed to be similar to Germany.
Investor Presentation – January 2020 page 18Residential Market Fundamentals
No Correlation Pattern between Interest Rates and Asset Yields
Equity Story & Market Fundamentals Sustainability 9M 2019 Business Update Additional Information
Valuation methodology for German residential properties relies primarily on market prices for assets – not on interest rates
While market prices are affected by general interest rate levels, there is no significant correlation.
Other factors such as supply/demand imbalance, rental regulation, market rent growth, location of assets etc.
outweigh the impact of interest rates when it comes to pricing residential real estate.
The steep decline in interest rates (down by 740bps since 1992) is not mirrored by asset yields (down by
210bps since 1992).
German residential asset yields (%) vs. EUR interest rates (%)1 No correlation pattern between interest rates and asset yields 1
9 1
8
7
-2.1% 0.5
6
5
-7.4% 0
4
3 Δ -4.4%
2 -0.5
1
0 -1
1992
1993
1994
1995
1996
1997
1998
1999
2000
2001
2002
2003
2004
2005
2006
2007
2008
2009
2010
2011
2012
2013
2014
2015
2016
2017
2018
1992
1993
1994
1995
1996
1997
1998
1999
2000
2001
2002
2003
2004
2005
2006
2007
2008
2009
2010
2011
2012
2013
2014
2015
2016
2017
2018
10Y EUR rate German resi yield (%) Correlation
1Yearly asset yields vs. rolling 200d average of 10y interest rates
Sources: Thomson Reuters, bulwiengesa
Investor Presentation – January 2020 page 19Why Vonovia?
Equity Story & Market Fundamentals Sustainability 9M 2019 Business Update Additional Information
Long-term owner and full-scale operator with
proven track record of scale and efficiencies in
regulated residential real estate markets
Megatrends provide structural support and
long-term tailwind for the business
Granular B-to-C business with high degree of
stability. Business model is resilient,
predictable and provides downside protection
Uniquely positioned in Germany with ability
and ambition to implement Vonovia business
model in selected European metropolitan areas
Two types of shareholder returns with
sustainably growing dividends and organic
value appreciation of real estate portfolio
Investor Presentation – January 2020 page 20Agenda
Equity Story & Market Fundamentals Sustainability 9M 2019 Business Update Additional Information
Equity Story Sustainability 9M 2019 Additional
& Business Information
See Page Finder on
Market Update page 72 for detailed
Fundamentals agenda
pages 41-70
pages 2-20 pages 21-26 pages 27-45 pages 46-72
Investor Presentation – January 2020 page 21Main Focus Points of Our Sustainability and ESG Dimensions
Equity Story & Market Fundamentals Sustainability 9M 2019 Business Update Additional Information
E NVIRONMENTAL
• Largest and most meaningful
positive impact is through
S OCIAL
• Products & services deeply rooted
in society with impact on lives of
G
• We bear responsibility for offering
trust,
OVERNANCE
our employees
• Business conductwhich
environment in
transparency
a working
is builtthey
happy, heathy and able to
and
are
around
reliability
advance in line with their own
increasing energy efficiency and more than one million people • Inexpectations
everything we do we play by the
CO2 reduction of the >50,000 • Apartments not a product like any Vonovia
• rules and academy
are compliant with all
• Comprehensive health
buildings in our portfolio other serve a basic need relevant laws, directives, social
management
• Ca. one million tCO2e emissions alongside food and oxygen Generous
• norms home office regulation
and agreements
and part-time models
per year • As partner right in the middle of • Continuous and open dialogue with
• Ausbildung
• Supportive of German’s ambitious society we provide answers to the • allWeiterbildung
stakeholders
target of achieving an almost challenges of the housing sector • We will only be successful if our
climate neutral building stock by • Most important solution lies in the stakeholders feel that they can rely
2050 energy efficient construction of new and affordable on us
modernization of our portfolio at apartments; as one of Germany’s
rate of >3% p.a. largest homebuilders we live up to
• Researching innovative ways to our responsibility
reduce CO2 emissions and increase • Responsibility for ~10,000
the use of renewable energy employees from 78 countries
As Europe’s largest listed landlord we bear responsibility for more than 400,000 customers (and their
families) from 170 nations. All of our actions have more than just an economic dimension.
Investor Presentation – January 2020 page 22Environmental
Pro-active Approach to Improve Our Footprint
Equity Story & Market Fundamentals Sustainability 9M 2019 Business Update Additional Information
Energy intensity of the portfolio (MWh/sqm) CO2 heating intensity (tCO2e per rented unit)
VNA
1,000 roof headquarter
program for PV with 100%
installations electricity 2017 0.172 2017 3.320
from
with an expected renewables -3% -9%
capacity of has received
2018 0.166 2018 3.012
10,000,000 kWh various
sustainability
p.a. awards
Average water intensity (fresh water consumption
R&D project with Fraunhofer of Vonovia office locations in m³/sqm)
Total waste volume of our portfolio (‘000 t)
Gesellschaft and others to
explore innovative energy
2017 0.52 2017 500
concepts for energy-
autonomous neighborhoods -37% -4%
(e.g. hydrogen energy 2018 0.33 2018 482
storage)
First housing company to
Thousands cooperate with Portfolio distribution by energy efficiency rating
of trees Germany’s leading Increase in higher clusters and reduction of lower clusters
planted to 2017
environmental
+11%
increase the organization NABU 2018
+29% -4%
environmenta (Nature And Biodiversity 25%
l appeal in Conservation Union) to -21%
20% -64%
turn green areas in our +12%
our urban 15% -36%
neighbor- urban neighborhoods 10%
hoods into refuge areas for 5%
birds and insects 0%
A+ A B C D E F G H
Investor Presentation – January 2020 page 23Social
We Are In the Middle of Society
Equity Story & Market Fundamentals Sustainability 9M 2019 Business Update Additional Information
CUSTOMERS SOCIETY EMPLOYEES
• Business philosophy above and • Availability and affordability of • We bear responsibility for offering
• We bear responsibility for offering
beyond what is legally required housing is one of key social our employees a working
our employees a working
• Self-imposed obligation to limit questions of our time. The most environment
environmentininwhich
whichthey
theyare
are
ourselves to maximum rent effective answer to address this happy, heathy and able
happy, healthy and able to to
increase of €2/sqm after invest challenge is new construction. With advanceininline
advance linewith
withtheir
theirown
own
expectations
• Guarantee to customers 70+ years ~3,000 apartments per year we • expectations
Vonovia academy
that rents will remain affordable are part of the solution • Our Vonovia academy
Comprehensive healthcontinuously
irrespective of legal rent increase • Several hundred million of management
offers a range of training and
• Generous home office regulation
opportunities investments in neighborhood coaching opportunities
and part-time models
• In-house craftsmen organization to development to make sure that •• Comprehensive
Ausbildung health
ensure swift response time to people feel at home not only within Weiterbildung
• management
repair & maintenance needs their apartments but also within • Generous home office regulation
• Multilingual service center for their immediate neighborhood and part-time models to enable
customer enquiries with 24/7 • Various foundations, donations and employees to balance career and
emergency service and tenant app different initiatives (e.g. photo family
to access all relevant data and award) support our commitment to • Signatory of Diversity Charter and
state-of-the-art customer-landlord society committed to appreciation,
communication tolerance and respect
Investor Presentation – January 2020 page 24Governance
Highly Professional and Robust Governance Structure
Equity Story & Market Fundamentals Sustainability 9M 2019 Business Update Additional Information
The duties and authorities of the three governing bodies derive from the SE Regulation, the German Stock Corporation Act and
the Articles of Association. In addition, Vonovia is fully in compliance with the German Corporate Governance Code.
In the two-tier governance system, the management and monitoring of the business are strictly separated from each other.
Annual General Meeting (AGM)
• Shareholders can exercise their voting rights.
• Decision making includes the appropriation of profit, discharge of members of the SVB and MB, and capital authorization.
Two-tier Governance System
Supervisory Board (SVB) Management Board (MB)
• Appoints, supervises and advises MB • Jointly accountable for independently managing the
• Examines and adopts the annual financial statements company in the best interest of the company and its
• Forms Supervisory Board Committees. shareholders.
• Fully independent • Informs the SVB regularly and comprehensively.
• Board profile with all required skills and experience • Develops the company’s strategy, coordinates it with the
SVB and executes that strategy.
CEO CFO
Rolf Helene
Jürgen Prof. Dr. Burkhard Ulrich Vitus Dr. Florian Dr. Ute Buch von Roeder
Fitschen Edgar Ernst Drescher Eckert Funck Geipel-Faber
(Chairman)
CRO CDO
Arnd Daniel
Daniel Hildegard Prof. Dr. Dr. Ariane Clara-Christina Christian
Just Müller Klaus Rauscher Reinhart Streit Ulbrich Fittkau Riedl
Investor Presentation – January 2020 page 25ESG Rankings
Positive Momentum with More Upside Potential
Equity Story & Market Fundamentals Sustainability 9M 2019 Business Update Additional Information
Gold award for last 2 years Corporate Governance
Ranking of German Large
(DAX) and Mid Caps (MDAX)
40
30
20
10
0
Excellent Very good Good Average Sufficient Insufficient
2016 2017 2018
Upgraded from BBB to A Improved from 44 to 58 points
30%
58
50
20% 44
10%
0%
CCC B BB BBB A AA AAA 2017 2018 2019
Upgraded from D to C- Changed from „not disclosed“ to C
50%
40%
30%
2019 Results to be published Jan 2020
20%
10%
0%
D- D D+ C C- C+ B- B B+ A- A A+
Investor Presentation – January 2020 page 26Agenda
Equity Story & Market Fundamentals Sustainability 9M 2019 Business Update Additional Information
Equity Story Sustainability 9M 2019 Additional
& Business Information
See Page Finder on
Market Update page 72 for detailed
Fundamentals agenda
pages 2-20 pages 21-26 pages 27-45 pages 46-72
Investor Presentation – January 2020 page 27Highlights
Equity Story & Market Fundamentals Sustainability 9M 2019 Business Update Additional Information
Y-o-y increase across all four segments
Performance Adj. EBITDA Total €1,331.1m (+16.7%)
Group FFO €932.8m (+10.7%) and €1.72 per share (+5.5%; eop shares)
Adj. NAV per share €48.92 (+9.0% since YE 2018)
NAV &
Est. H2 2019 total fair value growth of €2.1bn – €2.8bn (4.4% - 5.9%) expected
Valuation
YE2019E Adj. NAV per share estimated to come out between €51.5 and €53
LTV 40.3% (-250bps since YE 2018)
Capital Pro forma year-end LTV incl. Hembla acquisition, financing and H2 valuation estimated to be toward the
Structure upper end but still well within our target range
Net debt/EBITDA multiple 11.1x
Final guidance 2019: Total EBITDA and Group FFO at the upper end of the range leading to a dividend
Guidance
2019 (final) p.s. of €1.57 to be proposed to the AGM in May 2020
2020 (initial)
Initial guidance 2020: Total EBITDA of €1,875m – €1,925m and Group FFO of €1,275m – €1,325m
Berlin-specific rent freeze expected to become law in Q1 2020. 2020E impact on Group FFO: ~€6m
Regulation & Discussions about regulation expected to continue but risk of rent freeze or similar regulation outside
political debate Berlin remains extremely low
Well-balanced stakeholder debate more important than ever and Vonovia is leading by example
We are continuing our solid performance and remain confident in our upward trajectory
and ability to deliver sustainable growth for the remainder of the year and beyond.
Investor Presentation – January 2020 page 28Substantial Growth in All Four Segments from Larger Portfolio
Volume and Performance Improvements
Equity Story & Market Fundamentals Sustainability 9M 2019 Business Update Additional Information
16.7% Adj. EBITDA Total growth and 10.7% Group FFO growth on the back of a 2.4% larger portfolio and
performance improvements.
While the operating business with the rental and value-add segments remains the primary performance
driver, recurring sales and development made an increasing contribution in 9M 2019.
€m (unless indicated otherwise)
9M 9M Adj. EBITDA Total (€m)
2019 2018
+17%
Adj. EBITDA Rental 1,082.5 966.7
Adj. EBITDA Value-add
1,331.1
117.5 96.8
Adj. EBITDA Recurring Sales 69.1 59.7 1,140.7
Adj. EBITDA Development 62.0 17.5
Adj. EBITDA Total 1,331.1 1,140.7 16.7%
FFO interest expenses -265.6 -237.7
Current income taxes FFO -43.1 -23.5
1 +2.4%
Consolidation -89.6 -36.8 396
386
Group FFO 932.8 842.7 10.7%
of which Vonovia shareholders 892.2 804.3
of which hybrid investors 30.0 30.0
of which non-controlling interests
9M 2019 9M 2018
10.6 8.4
Development
Recurring Sales
Number of shares (eop) 542.3 518.1 Value-add
Group FFO per share (eop NOSH) 1.72 1.63 5.5% Rental
Group FFO per share (avg. NOSH) 1.76 1.68 Avg. residential units (`000)
1 Consolidation in 9M 2019 (9M 2018) comprised intragroup profits of €34.3m (€26.5m), the valuation result of new construction/development to hold of €33.1m (€10.2m), and IFRS 16 effects of €22.2m (€0.0m).
Investor Presentation – January 2020 page 29Rental Segment
Adj. EBITDA Rental Up from Acquisitions and Organic Growth
Equity Story & Market Fundamentals Sustainability 9M 2019 Business Update Additional Information
Rental income growth in 9M 2019 was driven by the
9M 9M
Rental Segment (€m) Delta acquisition of Buwog and Victoria Park plus organic rental
2019 2018
growth, both of which more than outweighed the rental
income dilution from disposals.
Rental income 1,527.0 1,393.3 +9.6% The increase in maintenance expenses is volume driven; per-
square-meter levels are in line with last year.
Maintenance expenses -230.2 -218.8 +5.2%
The increase in operating expenses is mainly attributable to
Operating expenses1 -214.3 -207.8 +3.1%
the inclusion of ~€30m (pass-through) ancillary expenses for
Adj. EBITDA Rental 1,082.5 966.7 +12.0% Victoria Park due to the all-inclusive rent levels in Sweden.
Rental income by geography EBITDA Operations margin Germany2
7%
5% 77.9%
73.6% 75.0%
71.4%
67.7%
63.8%
60.0% 60.8%
Germany
Austria
Sweden
88%
IPO 2013 2014 2015 2016 2017 2018 9M 2019
1 Prior-year adjusted to include corporate transaction costs.
2 EBITDA Operations margin (Adj. EBITDA Rental + Adj. EBITDA Value-add – intragroup profits). 2019 margin includes positive impact from IFRS 16.
Investor Presentation – January 2020 page 30Rental Segment
Operating KPIs Rental Segment
Equity Story & Market Fundamentals Sustainability 9M 2019 Business Update Additional Information
Organic rent growth of 4.0% year-on-year. Organic rent growth (y-o-y; %)
4.0 4.1
Average in-place rent of €6.69 per sqm (+4.0%
0.3 0.1
not like-for-like and including impacts from
2.6
acquisitions and disposals). 2.5
Vacancy rate of 2.9%, largely investment related.
1.2 1.4
Maintenance expenses and capitalized
maintenance stable on a per-square-meter basis. 9M 2019 9M 2018
Market Modernization New construction
Vacancy rate (%) Expensed and capitalized maintenance (€/sqm)
2.9 13.4 13.6
2.7
4.3 4.5
9.2 9.1
9M 2019 9M 2018 9M 2019 9M 2018
Expensed maintenance Capitalized maintenance
Investor Presentation – January 2020 page 31Value-add Segment
Continued Dynamic Growth in Adj. EBITDA Value-add
Equity Story & Market Fundamentals Sustainability 9M 2019 Business Update Additional Information
Two types of value-add: (i) internal savings mainly via craftsmen organization and (ii) additional revenue through external
income by offering services at market prices but on a lower cost basis due to efficiencies and size.
Insourcing of services to ensure maximum process management and cost control.
Expansion of core business to generate additional revenues by walking back the value chain and offering services that were
previously provided by third parties (internalization of margin).
Cash flows from Adj. EBITDA Value-add are not included in the portfolio valuation, and as a consequence largely
ignored in NAV.
Applying the impairment test discount rate1 to the 2019E Adj. EBITDA Value-add suggests an additional value of ~€5 per
share (~10% on top of 9M 2019 Adj. NAV).
9M 9M Value-add EBITDA mostly from internal savings2
Value-add Segment (€m) Delta
2019 2018
Craftsmen cost savings (VTS)
Income 1,212.0 1,010.6 +19.9% Multimedia
Residential environment
of which external 186.8 133.6 +39.8%
Smart metering
of which internal 1,025.2 877.0 +16.9%
Energy
Operating expenses Value-add -1,094.5 -913.8 +19.8% Other (e.g. 3rd party
management)
Adj. EBITDA Value-add 117.5 96.8 +21.4%
1 Pre-tax WACC in impairment test of 5.1%. 2 Distribution based on FY2019 expectations
Investor Presentation – January 2020 page 32Recurring Sales Segment
Adj. EBITDA Contribution from Recurring Sales Up 15.7%
Equity Story & Market Fundamentals Sustainability 9M 2019 Business Update Additional Information
Geographic split by sales proceeds
Stable sales volume but higher proceeds and fair value step-up y-o-y.
FV step-up improvement also driven by disposals in Austria.
Austria
30%
Avg. sales prices up 10% y-o-y.
Outside the Recurring Sales Segment we sold 1,679 non-core units in
Germany
70%
9M 2019 with a fair value step-up of 15.2%.
9M 9M
Recurring Sales Segment (€m) Delta
2019 2018
Units sold 1,893 1,992 -5.0%
Gross proceeds 273.5 261.7 +4.5%
Fair value -193.4 -190.8 +1.4%
Adjusted earnings 80.1 70.9 +13.0%
Fair-value step-up 41.4% 37.1% +430bps
Selling costs1 -11.0 -11.2 -1.8%
Adj. EBITDA Recurring Sales 69.1 59.7 +15.7%
1 Prior-year adjusted to exclude corporate transaction costs.
Investor Presentation – January 2020 page 33Development Segment
Ramp-up of Development Business Continues
Equity Story & Market Fundamentals Sustainability 9M 2019 Business Update Additional Information
Development to sell (by income) Development to hold (by fair value)
This segment includes the contribution of to-sell
and to-hold constructions of new buildings. Not
included is the construction of new apartments
Germany Germany
by adding floors on top of existing buildings Austria
47% Austria 49%
53% 51%
because this happens in the context of and is
accounted for under modernization.
9M 9M
Development Segment (€m) Delta
2019 2018
Income from disposal of “to sell” properties 194.9 122.9 +58.6%
Cost of Development to sell -148.1 -107.8 +37.4%
Gross profit Development to sell 46.8 15.1 >100%
Fair value Development to hold 185.3 65.1 >100%
Cost of Development to hold -152.2 -54.9 >100%
Gross profit Development to hold 33.1 10.2 >100%
Operating expenses Development segment -17.9 -7.8 >100%
Adj. EBITDA Development 62.0 17.5 >100%
Investor Presentation – January 2020 page 34Development Segment
Vonovia‘s Contribution towards Reducing the Housing Shortage
Equity Story & Market Fundamentals Sustainability 9M 2019 Business Update Additional Information
New rental apartments for our own portfolio (“to hold”)
967 units completed in 9M 2019 (including 127 new units through Pipeline with ca. 31,000 apartments
floor additions which are built in the context of and are accounted for
under modernization investments and which are not included in the
11%
Development Segment).
Total pipeline of ca. 31,000 units, of which more than 80% in 14% Under construction
Germany and the remainder in Austria and Sweden. Short-term pipeline
Longer-term pipeline
Average apartment size between 60-70 sqm and broadly in line with
75%
overall portfolio average.
The development to-hold investment volume is part of the overall
investment program.
2019 target: up to 1,400 completions
New apartments for retail disposal (“to sell”)
515 units completed in 9M 2019.
Pipeline with ca. 7,400 apartments
Total pipeline volume of ca. €2.6bn (ca. 7,400 apartments), of which ca.
60% in Germany and ca. 40% in Austria.
25% Under construction
Investment capital for Development to sell is not part of investment
53% Short-term pipeline
program. Longer-term pipeline
22%
Average apartment size between 70-80 sqm.
Average investment volume of ~€4.5k per sqm.
2019 target: up to 800 completions
Expected gross margin between 20-25% on average.
Investor Presentation – January 2020 page 35Outlook H2 2019 Valuation
Equity Story & Market Fundamentals Sustainability 9M 2019 Business Update Additional Information
Comments Value growth drivers (€m)
H2 2019 total value growth is estimated to come out
between €2.1bn - €2.8bn (4.4% - 5.9%)
4,700 – 5,400
FY2019 total value growth estimated to be €4,700m –
€5,400m (10.5% - 12.1%). ~500 (H2)
4,581
FY2019
Offer prices in 2019 have been continuing to increase 415 (H1) ~900
across our markets except for Berlin, where in H2 2019 so 925
far we have been seeing a flat value development and
1,600 – 2,300
fewer transactions (see next page). (H2)
incl. ~150 value
While yield compression momentum has been slowing uplift from
Investments & New
down since the 2016 peak, this slowdown is taking place at Construction
a declining rate. Assuming yield compression at 2018
FY2019
levels for Berlin would lead to a value growth from yield
~3,800
compression for the full portfolio that is almost in line with -
3,656 2,234
the prior year. (H1) ~4,500
incl. 194 value uplift
from Investments & incl. 115 value uplift
New Construction from Investments &
10.7% New Construction
8.9%
7.7%
Assuming
YC in
Berlin
similar to
2018 2018 2019E
Investments
Performance + YC
2016 2017 2018 2019E
Investments exclude new construction as those investments are directly
Value growth from yield compression (Vonovia Germany) accounted for as “additions” to investment properties.
Investor Presentation – January 2020 page 36Berlin Valuation
Equity Story & Market Fundamentals Sustainability 9M 2019 Business Update Additional Information
While offer prices in all of our other German regional markets have been continuing to grow in H2 2019, we
have seen very little movement in Berlin.
In Berlin, the offer prices have been moving sideways and also the number of offers has been stable while
the transaction volume has been declining.
Meaningful value changes, if any, as a result of the rent freeze legislation, would probably not be seen
before H1 2020.
Evolution of offer prices in Germany1
130 Beginning of rent freeze discussions in Berlin
125
120
115
110
105
100
Q1 2017 Q2 2017 Q3 2017 Q4 2017 Q1 2018 Q2 2018 Q3 2018 Q4 2018 Q1 2019 Q2 2019 Q3 2019
Total Total w/o Berlin Berlin
1 Vonovia Portfolio. Index Q1 2017 = 100. Not like-for-like. Data source: empirica; own analysis
Investor Presentation – January 2020 page 37Adj. NAV Growth of +9.0% per share
Equity Story & Market Fundamentals Sustainability 9M 2019 Business Update Additional Information
Adj. NAV increased by 14.0% to €26.5bn
Adj. NAV per share increased by 9.0% on a 4.7% higher number of shares
€m Sep. 30, 2019 Dec. 31, 2018
(unless indicated otherwise)
Equity attributable to Vonovia's shareholders 18,123.7 17,880.2
Deferred taxes on investment properties 9,055.1 8,161.1
Fair value of derivative financial instruments1 106.5 87.2
Deferred taxes on derivative financial instruments -28.9 -23.5
EPRA NAV 27,256.4 26,105.0
Goodwill -730.6 -2,842.4
Adj. NAV 26,525.8 23,262.6 +14.0%
EPRA NAV €/share 50.26 50.39
Adj. NAV €/share 48.92 44.90 +9.0%
Number of shares (eop) 542.3 518.1
1 Adjusted for effects from cross currency swaps.
Investor Presentation – January 2020 page 38LTV at Lower End of Target Range
Equity Story & Market Fundamentals Sustainability 9M 2019 Business Update Additional Information
LTV as of Sep. 30, 2019, was 40.3%; Net debt/EBITDA multiple was 11.1x.
Against the background of the stable cash flows and the strong long-term fundamentals in our
portfolio locations, largely driven by a structural supply/demand imbalance, we see continued upside
potential for our property values and do not see material long-term downside risks for our portfolio.
Pro forma year-end LTV incl. Hembla acquisition, financing and H2 2019 valuation estimated to be
toward the upper end but still well within our target range.
€m Sep 30, 2019 Dec 31, 2018
(unless indicated otherwise)
Non-derivative financial liabilities 20,505.6 20,136.0
Foreign exchange rate effects -45.4 -33.5
Cash and cash equivalents -1,157.4 -547.7
Net debt 19,302.8 19,554.8
Sales receivables -10.4 -256.7
Adj. net debt 19,292.4 19,298.1
Fair value of real estate portfolio 47,763.9 44,239.9
Shares in other real estate companies 114.0 800.3
Adj. fair value of real estate portfolio 47,907.9 45,040.2
LTV 40.3% 42.8%
LTV (incl. perpetual hybrid) 42.4% 45.1%
1
Net debt/EBITDA multiple 11.1x 11.4x
1 Adj. net debt quarterly average over Total EBITDA (LTM); adj. for IFRS 16 effect.
Investor Presentation – January 2020 page 39Final 2019 Guidance at Upper End for Total EBITDA and Group FFO
Equity Story & Market Fundamentals Sustainability 9M 2019 Business Update Additional Information
Lower-than-originally anticipated organic rent growth as a result of not implementing 2019 Berlin Mietspiegel and
lower construction volume as a consequence of lagging permits
Since the IPO in 2013 we have been building a broader, increasingly diversified and more stable business that
generates earnings from a variety of sources and geographies
While the investment volume and organic rent growth fall a bit short of our earlier expectations, we expect to deliver
both EBITDA and Group FFO at the upper end of the guidance range, resulting in a dividend per share of
€1.571 (+9% y-o-y)
2019 Guidance Final 2019 Guidance
2018 Actuals
(Aug. 2019) (Nov. 2019; excl. Hembla)
Organic rent growth (eop) 4.4% ~4.4% ~4.0%
Rental Income (€m) 1,894 2,020 – 2,070 ~2,040
Recurring Sales (# of units) 2,818 ~2,500 ~2,500
FV step-up Recurring Sales 35.5% ~30% >30%
Adj. EBITDA Total (€m) 1,397 1,700 – 1,750 Upper end of range
Group FFO (€m) 1,132 1,165 – 1,215 Upper end of range
Group FFO (€/share) 2.18 2.15 – 2.24 Upper end of range
Dividend (€/share) 1.44 ~70% of Group FFO 1.571
Investments (€m) 1,139 1,300 - 1,600 ~1,400
Adj. NAV (€/share) 44.90 n/a €51.5 - €532
Underlying number of shares (million) 518.1 542.3 542.3
1 To be proposed to the Annual General Meeting in May 2020. 2 incl. Hembla
Investor Presentation – January 2020 page 40Initial 2020 Guidance
Equity Story & Market Fundamentals Sustainability 9M 2019 Business Update Additional Information
2019 Guidance 2020 Guidance
(excl. Hembla) (incl. Hembla)
Organic rent growth (eop) ~4.0% ~4.0%
Rental Income ~2.04bn ~2.3bn
Recurring Sales (# of units) ~2,500 ~2,500
FV step-up Recurring Sales >30% ~30%
Upper end
Adj. EBITDA Total (€m) 1,875 – 1,925
of 1,700 – 1,750 range
Upper end
Group FFO (€m) 1,275 – 1,325
of 1,165 – 1,215 range
Dividend (€/share) 1.571 70% of Group FFO per share
Investments (€m) ~1,400 1,300 – 1,600
1 To be proposed to the Annual General Meeting in May 2020
Investor Presentation – January 2020 page 41Berlin-specific Rent Legislation: Freeze & Reduction
Equity Story & Market Fundamentals Sustainability 9M 2019 Business Update Additional Information
On Oct. 22, the Berlin Senate agreed on the draft bill for a Berlin-specific rent freeze law;
parliamentary hearings are expected to take place in November and December. The bill is
expected to become law in Q1 2020.
The proposed rent freeze legislation also includes rent-reducing elements
Once the law is enacted, reversal of all rent increases implemented since June 18,
Legislation 2019, back to rent level legally agreed as of that date
New lettings at same rental level as previous rent but in no case above the respective
rent ceilings (Mietobergrenzen)
Reduction of in-place rents that are >120% of rent ceilings
This part is expected to be enforced nine months after the rent freeze legislation goes
into effect
Group FFO impact The estimated impact is ca. €6m from the reversal rent increases made after June 18, 2019, and
2020 for Vonovia unrealized rent growth because of the rent freeze
Vonovia remains fully convinced that the planned rent freeze legislation is not only
unconstitutional but also a large step in the wrong direction. It will not serve to solve the
housing shortage. Instead it will disincentivize homeowners and investors in Berlin to make
much needed investments in new constructions and the modernization of Berlin’s existing
Assessment housing stock. Notwithstanding this ill-conceived legislation, we will, of course, act in accordance
once it is enacted and for as long as it is upheld.
Vonovia will complete the construction and modernization projects that are underway and
carefully review any future investments into Berlin.
With ca. 10% of our portfolio located in Berlin, the impact on our performance and portfolio
Spillover? is clearly manageable. Unchanged from previous statements we continue to see the spillover
risk into other areas outside Berlin as extremely low.
Investor Presentation – January 2020 page 42Political and Public Debate about Housing (I)
Vonovia Leads by Example and Is Part of the Solution
Equity Story & Market Fundamentals Sustainability 9M 2019 Business Update Additional Information
As the market leader, Vonovia is determined to also lead by example
when it comes to stakeholder reconciliation
We offer our customers a product that is very close to their heart. The importance of
accommodation is probably only surpassed by other elementary needs such as oxygen and food.
As a consequence, affordable housing and rising rents have been among the most prominent topics of
the national debate.
Operating in the residential market brings with it a special responsibility that we take very seriously.
That is why we
developed our business philosophy which goes above and beyond what is legally required
(https://www.vonovia.de/en/geschaeftsverstaendnis);
limit ourselves to a maximum rent increase of €2/sqm following modernization even in cases where
the law would allow for €3/sqm;
have made a promise to our tenants who are 70 years or older by giving them a guarantee that
their apartment will continue to remain affordable even if the standard local comparative rents
change;
decided in August 2019 to not implement the 2019 Berlin Mietspiegel in order to (i) not increase
the uncertainty among our tenants any further and (ii) not add fuel to an already heated debate.
Investor Presentation – January 2020 page 43Political and Public Debate about Housing (II)
Vonovia Leads by Example and Is Part of the Solution
Equity Story & Market Fundamentals Sustainability 9M 2019 Business Update Additional Information
While this is a never-ending responsibility, we have come a long way
in our effort to be part of the solution
Largest homebuilders in Germany1 “We welcome this project because it Q: “Do you see private owners […] as a
creates new smaller apartments for partner or an enemy?”
students and senior citizens and larger A: “Actually, in their role as landlords
Bonava apartments for families in a very they are natural partners, and we have
popular location.” a pretty good working relation with
Dorothee Dubrau, Director for Housing Vonovia. However, when a company
Consus and Urban Development in Leipzig. […] does not even accept the
Source: Bild (German daily) Mietspiegel we have a massive conflict.”
Interview with Berlin’s Senator for
GEWOFAG
“Let’s check out how subsidies are Housing and Urban Development, Katrin
being put to use. Especially when you Lompscher.
Vonovia not only think of a single building but Source: Tagesspiegel (Berlin daily) on
of the whole neighborhood. This is Sep. 30, 2019
how Essen’s run-down northern
Instone neighborhood has been turned into
Average ancillary expenses (€/sqm)2
the Elting Viertel. Great!”
Jan Heinisch, CDU and Deputy Minister
BPD of Construction and Urban -9.3%
Development in NRW. 2.81
Source: Facebook 2.55
ABG Frankfurt
“More affordable housing in NRW,
Otto Wulff right where people need it. Vonovia is
adding a floor in Essen using modular
timber construction. Our NRW building
Pandion code provides the legal framework.
Thanks to the modular approach the
construction period for the new
Project Imm. G. apartments is only a few weeks.”
Stephen Paul, Liberal Party FDP and
0 200 400 600 Member of the NRW State Parliament.
‘000 sqm living area Source: Facebook Vonovia Market
1 Top 7 cities, includes projects completed between 2016 and 2023 (expected), Data source: bulwiengesa, company data. 2 2017 data, source for market is German Tenant Association (published Oct. 3, 2019)
Investor Presentation – January 2020 page 44Wrap-up
Equity Story & Market Fundamentals Sustainability 9M 2019 Business Update Additional Information
9M 2019 performance on track to deliver EBITDA and Group FFO at the upper end of the
guidance for 2019
Valuation estimate for H2 translates into YE2019E Adj. NAV/share between €51.5 and €53
YE2019 LTV expected to be well within target range
Initial 2020 guidance shows an estimated Group FFO growth of 7% (mid-point)
Expected to continue to deliver best-in class rental growth
Diversification of business in terms of geography and breadth of activities is paying off
Berlin-specific rental regulation with only minor impact on Group FFO
We continue to see the spillover risk into other areas outside Berlin as extremely low
Vonovia leads by example with regards to the highly relevant stakeholder debate
Investor Presentation – January 2020 page 45Agenda
Equity Story & Market Fundamentals Sustainability 9M 2019 Business Update Additional Information
Equity Story Sustainability 9M 2019 Additional
& Business Information
See Page Finder on
Market Update page 72 for detailed
Fundamentals agenda
pages 2-20 pages 21-26 pages 27-45 pages 46-72
Investor Presentation – January 2020 page 46History of Vonovia
Equity Story & Market Fundamentals Sustainability 9M 2019 Business Update Additional Information
2018
onwards
2013
until
2018 Opportunistic
expansion into
IPO selected European
Beginning of metropolitan areas
in 2013
~2000 consolidation in the
until German residential
Professionalization market While Germany is
2013
Pre 19th century of the business expected to remain
until the dominant market
Private equity Acquisition and
1980s in our portfolio also for
domination integration of more
than 290k the foreseeable future
Social housing in Proactive Portfolio
apartments. we want to build on
not-for-profit management: €3bn
regime our knowledge and
Predominantly Anglo- invested in portfolio
track record by
Saxon private equity modernization;
bringing our strategy
funds bought disposal of 77k non-
The commercialization and expertise to
hundreds of thousands core apartments
of Germany’s housing comparable residential
of apartments from Scalability &
market came in the markets outside of
public and corporate industrialization:
wake of the “Neue Germany.
owners. EBITDA Operations
Heimat” scandal in the
Push towards more margin of 76% (+16
1980s (bankruptcy of
professionalization but percentage points We built the German leader with
more than 250k
union-owned also short-term since IPO). the potential and ambition
apartments). orientation. to become
a unique European champion
Investor Presentation – January 2020 page 47You can also read