COMPANY PRESENTATION October 2020 - DIC Asset AG
←
→
Page content transcription
If your browser does not render page correctly, please read the page content below
COMPANY PRESENTATION
October 2020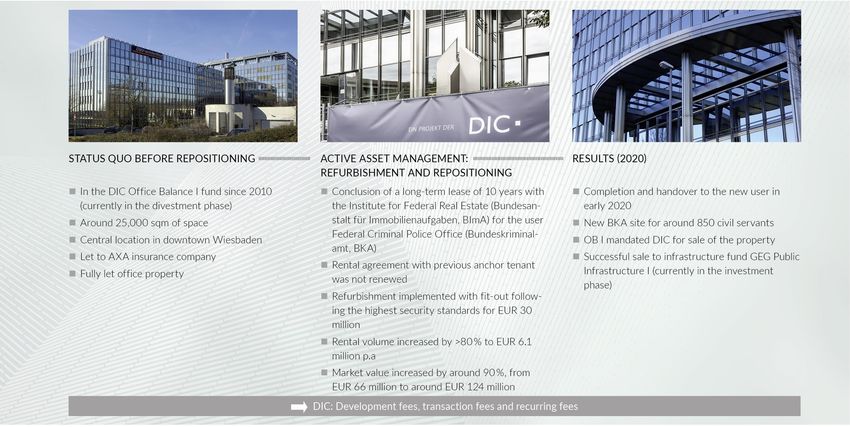
WHO WE ARE

          HIGHLIGHTS

S-DAX listed player in the                  Dynamic           Stable and diversified                      Solid and diversified
commercial real estate                      local expertise   income streams                              financial structure
market in Germany, fully                    in German         based on two solid
complying to highest                        real estate       revenue pillars,
market standards and                        since 2002        “Commercial Portfolio”
regulations              Adjusted NAV                         and “Institutional     Internal asset and                      Strong track record in
                         of roughly                           Business”              property management                     growing cash flows
                         EUR 1.75 billion                                            and development                         (FFO) year by year
                                                                                     platform with experts
                                                                                     in seven regional branches
                                                                                     creating added value

                                                                                                                                             2
EXPERIENCED MANAGEMENT TEAM
Sonja Wärntges Christian Bock Johannes v. Mutius Patrick Weiden
Chief Executive Officer (CEO/CFO) Chief Institutional Business Officer (CIBO) Chief Investment Officer (CIO) Chief Capital Markets Officer (CCMO)
Certified economist Certified economic Certified business Certified business
geographer, Master in administrator administrator and
Excellent management
Real Estate Finance & Approximately 20 years of International Investment
track record, various
Investment experience in senior Analyst (CIIA)
senior positions in
prestigious companies More than 15 years positions in the real estate Capital market expert with
experience in industry a proven track record and
Long-term experience in
management positions in 20 years of investment
the real estate industry
the real estate industry banking experience
3
PLATFORM
GERMANY-FOCUSED COMMERCIAL REAL ESTATE PORTFOLIO
COMBINED WITH STRONG REAL ESTATE PLATFORM
TOTAL EUR 8.6 billion AuM1
c. EUR 2.0 billion AuM (95 assets)1 c. EUR 6.6 billion AuM (94 assets)
Commercial Portfolio Institutional Business
(Balance Sheet Investments) (Managed Accounts)
Attractive and diversified real estate products for institutional
investors providing steady income
Directly held portfolio of high quality assets in top locations
Provides all real estate services (transaction, asset, property and
Steady income from core/core plus and value-add properties development management, sourcing of debt capital) and DIC
occasionally acts as co-investor
63% office, 17% mixed-use, 15% retail, 2% logistics, 3% other2
89% office, 6% retail and 5% other1
H1 2020: Gross Rental Income EUR 51.4 million
H1 2020: Real Estate Management Fees EUR 42.1 million and
Profit of Associates EUR 6.3 million
Asset Management, Property Management and Development
Transactions
Rental income Management Fees Development Fees
Sales profits Transaction Fees Equity Returns
Highly resilient business model with diversified income streams
1 Based on AuM as of 30 June 2020, pro forma incl. 2 acquisitions with transfer in July 2020; 2 Based on AuM as of 30 June 2020 excl. 2 acquisitions with transfer in July 2020
4
PLATFORM

HIGHLY COMPLEMENTARY DUAL BUSINESS MODEL
Leveraging the platform for stronger cash flow with lower risk profile

                                                Benefits of the combined business model…
             …on transaction / asset management level                                                                …on company level

               Broad market access and insight                                                                       Operating cost and capacity
       1       throughout Germany                                                                                1   allocation synergies
               ► 7 regional branches with 150                                                                        ► one headquarter, one transaction
               people on the ground                                                                                  team, one development team,
                                                                                                       North
                                                                                                                     regional property management for
               Critical mass with purchasing power                                                                   both segments
                                                                                                       East
       2       towards contractors and in
               transaction processes                                                                   West          Top-line synergies
               ►EUR 2 billion transaction volume
                                                                                                       Central   2   ► Institutional Business deal
               in 2019                                                                                               generation through warehousing and
               ► EUR 8.6 billion AuM1                                                                                financing capabilities
                                                                                                       South
               ► 189 managed assets1                                                                                 ► tenant, asset & transaction
               ► 2.2 million sqm gross lease area1                                                                   management capabilities as USP, also
                                                                                                                     in intensive market situations
       3       Broad scope of investment
                                                                          7 Branches: Hamburg, Berlin,
               opportunities                                              Düsseldorf, Cologne, Frankfurt,        3   Income stream diversification
               ► investments from EUR 10 million                          Mannheim, Munich                           ► Balanced and recurring income
               to EUR 500 million                                                                                    streams from both segments
               ► from Core to Opportunistic                                                                          (c. 50% / 50% FFO split)

1   Based on AuM as of 30 June 2020, pro forma incl. 2 acquisitions with transfer in July 2020
                                                                                                                                                                  5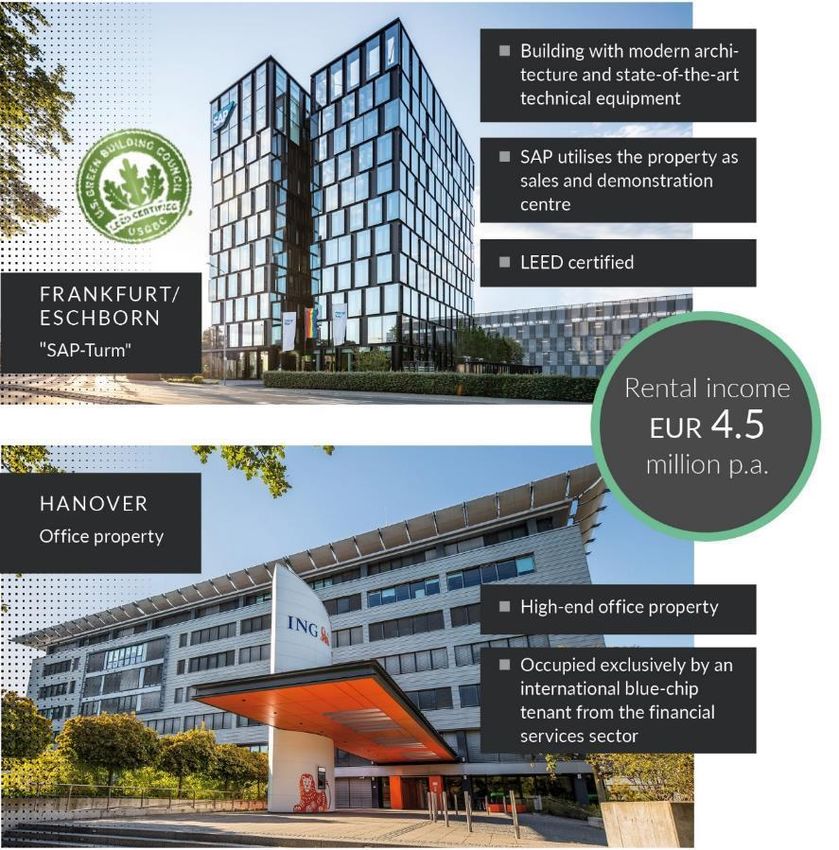
PLATFORM
SUPERIOR PLATFORM TRACK RECORD
Transaction volume 2019 exceeded EUR 2 billion for the first time, ongoing AuM growth in both segments
Transaction volume Assets under management Our transaction teams
in EUR million, notarised volume in EUR billion1 surpassed the target figure
for 2019 with a
Acquisitions Sales Commercial Portfolio Institutional Business
transaction volume of
EUR 2.2 billion
2,168 8.62
Total assets under
286 7.6 management grew in
every year; Commercial
5.6 Portfolio growth renewed
1,203 6.6 with focus on portfolio
4.2 4.4 5.7 quality (after optimisation
1,882 3.4 3.9
phase ended in 2017)
721 693 1.9
608 2.8
201 495 1.2
380
368 246
220 520 510 2.0 2.3 1.9 2.02
1.6 1.7
160 240 249
2015 2016 2017 2018 2019 H1 2020 2015 2016 2017 2018 2019 H1 2020
1 until 2018 Institutional Business volume as sum of the volumes of the old segments Funds and Other Investments;
2 Based on AuM as of 30 June 2020, pro forma incl. 2 acquisitions with transfer in July 2020
6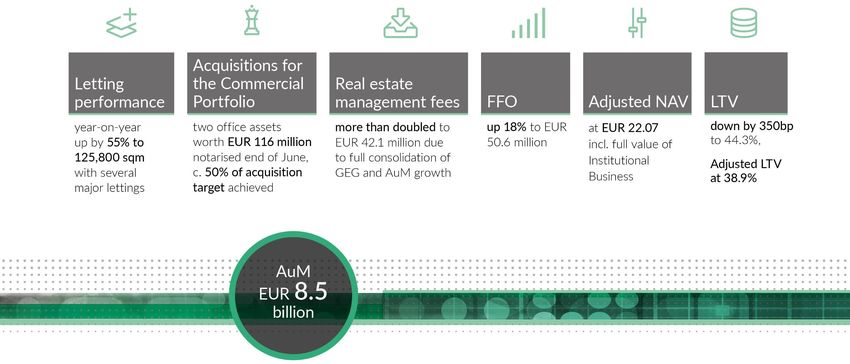
COMMERCIAL
PORTFOLIO
HIGHLY DIVERSIFIED EUR ~2 BILLION COMMERCIAL PORTFOLIO
Predominantly Core assets with healthy mix of Top 7 and small to mid-sized cities
1 EUR 2 billion Commercial Portfolio with 95 assets across Germany1 Regional structure of portfolio2
Top 7
40%
2 Stable cash flow profile with EUR 97.2 million annualised rental income
representing current gross yield of 5.1%2 Small - mid
sized cities
60%
3 Diversified portfolio by asset class and location, focus on Top 7 cities as
well as strong metropolitan areas (“ABBA”)3
EPRA Vacancy rate WALT
4 Strong tenant base with long WALT of 6.3 years and no dependency from in %4 in years4
single tenant or individual property and 22% public tenants
7.8 6.3
7.5 6.2
5 Positive like-for-like growth of 2% on average 2016-2019
6 EPRA vacancy rate reduced to 7.5% as per 30 June 20204
30.06.2019 30.06.2020 30.06.2019 30.06.2020
1 Pro forma incl. two acquisitions with transfer in July 2020; 2 Based on market value as of 30 June 2020; 3 Top 7 excl. Stuttgart;
4 Excluding repositioning and warehousing properties
7
COMMERCIAL
PORTFOLIO
COMMERCIAL PORTFOLIO STRATEGY
Focus on office complemented by properties with potential from other asset classes
Status quo and strategic outlook
Three office acquisitions Office
(EUR ~190 million) Largest asset class, roughly
transferred in Q3 2020 – 40% located in Top 7 cities
Total portfolio value exceeds
Acquisition focus on office
EUR 2 billion mark
properties and tenants with
strong credit profile, as
recently shown
Portfolio structure (as of 30 June 2020) Mixed-use
Market value Rental income p.a.
Type of No. of EPRA vacancy Combines various types of
use properties EUR m % of total EUR m % of total rate WALT
use (office, retail, hotel and
storage) under one roof
Office 53 1,197.2 63% 60.6 62% 7.4% 6.9
Attractive independent asset
class in the context of the
Mixed-use 15 320.1 17% 16.1 17% 6.2% 5.0 “post-COVID city”
Retail
Retail 11 292.7 15% 16.9 17% 9.5% 5.5 Focus on stable food retail
Logistics
Logistics 8 45.7 2% 2.8 3% 3.0% 5.2
Smallest sub-portfolio with
growth strategy for further
Other 6 47.2 3% 0.8 1% 5.4% 2.5 investments
Other properties
Total 93 1,902.9 100% 97.2 100% 7.5% 6.3 Mainly residential properties
and land plots
8
COMMERCIAL
                                                                                                      PORTFOLIO

VALUABLE CORE ASSET ADDITIONS TO OUR ASSET BASE
New acquisitions for the Commercial Portfolio

                                                “SAP-Turm” Frankfurt/Eschborn
                                                Acquisition price (incl. acquisition cost):   EUR 69 million
                                                Year of construction / completion:                2018
                                                Rental space (sqm):                               8,950
                                                WALT:                                            8 years
                                                Vacancy:                                           0%
                                                Tenant:                                            SAP
                                                Closing:                                        July 2020

                                                Hanover Office Property
                                                Acquisition price (incl. acquisition cost):   EUR 47 million

                                                Refurbishment:                                 2000-2002
                                                Rental space (sqm):                               9,350
                                                WALT:                                           9.5 years
                                                Vacancy:                                           0%
                                                Tenant:                                         ING DiBa
                                                Closing:                                        July 2020

                                                                                                               9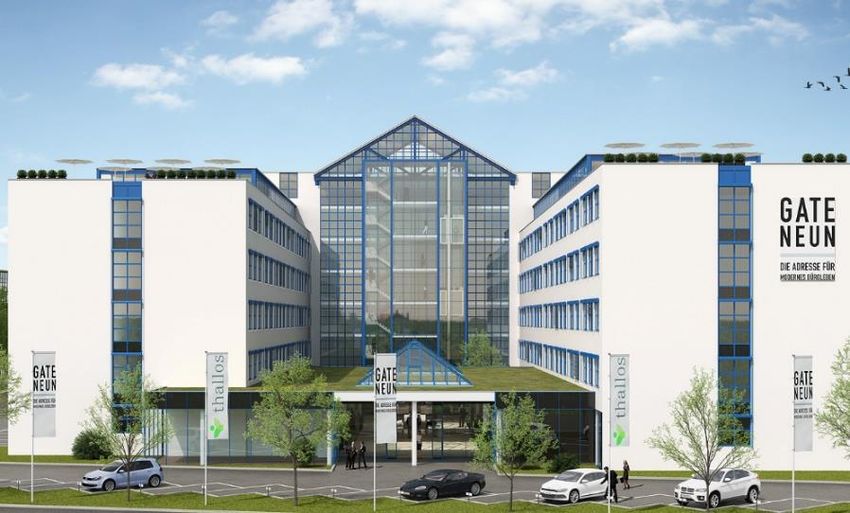
COMMERCIAL
PORTFOLIO
EXPANSION OF FOOTPRINT IN STRONG STUTTGART METRO REGION
Multi-tenant office building “GATE 9”: acquisition of a refurbishment under cash flow
© TAKTICS GmbH Stuttgart “GATE 9” is a further step to expand DIC’s
footprint in Stuttgart metro region
Well-connected: next to A8 motorway and
directly next to new Daimler Truck Campus,
(constructed until 2021)
Modernisation scheduled to be completed
by Q2 2021
Pre-letting currently at 56% with already one
tenant delivering rental cash flow of
EUR 0.6 million p.a.
Acquisition price (incl. acquisition cost): EUR 72 million
Year of construction / Modernisation
modernisation: until Q2 2021
Target GRI Yield Rental space (sqm): 17,900
of 5.3% Target WALT: 8.5 years
Pre-letting ratio: 56%
© TAKTICS GmbH Stuttgart Closing: September 2020
10COMMERCIAL
PORTFOLIO
TOP TENANTS IN THE COMMERCIAL PORTFOLIO
Diversified tenant base and durability of contracts leading to predictability in cash flows
Overview of top tenants (2% or more of total rental income)1 Overview of lease expiry for Commercial Portfolio
Lease expiry distribution
69.5%
15.1%
7.6% 6.3%
1.5%
2020E 2021E 2022E 2023E 2024E seqq.
Roughly 760 tenants with nearly 900 rental
contracts in the Commercial Portfolio
Top Tenants with long WALT of 9.3 years, thereof
c. 81% are office tenants
Roughly 45% of annualised rental income of top
tenants stem from public sector tenants
High creditworthiness of new tenants SAP and
ING DiBa
Note: All figures excl. developments and warehousing
1 Tenants with 2% or more of pro-forma annualised rental income Commercial Portfolio (EUR 99.8 million including new rental agreements with Galeria Kaufhof and new tenants SAP and ING-DiBa of
July/August 2020 (pro forma)
11INSTITUTIONAL
BUSINESS
WHAT WE DO IN THE INSTITUTIONAL BUSINESS
Tailored investment strategies for institutional investors in the German commercial real estate market
13 vehicles in investment phase (AuM EUR 3.1 billion) 16 vehicles in holding phase (AuM EUR 3.5 billion)
Sale
Possible reinvestment of
proceeds into new
investment vehicles
Holding
Acquisition Execution of the respective, individual property strategy for the
realisation of value enhancement potential
Acquisition financed with committed equity and Optimised properties are managed and a stable cash flow is
bank financing up to 50% LTV on purchase price ensured
Occasionally warehousing of selected assets as an (Optionally, some of the properties in holding phase can be sold
accelerator of funds and the capital released reinvested in the investment vehicle)
Management fee elements
Promote/performance fee
Asset/property management/ (one time, success based)
Acquisition and setup fee
development fee
(one time, not success based - recurring) Exit fee
(recurring)
(one time, not success based - recurring)
Recurring (not success based) One-time (success based)
12INSTITUTIONAL
BUSINESS
INVESTMENT FOCUS ON OFFICES AND CORE/CORE PLUS RISK PROFILE
AuM by asset class
in % Office properties representing 89% of assets
under management
Current AuM with focus on Core office
assets (as well as infrastructure use) – high
demand among investors, even more so in
turbulent and uncertain times
87% of AuM with risk profile Core/Core plus
Further tailored investment strategies across
the yield curve, incl.:
AuM by risk profile Assets with manage-to-core approach
in %
Repositioning of landmark assets with own
development expertise
13INSTITUTIONAL
BUSINESS
STRONG AND LOYAL INSTITUTIONAL INVESTOR BASE
Deal structures1 Our Institutional Business segment is
in % managed by our subsidiary GEG, which had
Assets under Management totalling EUR 6.6
billion as of 30 June 2020
DIC / GEG seen with proven track record for
commercial properties in the German market
High loyalty from institutional investor base,
committed equity of more than EUR 570
million in place for additional investments,
and no investor has withdrawn equity during
COVID-19
Investment partners2
in %
1 Percentages based on Assets under Management as of 30.06.2020 of EUR 6.6 billion; 2 Percentages based on committed equity
14FINANCIALS
FINANCIAL STRUCTURE
Deleveraging and continuous improvement of financial ratios over the last years
LTV & adjusted LTV1 Average interest rate2 The LTV ratio (adjusted for
in % in % warehousing) fell by 350 bp to 44.3 %,
the adjusted LTV incl. fair value of
59.9 -160bp
57.0 Institutional Business stood at 38.9%
2.5
53.1 2.1
2.0 The average interest rate of loans and
47.8 borrowings stood at 2.1 % on 30 June
44.3
2020
Adjusted LTV 41.8
The net interest cover ratio (ICR, the
38.9
ratio of EBITDA (excl. profit on
2016 2017 2018 2019 30.06.2020 30.06.2019 31.12.2019 30.06.2020 disposal) to net interest result)
remained at a very high level of 4.7x
Maturity profile H1 2020
No Maturities in 2020: Refinancing of
in EUR million, nominal values
bank debt of c. EUR 97 million in Q2
600
Bank debt New financing for two acquisitions in
500
Capital markets debt July with c. EUR 58 million secured at
400 89 150
Promissory note 0.85% cost of debt and 7-year tenor
300
180
Cash and cash equivalents as of 30
June2020 at EUR 417 million
200
341
79
59
100 13
34 145
113 92
51 1 64 45 48 14 15
0
2020 2021 2022 2023 2024 2025 2026 2027 2028 2029 2030
1 LTV as reported; excl. warehousing; 2 Based on total interest bearing liabilities
15FINANCIALS
HIGHLIGHTS H1 2020
16FINANCIALS
FORECAST
Forecast update 2020 confirmed after H1 2020
FFO Commentary
in EUR million Commercial Portfolio Institutional Business Other Investments¹
94–96 DIC was the first commercial
95 real estate company in
68 10
Germany to announce new
47 60 4 1 37 51
9 23 guidance during COVID-19,
11 29
36 47 44 48 showing strength,
22
predictability and reliability of
2016 2017 2018 2019 H1 2020 Guidance 2020 business model
Gross rental income FFO Guidance 2020 remains
in EUR million in line with record year
111 2019A
110 100 102 94–98
Growth driven by
51 transactions will be a bit
weaker in 2020E, reflecting
subdued transaction markets
2016 2017 2018 2019 H1 2020 Guidance 2020
Afterwards, higher growth
Real estate management fees rates expected again
in EUR million 80–90
63
42
34
22 21
2016 2017 2018 2019 H1 2020 Guidance 2020
1 2019 TLG only
17FINANCIALS
MID-TERM GROWTH TARGET
Targeted Growth of Assets under Management and FFO
120
14
95
Further growth is planned in both segments
12
100
Commercial Portfolio and Institutional
10 Business – with a mid-term target of Assets
10 68 8.61
80
under Management of c. EUR 10 billion
FFO
60 7.6
8
60
in EUR million
0 47 0 Strategic mid-term target of maintaining a
6
5.6
4.2 4.4 40 50:50 FFO balance between the
4 Commercial Portfolio and the Institutional
AuM
in EUR billion
2
20 Business
0
0 0 Target LTV ratio in the 45% area, mixed
2016 2017 2018 2019 H1 2020 mid-term
target structure of bank debt and capital market
Dividend track record debt
Regular dividend payment per share in EUR / payout ratio as % of FFO
1 Based on AuM as of 30 June 2020, pro forma incl. 2 acquisitions with transfer in July 2020
18WE KEEP YOU UP TO DATE
Get in Contact
Peer Schlinkmann Maximilian Breuer, CFA
Head of Investor Relations & Investor Relations Manager
Corporate Communications phone: +49 69 94 54 858-1465
phone: +49 69 94 54 858-1492 fax: +49 69 94 54 858-9399
fax: +49 69 94 54 858-9399 e-mail: ir@dic-asset.de
e-mail: ir@dic-asset.de
More information: Follow us on: Meet us at:
28.10.20 Publication Quarterly Statement Q3 2020
17.11.20 Deutsches Eigenkapitalforum, virtual
25.11.20 DZ Bank Equity Conference 2020, Frankfurt
01.12.20 Berenberg European Conference, Pennyhill
19DIC ASSET AG AT A GLANCE
APPENDIX
20PLATFORM
LONG HISTORY OF SUCCESSFUL VALUE CREATION
DIC Asset AG acquires the GEG German Approx. EUR 110m capital increase
Estate Group in June 2019 for EUR 225m through ABB (oversubscribed)
Fidelity as a new anchor shareholder
Sale of stake in TLG for EUR 376m
Fourth corporate bond (EUR
Second corporate bond 130m, 3.25%) placed in July 2017
(EUR 75m, 5.750%) placed Topped up in 2018 by EUR 50m
in July 2013 (repaid)
Topped up by EUR 25m, 2020
within the framework of a RAG foundation
Share capital doubled to 20.3m private placement (repaid) acquires 4.8%
DIC Onsite
shares established as
stake in DIC 2019
IPO : Successful flotation in May; Asset AG
in-house real Capital increase to 68.7m
initial SDAX listing estate manager shares for the purpose 2018 First-time placement of a senior unsecured
Further capital increase to 28.6m acquiring and integrating promissory note of EUR 150m, increased to
shares and placement in December the "UNITE" portfolio EUR 180m in November 2019
2017
Fifth corporate bond (EUR 150m
AUM 2014 target, 3.5%) placed in
expanded to September 2018
EUR 3.2bn
2013 RAG foundation expands its
equity stake in DIC Asset AG to
DIC Asset AG founded 2011 over 10%
as a portfolio company
with a portfolio volume 2010
of around EUR 130m 2009 Third corporate bond (EUR
2008 125m, 4.625%) placed in
2007 September 2014 (repaid)
2006
Capital increase by 17%
2004- 2005
to 45.7m shares
2002 Start of fund
management business First corporate bond Strategy
(EUR 70m, 5.875%)
placed in May 2011
Equity
Start of trading on the OTC markets
(repaid)
Launched on XETRA trading system Debt
Most recent ABB in 2020 illustrates company’s strong and proven access to equity capital markets
Diversified business model including Institutional Business
21PLATFORM
ORGANIZATIONAL STRUCTURE – FULLY INTEGRATED PLATFORM
Fully integrated platform with 246 highly skilled employees (as of 30 June 2020)
Employees: DIC Asset AG
Management Board
S. Wärntges (CEO/CFO) C. Bock (CIBO) J. von Mutius (CIO) P. Weiden (CCMO)
Group Management
Corporate Development & Strategy Investor Relations Finance, Accounting, Treasury & Controlling
59 Communication & Marketing Administration
Business segments
Commercial Portfolio Institutional Business
(Balance sheet investments) (Managed accounts)
Investment Portfolio Management Investment Vehicles Management Real Estate Management Development
Acquisitions & Sales Portfolio analysis Structuring new vehicles Property accounting Planning of developments
Due Diligence Portfolio strategy Implementing investment Quality control and refurbishments
37 Business plan modelling Portfolio controlling structures Legal (rental contract law) Key contact to assign
Distribution construction
Legal structuring Letting
Investor liaison
Asset & Property Management
Seven own nationwide operating local offices with regional heads
Berlin Cologne Düsseldorf Frankfurt External sources:
150 Hamburg Mannheim Munich
Facility Management
Technical Property Management
22PLATFORM
FULLY INTEGRATED SERVICE MODEL
In-house competence for provision of full suite of value-adding services
Employees
Corporate Functions 59
Acquisition Value enhancement & preservation Exit
Portfolio/Fund Asset Property Investment 37
Investment Financing Development
Management Management Management Management
150
Deal sourcing & Review of Portfolio Property Condition control Development and Contract
structuring financing management strategies of the property refurbishment negotiation
Due diligence structures Structuring of Business plans Inspections of know-how Closure
Off-market deals Bank selection, investment Representation of technical
and bidding tendering, vehicles the owner’s installations
procedures benchmarking Investor reporting interests Repairs
Contract Contract Performance Increase in rental Object accounting
negotiation negotiation & analysis income & service charge
closure settlement
Closure Risk & compliance Optimization of
Fulfilment of the running costs
pay-out condition
Refurbishments
Administration &
Control of
reporting
property
management
7 branches in Germany responsible for 187 properties and gross lettable area of 2.2 million sqm
Onsite teams operate nationwide to ensure portfolio value is maintained and increased through an active asset management approach
USP
Direct access to tenants, target-oriented letting management, planning and implementation of capex/TI measures
Regulatory reporting & risk management services (KVG) outsourced
23PLATFORM
ASSET- AND PROPERTY MANAGEMENT PERFORMANCE (1/2)
Assets under Management rose to EUR 8.5 billion – Commercial Portfolio to grow above EUR 2 billion
Portfolio by segment
Assets under management rose by 20 % year-on-year to
EUR 8.5 billion, distributed across 187 properties with rental
space of around 2.2 million sqm
Notarised transaction volume in H1 2020 amounted to
EUR 495 million
Successful transfer of ownership of Infinity Office in
Düsseldorf as part of a club deal in April 2020. In H1 2020,
the transfer of ownership for Stadthaus Cologne and the
BKA property in Wiesbaden also were concluded
With transfer of two acquisitions in Hanover and
Frankfurt/Eschborn worth EUR 116 million in Q3 2020, the
market value of the Commercial Portfolio will grow above
Notarised transactions in 2020 EUR 2 billion
in EUR million
24PLATFORM
ASSET- AND PROPERTY MANAGEMENT PERFORMANCE (2/2)
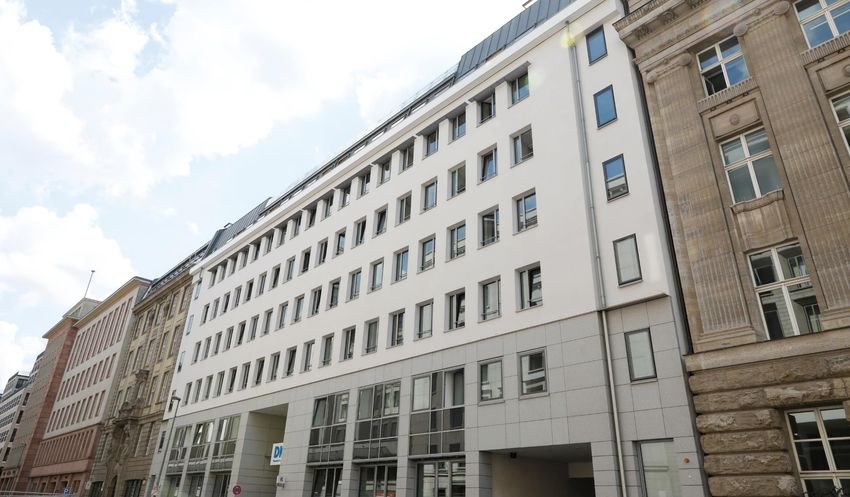
Active management: refurbishment, repositioning and sale of Frankfurter Strasse property in Wiesbaden
25PLATFORM
VALUE CREATION THROUGH REPOSITIONING ACTIVITIES
EUR 77 million value creation from four finished projects between 2016–2020
Kaiserpassage Frankfurt (COP) Lighthouse Frankfurt (COP) Wilhelminenhaus Darmstadt (COP) BKA Wiesbaden (IBU)
04/16–12/19 12/17–12/19 11/17–04/20 01/19–01/20
• Market value old (12/15): • Market value old (12/17): • Market value old (12/17): • Market value old (12/18):
EUR 13.1 million EUR 33.5 million EUR 60.5 million EUR 66.5 million
• CAPEX/TI: EUR 25.5 million • CAPEX/TI: EUR 7.2 million • CAPEX/TI: EUR 31.9 million • CAPEX/TI: EUR 29.5 million
• Market value new (12/19): • Market value new (12/19): • Market value new (06/20): • Market value new (06/20):
EUR 56.6 million EUR 50.8 million EUR 113.0 million EUR 124.0 million
Value creation: EUR 18.0 million Value creation: EUR 10.1 million Value creation: EUR 20.6 million Value creation: EUR 28.0 million
Restructuring and redesigning Transformation project – Complete renovation, energy Repositioning of 25,000 sqm
the retail units/arcade, repositioning the asset after modernisation and structural after former tenant moved out;
straightening the arcade passage, former tenant had left, steady alterations for handicap refurbishment with fit-out of
modernising the lightning decrease of vacancy from ~80% accessability; energy savings of the highest security standards
concept and facade to 0% in 2 years around 40% for new tenant BKA
COP = Commercial Portfolio; IBU = Institutional Business
26PLATFORM
RESILIENT BUSINESS MODEL
DIC well prepared for the “new normal”
WHAT WE HAVE DONE SINCE MARCH 2020 OUR EXPECTATIONS FOR H2 2020
Proactive contact with affected tenants “Safe haven”: German real estate market most attractive in
Europe, core and well-managed properties remain highly
Long-term renewals with tenant Galeria Kaufhof, two
sought-after
leases with new average term of more than 13 years, for
location Bremen follow-up use concept already in planning Financing costs stay at historically low levels for longer
July rent collection back on “pre-corona levels” Transaction activities regain momentum
Three attractive acquisitions for the commercial portfolio Future Offices to be more flexible: trend towards working
to strengthen portfolio quality from home, but not on a full-time basis; office spaces to
adapt to more flexible solutions, social distancing and
Revised forecast 2020 includes sufficient provisions for
more spaces for collaborative work
deferred payments and impact from COVID-19
TOP 7 cities with 3.1% on historical low level of vacancy,
below healthy levels of c. 5%
HOW DIC ASSET IS PREPARED FOR THE “NEW NORMAL”
Ample liquidity and financial strength to further pursue our growth
DIC’s Institutional investor base highly committed, equity of more than EUR 570 million available for further investments
Over 150+ people on the ground for active asset/tenant management, a key differentiator to our competitors
Changing the mix of our asset classes: mid-term expansion of logistics investments, decrease share of retail exposure
Focus on key future trends such as digitalisation, extended services and ESG to stay close to tenants requirements
Dynamic performance
27PLATFORM
ASSET- AND PROPERTY MANAGEMENT PERFORMANCE H1 2020
Strong second quarter – increased trend towards renewals
Letting structure Contracted rental income Letting performance increased
in sqm Annualised rental income in EUR million by 55% year-on-year, strong
second quarter despite
Covid-19 lockdown
Annualised contracted rental
income of EUR 16.3 million
secured
Increasing trend towards lease
extensions
Rental levels of renewed
contracts in H1 2020 in both
segments on average 4.9%
higher
Several large-volume leases
Top lettings Lease maturity exceeding 10,000 sqm signed
Annualised rental income in %
2020 lease expiry volume
remaining was reduced to 1.1%.
74.4 % of leases expire in 2024
or later
28PLATFORM
OUR COMMITMENT TO ESG
ESG Milestones and future developments
We have a proactive and long term approach to environmental sustainability, aiming to
reduce CO₂ emissions and minimize resources and costs of consumption
Overview of reporting activities
1 Regular sustainability report since 2011
GRI standards and EPRA SBPR reporting standards for increased
transparency and international comparability
Regular response to carbon disclosure project
DVFA governance score in lower MDAX range
Recent highlights
2 Sustainability Report 2019 published on 30 June
(EPRA sBPR Bronze Award)
Digitalisation of real estate data:
Smart-meter roll-out for additional improvements in data analysis as
well as energy savings
Global Tower certified with WiredScore Platinum for smart buildings
Acquisition of a certified green building for the Commercial Portfolio
(SAP Turm in Eschborn with LEED Gold)
Future developments
3 Additional reporting standards for third-party business on property and
vehicle level under review (GRESB, INREV, UN-PRI)
Review potential of “Green Finance” in the context of Corporate
Finance activities
Implementation of group-wide ESG strategy driven by “Head of
Sustainability”
Highest certification target (DGNB Platinum) for Global Tower at
completion
29MARKET
CONTINUOUSLY STRONG FUNDAMENTALS
Commercial Portfolio
Transaction volume in Germany Prime Office Rents (EUR/sqm/month)
EUR Transaction volume (EUR billion) Average (2015 Q1-2020 Q1) Q4 2019 Q2 2019 Q2 2020 %
34.17
billion Berlin1 37.00 35.50 37.00 4.2%
27.89
26.48
25.10
40,0
23.05
22.43
22.01
21.22
20.54
Düsseldorf2
19.79
19.48
28.50 28.00 28.50 1.8%
18.22
17.88
17.32
17.15
16.57
16.00
15.58
15.38
14.65
30,0 12.00
10.01
3
EUR 19.92 Frankfurt/M 41.50 40.50 41.50 2.5%
20,0
billion Hamburg4 29.00 29.00 30.00 3.4%
10,0
Cologne5 26.00 25.00 26.00 4.0%
0,0
Q1 2Q 3Q 4Q Q1 2Q 3Q 4Q Q1 2Q 3Q 4Q Q1 2Q 3Q 4Q Q1 2Q 3Q 4Q Q1 2Q Munich Region6 41.00 40.00 41.00 2.5%
7
2015 2016 2017 2018 2019 2020 Stuttgart 24.50 24.00 25.50 6.3%
Prime rental index and take-up Big 7 Rental yield spreads in the Top 7 cities8 vs. 10y Bunds
Index 1987=100 ‘000 sqm, rolling 12 months
Prime German office yields2 10Y Bund yield (%)
Prime rent (index 1987=100) Take-up in '000 sqm 9%
225 4400
7%
215 3900 5%
205
3400 3%
195 1%
185 2900
(1)%
Q2 2004
Q2 2002
Q2 2003
Q2 2005
Q2 2006
Q2 2007
Q2 2008
Q2 2009
Q2 2010
Q2 2011
Q2 2012
Q2 2013
Q2 2014
Q2 2015
Q2 2016
Q2 2017
Q2 2018
Q2 2019
Q1 2020
175 2400
Q3 15
Q2 16
Q4 15
Q1 16
Q3 16
Q4 16
Q1 17
Q2 17
Q3 17
Q4 17
Q1 18
Q2 18
Q3 18
Q4 18
Q1 19
Q2 19
Q3 19
Q4 19
Q1 20
Q2 20
Institutional Business
Real estate investment as part of portfolio9
12% Sought-after asset class for institutional investors with
10.3%
9.3%
9.7% 9.8% significant firepower for acquisitions, creating further
10%
synergies across DIC’s dual-pillar business model
7.3% 7.6%
8% 7.0%
6.6% 6.3%
6.0% 6.1% 6.1%
6%
Limited new constructions in top locations, significant
4% demand/supply gap, decreasing vacancy to structural lows
2008 2009 2010 2011 2012 2013 2014 2015 2016 2017 2018 2019
Sources: JLL, Investment Market Overview, July 2020, JLL, Office Market Overview, July 2020; Deutsche Bundesbank and CBRE.
1 City Area; 2 City area incl. Ratingen, Neuss, Erkrath and Hilden, 3 City Area incl. Eschborn and Kaiserlei; 4 City Area; 5 City Area; 6 City Area incl. surrounding area; 7 City Area incl. Leinfelden-Echterdingen;
8 German office yields as average of Berlin, Frankfurt, Cologne, Dusseldorf, Hamburg, Munich and Stuttgart; 9 Based on EY investor survey among insurance companies (June 2019)
30COMMERCIAL
PORTFOLIO
HISTORICAL DEVELOPMENT OF THE COMMERCIAL PORTFOLIO
Strong development across all KPIs
Growing portfolio… …with strong letting activities leading to reduction in vacancy rate…
Fair value of investment properties (EUR m) EPRA Vacancy rate %
+16.1% –4.3pp
11.8%
1,948 1,900 1,903 9.9%
1,639 1,697
7.2% 7.5%
6.5%
2016 2017 2018 2019 H1 2020 2016 2017 2018 2019 H1 2020
…and significant increase of WALT (incl. attractive new acquisitions)… …resulting in rising annualised rental income since 2017
WALT in EURm
in years
+EUR
1.7m
+1.9 yrs 9.64 10.41 10.36
5.8 6.0 6.3
4.4 5.1 106.3 95.5 97.6 101.8 97.2
2016 2017 2018 2019 H1 2020 2016 2017 2018 2019 H1 2020
Average rent per square meters p.m. (EUR)
31COMMERCIAL
PORTFOLIO
COMMERCIAL PORTFOLIO
Constant focus on portfolio quality improvements
Development of Commercial Portfolio As of 30 June 2020, the Commercial
Portfolio comprised 93 properties
with a market value of approx.
EUR 1.9 billion and rental space of
837,200 sqm
EPRA vacancy rate reduced to 7.5%
(30 June 2019: 7.8 %)
L-f-l rental growth of -0.6%, mainly
driven by retail properties and
modified rental agreements due to
Covid-19
Annualised rental income was lower
Average rent EPRA Vacancy rate WALT at EUR 97.2 million (H1 2019:
in EUR/sqm in % In years EUR 103 million), mainly driven by
prior-year transactions
WALT increased year-on-year from
6.2 years to 6.3 years
32COMMERCIAL
PORTFOLIO
NEW CONTRACTS SIGNED WITH RETAIL TENANT GALERIA KAUFHOF
Long-term renewals for two properties – one property to be repositioned
33COMMERCIAL
PORTFOLIO
TOP 20 ASSETS IN COMMERCIAL PORTFOLIO*
As at 30.06.2020, by market value
Rental
space EPRA Annualised
Type of (thsd. vacancy rental income Market value WALT
Location Address use sqm) rate (EUR million) (EUR million) (years)
1 Berlin Taubenstr. 7–9 Office 10.1 0.0% 4.3 120.5 4.6
2 Darmstadt Wilhelminenstr. 1–3 Office 25.7 0.0% 4.5 113.0 16.8
3 Düsseldorf Werdener Str. 4 Mixed-Use 29.4 4.2% 6.3 107.0 4.9
4 Halle Neustädter Passage 17 a–d Retail 30.7 0.0% 4.3 70.6 4.7
5 Frankfurt Insterburger Str. 7 Office 14.3 7.5% 5.5 68.3 2.2
6 Hamburg Marckmannstr. 129a–e Office 23.4 0.0% ** 60.4 **
7 Duisburg Steinsche Gasse 26 Office 12.6 0.0% 2.2 58.1 16.8
8 Leverkusen Horst-Henning-Platz 1 Office 13.4 0.0% ** 56.7 **
9 Chemnitz Am Rathaus 1 Retail 26.9 0.0% ** 56.7 **
10 Frankfurt Kaiserstr. 62–64 Mixed-Use 9.3 0.0% 1.9 56.5 11.8
11 Berlin-Mahlsdorf Landsberger Str. 225–241, 245–249, 252–255, 261–262 Mixed-Use 40.0 2.9% 3.0 56.1 3.7
12 Frankfurt Königsberger Str. 29 Office 12.7 0.0% 2.4 50.8 8.4
13 Wiesbaden Gustav-Stresemann-Ring 12–16 Office 26.1 45.1% 2.1 46.2 3.2
14 Karlsruhe Bahnhofplatz 12 Office 11.0 0.0% 1.9 45.0 9.7
15 Hamburg Kurt-Schumacher-Allee 2–6 Office 13.1 0.0% 1.6 41.2 7.3
16 Cologne Mathias-Brüggen-Str. 124–170 Mixed-Use 28.2 5.5% 2.1 40.5 3.4
17 Kronberg Westerbachstr. 28–32 Office 12.8 0.0% 2.1 34.5 4.2
18 Offenbach Berliner Str. 60 Office 12.8 0.0% ** 33.7 **
19 Cologne Agrippinawerft 22+24 Office 8.4 0.0% 1.7 33.0 2.3
20 Mannheim Coblitzallee 1–7 Office 17.9 0.0% 2.2 32.7 8.1
Top 20 properties 378.8 4.0% 57.2 1,181.5 7.8
Other properties 458.4 12.0% 40.0 721.4 4.2
Total 837.2 7.5% 97.2 1,902.9 6.3
* Top 20 list without non-strategic properties and properties earmarked for future repositioning activities;
** Undisclosed information for reasons of competition
34INSTITUTIONAL
BUSINESS
HISTORICAL DEVELOPMENT OF INSTITUTIONAL BUSINESS
Institutional Business Volume (AuM) Market value of equity investments in Institutional Business
in EUR billion in EUR million
Sale of a co-
investment
6.6
5.7 160.03
CAGR:
44.2% 129.9 130.7 127.3
3.9 99.4
2.8
1.9
2016 2017 2018 2019 H1 2020 2016 2017 2018 2019 H1 2020
Income from Institutional Business
in EUR million
Share of profit of associates without project developments and sales 1 Transaction- and Performance Fees Asset-, Property Management and Development Fees
68.3
CAGR:
44.6%
31.7 48.4
39.2
18.1
26.7 11.8
22.6 20.3
10.8 31.2 24.0
9.7 21.8 7.9
10.0 9.6
11.8 1.1 5.9 5.6 5.4 2.8 6.3
2016 2017 2018 2019 2 H1 2019 H1 2020
Steadily increasing income generation from Institutional Business,
strong visibility across different recurring income streams
Note: CAGR figures calculated on 2016-2019 figures; 1 Excl. all income from WCM and TLG investments received in prior years; 2 Reclassification of development fees related to Global Tower project reported
as performance fees in financial reporting for 2019; 3 excl. TLG investment
35INSTITUTIONAL
BUSINESS
DEAL STRUCTURES TAILORED TO INVESTOR NEEDS
EUR 2.9 EUR 1.1 EUR 2.6
billion billion billion
Pool funds Club deals Separate accounts
Pool funds specialized in regions Investments for institutional We initiate joint investment
or asset classes with a proven investment partners in real estate strategies for selected
track record in Germany's top 10 markets for investment partners within the
commercial real estate, either in framework of individual
Funds legally structured as special
single-asset or portfolio mandates
funds under the German or
transactions
Luxembourg regime The investment strategies may
DIC secures property(ies) in order not interfere with the existing
Joint investments with investment
to mitigate the transaction pool funds and club deals
partners, co-investment by DIC
uncertainty; the investment
Strong individual property size partners then join
Typically a portfolio of 7-8
properties acquired over time
Individual property EUR 20-60 million Individual property sizes Individual property sizes
Typically a portfolio of 7-8 properties Typically 2-3 properties with 2-3 Typically individual property;
acquired over time institutional investors no portfolio investments
=AuM (30.06.2020)
36INSTITUTIONAL
BUSINESS
INSTITUTIONAL BUSINESS: PORTFOLIO SPOTLIGHT
Strong focus on Core assets in Top 7 Locations
Hamburg, Berlin,
Dusseldorf, Dortmund Frankfurt,
Stadthaus, Opera Offices:
CABO: HCC: Type: Fee IBC Campus: Pressehaus
Cologne: Type: Club Alexanderplatz:
Type: Manage- Type: Club Type: Manage- development
to-core (value) (finished) deal Type: Individual
to-core (value) deal
mandate
Dusseldorf, Frankfurt, Global
Business Campus Hamburg Tower:
am Park: Type: Individual mandate
Type: Club deal (under refurbishment)
Berlin
Frankfurt,
Neuss, Police RIVERPARK
Training Center: Tower & Suites:
Type: Infrastructure fund Type: Individual mandate
(under refurbishment)
Dusseldorf Frankfurt,
Cologne, Triforum: Cologne
Villa Kennedy:
Type: Club deal Type: Individual
mandate
Frankfurt
Mainz, DB Frankfurt,
Cargo- Garden Tower:
Headquarter: Type: Individual
Type: Infrastructure mandate
Munich
Frankfurt,
Frankfurt, Japan
Schillerportal:
Center: Type: Individual
Type: Individual mandate mandate
Munich, Junges Munich,
Frankfurt, Frankfurt,
Quartier Munich, Pasing
WINX: Sapporo- Eurotheum:
Obersendling: Central:
Type: Fee bogen: Type: Individual
Type: Opportunistic
development Type: Infrastructure mandate
Type: Club deal
fund
DIC office location
Asset location
37INSTITUTIONAL
BUSINESS
INCOME FROM INSTITUTIONAL BUSINESS
Strong base of recurring fee income
Types of fees Recognition of fee income Classification
Warehousing income
Setup1 Set up fees for new investment vehicles
Sourcing/
Transaction
acquisition Transaction fee income recognised as percentage
Acquisition of transaction volume
Real Estate investment lifecycle
Investment/ Asset / property management Recurring fee income recognised as percentage of AuM Asset / property
property management /
Repositioning of office and retail projects generally development
management Development recognized as percentage of construction cost
Transaction fee income recognised as percentage
Sales fees of transaction volume Transaction
Exit/ Income recognized upon successful exit of sale of
Promote the properties
Realisation
Performance
Fee payable when return hurdles of investment vehicle are
Performance fees met or exceeded
Equity return
from co-investments Recognition of equity return Classification
Regular equity return from own investment in DIC
Equity return investment vehicles (fixed return levels) Equity return
Dividend
Gain in value of equity stake in investment vehicle
Return upside following positive performance Equity return
Recurring (not success based) One-time (success based)
1 Setup fee for new investment vehicles where DIC secures 1-2 properties as start assets for the investment vehicle
38FINANCIALS
INCOME STATEMENT H1 2020
Strong rise in income from Institutional Business lifts profit for the period
1 Mainly as a result of last year's acquisitions, the gross rental income
increased by 3% to EUR 51.4 million (H1 2019: EUR 49.7 million)
2 Real estate management fees more than doubled from EUR 17.5 million
to EUR 42.1 million due to the significant increase in assets under
management in the Institutional Business compared to the same period
of the previous year, mainly based on new vehicles structured and
launched and anorganic growth in the Institutional Business in 2019
3 Operating expenses were strongly influenced by the anorganic growth of
the Institutional Business in 2019, and to some extent by higher
operating expenses in the Commercial Portfolio from mainly higher legal
and consulting fees due to Covid-19
4 Due to the measures implemented in the second half of 2019 to
optimize our financing structure with the repayment of the bond 14/19
with a coupon of 4.625% p.a. and a volume of EUR 175 million and the
first issue of low-interest promissory notes (average 1.55% p.a. with a
volume of EUR 180 million), the net interest result increased by
EUR 2.7 million to EUR -14.2 million (H1 2019: EUR -16.9 million)
5 Profit for the period increased in the first half 2020 by 10% to
EUR 28.5 million (H1 2019: EUR 25.9 million). Due to the positive
development of the FFO, we were able to achieve a positive result
despite lower earnings from sales as well as increased depreciation and
amortization
39FINANCIALS
BALANCE SHEET PER 30.06.2020
Capital Increase strengthens Equity Base
1 Balance sheet as of 30 June 2020 is mainly impacted by the capital increase
in January 2020 (6,857,774 new shares at a price of EUR 16.00). Total
assets increased by EUR 68.1 million compared to year-end 2019
2 Current assets increased by EUR 68.1 million, mostly due to the positive
cash inflow from the capital increase (EUR 107.3 million net proceeds)
3 Total equity increased by EUR 128.4 million, mostly due to the net proceeds
of EUR 107.3 million from the capital increase on the one hand and the
consolidated profit for the period H1 2020 of EUR 28.5 million on the other
hand
4 Due to refinancing activities in H1 2020, we see a shift between non-
current loans and borrowings and current loans and borrowings compared to
year end 2019
5 Equity ratio increased by 380 bp compared to 31 December 2019, mostly as
a result of the net proceeds from the capital increase in January 2020 and
the profit for the period H1 2020
40FINANCIALS
DIVERSIFIED INCOME MITIGATES VOLATILITY FROM EXOGENOUS SHOCKS
Income development H1 2020
Stable development of rental income… ... plus strong growth of real estate management fees
in EUR million in EUR million
In addition, sales profit and... ...profit of associates supplement main income streams
in EUR million in EUR million
41FINANCIALS
FUNDS FROM OPERATIONS INCREASED BY 18%
Growing real estate platform in Institutional business and optimised financial structure leads to higher FFO
FFO-Bridge Main differences year-over-year:
in EUR million
1
Increased valuation allowances for
rent receivables of EUR 3.1 million
for unpaid rents in the period April
to June 2020 lowered net rental
income
2
Growth of platform (increase in
number of vehicles and AuM) as
well as successful transactions as
drivers of fee growth
3
Reduction due to the
discontinuation of TLG dividend in
2020 (FFO contribution of
EUR 10.0 million in H1 2019)
4 Increased OPEX mainly due to full
consolidation of GEG for six
months in H1 2020
5
Improvement of financial structure
with reduced interests (repayment
of bond 14/19 in H2 2019, issue
of promissory note with
significantly lower coupon)
42FINANCIALS
SEGMENT REPORTING H1 2020
Institutional Business delivering consistently growing FFO contribution
Main drivers Commercial Portfolio:
Gross rental income increased by 3% y-o-y,
mainly due to acquisitions
Lower net rental income due to increased
valuation allowances for rent receivables not
paid in period April to June 2020 due to
Covid-19 regulation
OPEX increased by EUR 1 million mainly due
to administrative costs from increased legal
and consulting services as a consequence of
Covid-19
Main drivers Institutional Business:
Real estate management fees were boosted
by significant increase in AuM from anorganic
growth and new vehicles structured and
launched
Share of the profit of associates increased
from EUR 2.8 million to EUR 6.3 million. In
2019 DIC received additional EUR 13.0
million dividend income from the TLG
participation (sold in 2019)
OPEX were mainly influenced by the
anorganic growth in 2019 and full
consolidation of GEG for six months
43FINANCIALS
ADJUSTED NAV CALCULATION PER 30.06.20
1
Book value of investment properties in EURm 30.06.2020
(Commercial Property segment) Assets (in EUR million) (in EUR per share)
Book value of investment properties 1 1,625.2 20.55
2
Goodwill related to acquisition of GEG Real estate assets acc. to IFRS 5 96.4 1.22
3
Service agreements are intangible assets Equity investments (indirect property) 73.1 0.92
recognised as within the scope of the Goodwill 2 177.9 2.25
Service agreements 3 43.9 0.55
purchase price allocation following the
Carrying amount of receivables from related parties 4 135.2 1.71
acquisition of GEG Cash and cash equivalents 416.6 5.27
4
Carrying amount of receivables from Other assets 157.2 1.99
related parties Total assets 2,725.5 34.46
5
Fair value adjustment for investment Deduct Total liabilities (1,628.3) (20.59)
properties as well as equity investments in
associates and other investments, based Total equity 1,097.2 13.87
on an audited valuation (cost accounting)1 Deduct Minorities (4.1) (0.05)
Total shareholder’s equity (book value) 1,093.1 13.82
6
Adjustments to deferred tax on Fair value adjustment of investment properties and equity investments 5 283.6 3.59
investment properties in IFRS financial Other adjustments 6 5.7 0.07
statements and fair value of financial EPRA-NAV 1,382.4 17.48
instruments Deduct Goodwill and other intangible assets/liabilities (194.3) (2.45)
Fair value of Institutional Business 7 557.0 7.04
7
Fair value of Institutional Business based Adjusted NAV 1,745.1 22.07
on audited valuation
Adjusted NAV of EUR 22.07 per share reflects the full value of Institutional Business in the amount of EUR 7.04 per share
EUR 2.45 has already been included in the EPRA-NAV calculation via the goodwill of GEG and other intangible assets/liabilities
1The fair values calculated (net value after deducting transaction costs) are based entirely on the findings of the independent valuers contracted for this purpose, Cushman & Wakefield, Jones Lang LaSalle and
ENA Experts, who have undertaken a valuation in accordance with internationally recognised standards
44FINANCIALS
EUR 2.7BN OF ADJUSTED FAIR VALUE CAPTURES ASSET VALUE
OF COMMERCIAL AND INSTITUTIONAL BUSINESS
Book value of investment properties in EURm 30.06.2020
1
(Commercial Property segment) Assets
Book value of investment properties 1 1,625.2
2 Fair value of investment properties Fair value adjustment 277.7
based on an audited valuation1 Fair value of investment properties, total1 2 1,902.9
Fair value of equity investments (indirect Fair value of equity investments (indirect property) 3 127.2
3 Goodwill 4 177.9
property) including equity interest in
Service agreements 5 43.9
associates and other investments Carrying amount of receivables from related parties 6 135.2
4
Goodwill related to acquisition of GEG
Fair value of assets (value) A 2,387.1
5
Service agreements are intangible assets Deduct goodwill (177.9)
recognised as within the scope of the Deduct service agreements (43.9)
purchase price allocation following the Add fair value of Institutional Business 7 557.0
acquisition of GEG
6 Adjusted fair value of assets (value) B 2,722.3
Carrying amount of receivables from
related parties Liabilities
7
Fair value of Institutional Business based Non-current liabilities to banks 1.027.6
Current liabilities to banks 104.2
on audited valuation
Related party liabilities 17.4
Corporate bond 325.6
Less cash and cash equivalents (416.6)
Net liabilities (loan) C 1,058.2
LTV2 (=C/A) 44.3%
Adjusted LTV2 (=C/B) 38.9%
Adjusted fair value sums up to EUR 2.7 billion, accounting for fair value of Commercial Portfolio and Institutional Business segment
LTV (30.06.2020) of 44.3%2, reduced by 350 basis points compared to year-end 2019 after capital increase in January 2020
Adjusted LTV of 38.9%2 including fair value of Institutional Business segments
1The fair values calculated (net value after deducting transaction costs) are based entirely on the findings of the independent valuers contracted for this purpose, Cushman & Wakefield, Jones Lang LaSalle and
ENA Experts, who have undertaken a valuation in accordance with internationally recognised standards; 2 LTV excl. warehousing
45OTHER
SUPERVISORY BOARD
Highly reputable supervisory board members with long-term real estate expertise
Prof. Dr. Gerhard Schmidt Klaus-Jürgen Sontowski
Chairman of the Supervisory Board Deputy Chairman of the Supervisory Board
Managing Partner Germany of Weil, Gotshal & Manges LLP Founding Partner and Managing Director of
Sontowski & Partner GmbH
Prof. Dr. Ulrich Reuter Eberhard Vetter
Member of the administrative board of Head of Investments of RAG-Stiftung
Versicherungskammer Bayern, Versicherungsanstalt des
öffentlichen Rechts; Professor for public law at University
of Aschaffenburg
Michael Zahn René Zahnd
Chief Executive Officer of Deutsche Wohnen SE Chief Executive Officer of Swiss Prime Site AG
Independent, as defined by Deutscher Corporate Governance Kodex (DCGK) as of 7 February 2017
46NOTES
47DISCLAIMER
This publication constitutes neither an offer to sell nor a solicitation to buy or subscribe to any securities. In case of an offer of securities the information legally
required to be provided to investors will be contained only in a securities prospectus as approved by the competent authority. The information contained herein
is not for distribution, directly or indirectly, in or into the United States of America (including its territories and possessions of any State of the United States of
America or the District of Columbia) and must not be distributed to U.S. persons (as defined in Regulation S of the U.S. Securities Act of 1933, as amended
("Securities Act")) or publications with a general circulation in the United States of America. This publication constitutes neither an offer to sell nor a solicitation
to buy or subscribe to any securities in the United States of America. None of the securities of DIC Asset AG have been registered under the Securities Act and
may not be offered or sold in the United States of America absent registration or an exemption from registration under the Securities Act.
This publication is only addressed to and directed at persons in member states of the European Economic Area who are "qualified investors" within the meaning
of Article 2(1)(e) of the Prospectus Directive (Directive 2003/71/EC as amended) ("Qualified Investors"). In addition, in the United Kingdom, this publication is
being distributed only to, and is directed only at, Qualified Investors who (i) are persons who have professional experience in matters relating to investments
falling within Article 19(5) of the Financial Services and Markets Act 2000 (Financial Promotion) Order 2005, as amended (the "Order"), (ii) are high net worth
entities falling within Articles 49(a) to (d) of the Order, or (iii) other persons to whom it may otherwise lawfully be communicated. This presentation should not
be regarded by the recipient as a substitute for the exercise of its own judgment. Nothing contained herein is, or shall be relied upon as, a promise or
representation as to the past or future. No representation or warranty, expressed or implied, is made as to, and no reliance should be placed on, the fairness,
accuracy, completeness or correctness of the information, or opinions contained in this presentation. Neither DIC Asset AG nor any of its advisors or
representatives shall have any responsibility or liability whatsoever (for negligence or otherwise) for any loss howsoever arising from any use of this document
or its contents or otherwise arising in connection with this presentation.
This presentation speaks as at the date hereof (unless an earlier date is otherwise indicated in the presentation) and in giving this presentation, no obligation is
undertaken and nor is any representation or undertaking given by any person to provide the recipient with additional information or to update, revise or
reaffirm the information contained in this presentation or to correct any inaccuracies therein which may become apparent. This presentation may contain
certain forward-looking statements, forecasts, estimates, strategic targets, projections and opinions ("Forward Statements"). No representation is made or will be
made that any Forward Statements will be achieved or will prove to be correct. Actual future results and operations could vary materially from the Forward
Statements. Similarly no representation is given that the assumptions disclosed in this presentation upon which Forward Statements may be based are
reasonable.
UNLESS EXPRESSLY STATED OTHERWISE, ALL INFORMATION, DATA, VIEWS AND FORWARD-LOOKING STATEMENTS CONTAINED IN THIS COMPANY
PRESENTATION ARE BASED ON INFORMATION, DATA AND FORECASTS AVAILABLE TO THE COMPANY AT THE TIME OF THE PUBLICATION OF THIS
COMPANY PRESENTATION. THE COMPANY IS NOT OBLIGED TO UPDATE THIS COMPANY PRESENTATION UNDER RELEVANT LAWS AND THEREFORE
WILL NOT UPDATE THIS COMPANY PRESENTATION WHATSOEVER. ALL INFORMATION AND DATA CONTAINED IN THIS COMPANY PRESENTATION
ARE BASED ON INFORMATION AND DATA, WHICH WAS PREVIOUSLY PUBLISHED BY THE COMPANY IN CONNECTION WITH ITS CONTINUOUS
REPORTING OBLIGATIONS UNDER RELEVANT FINANCIAL OR SECURITIES LAWS.
Company presentation as of October 2020
48You can also read