Comparative study of the carbon stock of a cashew tree plantation Anacardium - NIPPON, Journal of Environmental Science
←
→
Page content transcription
If your browser does not render page correctly, please read the page content below
Nippon Journal of Environmental Science
 ISSN: 2435-6786
 2020; 1(9): 1022
 https://doi.org/10.46266/njes.1022

 © 2020 by Authors

Full Length Research Paper

 Comparative study of the carbon stock of a cashew tree plantation (Anacardium
 occidentale L.) and secondary forest in Casamance, Senegal
 Seydou Ndiaye1*, Pape Ibrahima Djighaly1,2, Amadou Mbarrick Diarra1, Fodé Amata Dramé3
1
 Assane Seck University of Ziguinchor, Laboratory of Agroforestry and Ecology, BP: 523 Ziguinchor, Senegal
2
 Senegalese Agricultural Research Institute, National Agricultural Research Centre of Bambey, Sénégal
3
 Assane Seck University of Ziguinchor, Laboratory of Geomatics and Environment, BP: 523 Ziguinchor, Senegal

 *Corresponding author: s.ndiaye2860@zig.univ.sn

 Received 01 November 2020; Accepted 15 January 2021

Abstract. The role of trees in carbon sequestration is of major importance in this global context of global warming. In view of
the extent of degradation of forest resources in Casamance, it is necessary to evaluate the carbon stock potential of the secondary
forests and cashew tree plantation, which are the main forest formations in this part of Senegal. For this purpose, an allometric
equation was used to estimate the dry biomass. This assessment was made based on a floristic inventory carried out using 150
plots dimension 20 m x 20 m and the secondary forest 96 plots dimension 50 m x 50 m. The results show that the species richness
in the secondary forest is 45 species with a density of 696 individuals / ha. In the cashew tree park, it is 8 species with a density
of 205 individuals / ha. A comparison of carbon stock shows that the secondary forest has a potential of 58.274 t C/ha and
109.398 t C/ha for cashew tree plantation with a significant difference (p = 3.09e -12). The CO2 equivalent varies respectively
from 213.69 t/ha for the secondary forest and 401.14 t/ha for the cashew tree plantation (p = 1.14e -12). This study shows that
cashew tree plantation have a higher carbon sequestration potential than secondary forest and contribute significantly to the
reduction of CO2 emissions to the atmosphere.

Keywords: Carbone sequestration; Secondary forest; Cashew Tree Park; Global warming

1. INTRODUCTION

 The increase in carbon emissions is one of the main concerns in the context of climate change (Yenonfan et al.,
2020). According to several studies, it is shown that forests constitute a carbon reservoir to store CO 2 located in the
atmosphere (Alamgir et al., 2008).
 Currently, studies on agricultural production systems and climate change are mainly limited to the quantification
of greenhouse gas emissions (CO2, CH4, N2O) due to nitrogen fertilization, decomposition of organic matter, animal
excreta, etc. (Dixon et al., 1994). Carbon sequestration projects eligible for the eco-friendly development mechanism
are currently tree plantations and natural forest regeneration.
 However, there is a growing interest in agroforestry activities (Valentini, 2007). Indeed, forest vegetation and
soils store about 60% of total terrestrial carbon (Winjum et al., 1998).
 The importance of the tree has received particular attention from several researchers due to its potential in climate
change mitigation (Schroeder et al., 1993; Mitchell Aide et al., 2000; Oelbermann et al., 2004). It is reported that the
carbon sequestration capacity is higher in agroforestry and forestry systems than in conventional agricultural systems,
since the aboveground biomass present is more important (Dixon, 1994; Palm et al., 2000; Albrecht and Kandji,
2003).
 However, natural forest ecosystems in West Africa, and more particularly in Senegal, are being subjected to a
series of transformations to make way for agroforests (Yabi et al., 2013), classic cashew tree plantations (Anacardium
occidentale L.) (Ndiaye et al., 2020), and crop fields with modified floristic composition (Yaméogo et al., 2005,
Meunier et al., 2014).
 As in several countries, in Senegal and particularly in Casamance, natural forest ecosystems are increasingly
giving way to cashew tree agrosystems (Ndiaye, 2020). Indeed, according to Samb et al. (2018), the surface area of
cashew tree plantation in Senegal increased from 910.55 km2 to 1908.5 km2 between 1986 and 2017.

 1
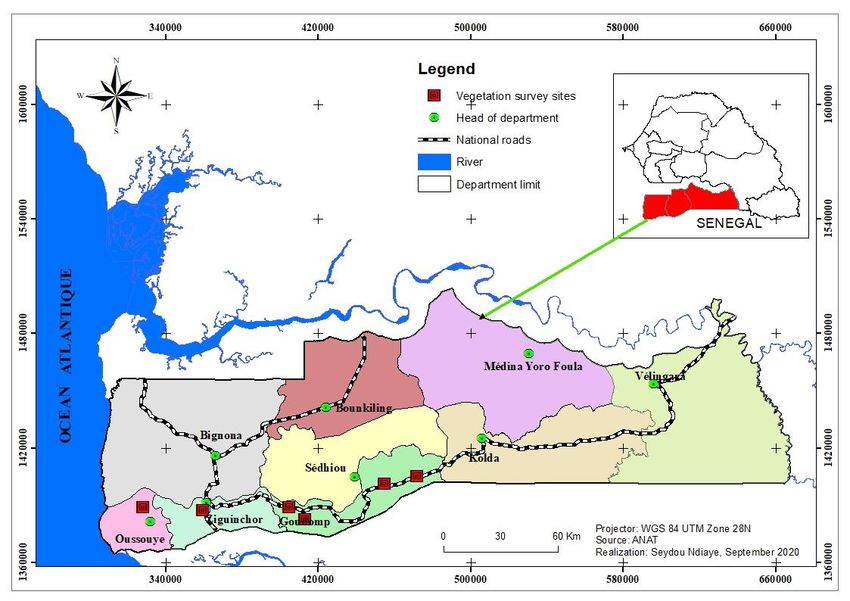
Ndiaye et al.
Comparative study of the carbon stock of a cashew tree plantation (Anacardium occidentale L.) and secondary forest in Casamance,
 Senegal

As a result, plateau areas are the most prone to the expansion of cashew tree plantation. Thus, more than 80% of the
plateau lands are occupied by cashew trees (PADEC, 2016). In this context of climate change, these cashew
agroforests could contribute to climate change mitigation through the absorption of CO2 emissions. The objective of
this study is to evaluate the potential of carbon sequestration in cashew tree parks compared to a secondary forest in
Casamance.

2. MATERIALS AND METHODS

2.1. Study area
 The inventories were carried out in six (07) sites including 05 in the department of Goudomp, 01 in the department
of Ziguinchor and 01 in the department of Oussouye. Casamance covers an area of 28,350 Km² or 1/7 of the area of
Senegal. It is bordered from East to West by a 300 km long river that gives its name to the region (Sané et al, 2010).
These are the regions of Ziguinchor, Sédhiou, and Kolda, respectively in Lower, Middle, and Upper Casamance
(Figure 1).

 Figure 1: Location of inventoried sites

2.2. Sampling
2.2.1. Cashew tree plantations Inventory
 Cashew tree sampling is carried out at 05 sites, 4 of which are in the Goudomp department and 01 in the
Ziguinchor department. The intensity of cashew nut production in the different localities guided the choice
of sites. A total of 16 plantations were inventoried. Over an area of 50 ha, divided into 96 plots of 50 m x
50 m with 6 plots/planting.

2.2.2. Secondary forest inventory
 The opening of the layons was adopted to facilitate the inventory given that the forest is very dense and
almost impenetrable. For this purpose, 6 layons equidistant of 100 m were cleared and on each layon, square
plots of 20m x 20m side, equidistant of 10 m were installed. A total of 150 plots were created to cover the
entire area to be inventoried, which corresponds to an area of 6 ha. The sampling rate is 18.75%.
 Each survey area is pre-defined (by method 3-4-5) with a 50m long tape measure, delimited by 8 stakes
and located using a GPS (Global Positioning System) device. In each vegetation survey, an inventory of
woody species with a diameter at chest height higher than 10 cm was carried out. Measurements of
 2

Nipp. J. Environ. Sci., 1(9): 1022 dendrometric parameters included the height of the individuals and the diameter of the trunk at 0.3 m from the ground. 2.3. Carbon estimation methods To measure the amount of carbon sequestered in an ecosystem, scientists generally assess the biomass present in the plots, since plants accumulate atmospheric CO2 in their cellular components (Tufekcioglu et al., 2003; Sharrow and Ismail, 2004). GIEC (2001) defines biomass as the "total mass of living organisms within a perimeter or volume". Therefore, it is expressed in kilograms (on a dry weight basis). To obtain the quantity of total carbon sequestered in a plot, the biomass is multiplied by the carbon content of the plants. It has been reported that the carbon contained in the dry biomass of a tree is 50% (Malhi et al., 2004). In this study, the dry biomass present in the aboveground and below-ground components is evaluated (Table 1). Table 1: Biomass estimation models Allometric model Formulas Cairns et al. (1997) Aerial biomass (AB) = (-0.463*D) + (0.356*D2) + (0.008*D3) Root biomass (RB) = Exp (-1.0587+ (0.8836*ln (RB)) With D: diameter chest height and total biomass = AB +RB The atomic molar mass of carbon is 12 and the atomic weight of oxygen is 16. So the atomic weight of the CO2 molecule is C+2xO: 12+ 2x16= 44. The ratio of the atomic weight of CO2 to that of carbon is 3.667. To determine the quantity of atmospheric CO2 sequestered by the tree, the carbon stock in the tree is multiplied by 3.667 (Cienciala et al., 2005). 2.4. Data processing Diversity indices were used to study the diversity of the woody tree. The Shannon index (H0) is used to calculate the level of species diversity in a given environment. It takes into account not only the number of species, but also the distribution of individuals within these species. It is often between 0 and 4.5, rarely higher. It is calculated using the following equation: H’= -∑ =1 log(2) avec Fi = Frequency of species i (Legendre et Legendre, 1984). The value of the index varies according to the number of species present and their relative proportions. This makes its use less exhaustive for the comparison of two environments with very different specific richness. Thus, Evenness index (E) becomes more interesting for comparing different environments (Devineau et al., 1984). The value of the index varies from 0 to 1; a high value of this index (i.e. close to 1) indicates that the stand is homogeneous, or that individuals are equitably distributed among the different species. On the other hand, when the index value is low (i.e. close to 0), the stand is dominated by one or a few species. Evenness expresses the distribution of species within the association. It varies between 0 and 1, is without units, and corresponds to the ratio of Shannon index (H0) and maximum value of Shannon index (H’ max): Evenness is represented as follows: H′ E= H′ with H’ = Shannon index; H’ max = log2S, S is the total specific richness. max The Jaccard similarity index allows a comparison between two sites, as it assesses the similarity between two surveys by relating the species common to both surveys to those specific to each survey. Jaccard’s similarity index is represented as follows: a J= where a is the number of species present in both samples (joint occurrences), b is the number a+b+c of species present in sample one, and c is the number of species present in sample two. The density of a species is the number of feet belonging to the species per unit area. It is expressed in number of individuals per hectare (n.ha-1.). Diameter classes and amplitudes and were defined using the formula of Sturges (1926): Number of classes = 1+ 3,3log2 N where N is the sample size 3
Ndiaye et al. Comparative study of the carbon stock of a cashew tree plantation (Anacardium occidentale L.) and secondary forest in Casamance, Senegal iMax−iMin The amplitude (P) is obtained by: P = where i represents the sample values. C 3. RESULTS 3.1. Specific richness and density The inventory carried out in the natural forest allowed to identify 45 species with different proportions in terms of density. The average density is 694 individuals/ha. The dominant species are: Detarium guineensis Gmel. (122 individuals/ha) followed by Trichilia prieureana A. Juss. (84 individuals/ha), Eleais guineensis Jacq. (72 individuals/ha) and Fagara zantoxyloïdes Lam. (55 individuals/ha). In the cashew tree plantation, 8 species were inventored with an average density of 8 species/ha. Cashew tree plantation density is 180 individuals/ha (Table 2). Table 2: Characteristics of the two types of ecosystems Secondary forest Cashew tree plantation from 18 to 25 years old Floristic composition Abundance Floristic composition Abundance (Number of (Number of individuals) individuals) Adansonia digitata L. 22 Anacardium occidentale 180 L. Albizzia zygia (DC.) J.F. Macbr. 6 Eleais guineensis Jacq. 3 Afzelia africana Smith. 13 Tectona grandis 14 Allophyllus africanus P. Beauv. 53 Mangifera indica L. 2 Alchornea cordifolia (Schumach. & Thonn.) Müll. 20 Parkia biglobosa (Jacq.) 3 Arg. R. Br. Anacardium occiditentale L. 12 Ficus copensis 1 Anthocleista procera Lepr. 12 Adansonia digitata L. 1 Annona senegalensis Pers. 57 Ceiba pentandra (L.) 1 Gaertn Anthostema senegalensis Juss., W. 103 Antiaris africana Engl. 4 Borassus akeassii Bayton, Ouédraogo & Guinko 26 Ceiba pentandra (L.) Gaertn 17 Carapa procera Dc 2 Citrus medica L. 1 Combretum micrantum G. Don 2 Dalbergia melanoxylon Guill. & Perr. 3 Dialium guineesis Willd. 26 Detarium guineensis Gmel. 734 Dichrostachys glomerata (Forssk.) Chiov 179 Eleais guineensis Jacq. 434 Fagara rubescens (Planch. ex Hook.f.) 5 Fagara zantoxyloïdes Lam. 331 Faidherbia albida (Del.) Chev. 29 Ficus sycomorus ssp. gnaphalocarpa (Miq.) C.C. 73 Berg Ficus thonningii Blume. 12 Ficus vogelii (Miq.) Miq. 3 Chlorophora regia A. Chev. 1 Khaya senegalensis (Desr.) A. Juss. 4 4
Nipp. J. Environ. Sci., 1(9): 1022

 Kigelia africana (Lam.) Benth. 95
 Landolphia heudelotii A. DC. 201
 Lannea acida A. Rich. 35
 Malacantha alnifolia (Bak.) Pierre 168
 Mangifera indica L. 293
 Nauclea latifolia Sm. 11
 Parinari excelsa Sabine. 8
 Parinari macrophylla Sabine 175
 Parkia biglobosa (Jacq.) R. Br. 92
 Piliostigma thonningii (Schumach.) Milne-Redh. 27
 Sabicea venosa Benth. 273
 Saba senegalensis (A. DC.) Pichon 19
 Spondias monbin L. 2
 Trichilia prieureana A. Juss. 509
 Terminalia macroptera Guill. & Perr. 21
 Uvaria chamae P. Beauv. 28
 Vitex doniana Sweet 1
 Total 45 species 696 08 species 205
 individuals / individuals /
 ha ha

3.2. Relationship between density and basal area in the two types of ecosystems
 The carbon sequestration potential depends on the density and diameter of the trees. It is important to know the
structural parameters of both types of formations. Thus, in cashew tree plantation, since the individuals consist of
large trees with high density (205 individuals / ha), the density is highly correlated to the basal area (R2 = 0.8859).
This reflects a good distribution of the aerial cover of the trees (Figure 2A). As for secondary forests, despite the high
density noted (694 trees/ha), the density is not highly correlated (R2 = 0.325) with the basal area because of the
predominance of young trees (Figure 2B).

 Figure 2: Density regression models as a function of basal area: A = cashew tree plantation and B = secondary
 forest.

 5
Ndiaye et al.
Comparative study of the carbon stock of a cashew tree plantation (Anacardium occidentale L.) and secondary forest in Casamance,
 Senegal

3.3. Shannon index and Evenness
 L’indice de Shannon qui permet d’apprécier la distribution des individus suivant les espèces montre que les
individus sont équitables répartis par espèces dans les forêts secondaires (H’ = 4,13 bits). Dans les parcs à anacardier,
c’est plutôt le contraire qui a été noté où l’anacardier est l’espèce dominante (H’ = 0,8 bit). Le test de Student Newman
Keuls montre une différence significative de la distribution des individus par espèces entre les ces types de formations
végétales (p = 5,86e-15). L’indice d’équitabilité de Piellou plus exhaustif pour la comparaison de deux milieux montre
également que les forêts secondaires de la Casamance sont homogènes et que les parcs à anacardier sont dominés par
une seule espèce (Tableau 3).
 Shannon's index, which allows to appreciate the distribution of individuals according to species, shows that
individuals are equitably distributed by species in secondary forests (H' = 4.13 bits). In the cashew tree plantation, it
is rather the opposite which was noted where the cashew tree is the dominant species (H' = 0.8 bit). The Student
Newman Keuls test shows a significant difference in the distribution of individuals by species between these types
of formations (p = 5.86e-15). The more exhaustive Evenness index for the comparison of two environments also shows
that the secondary forests of Casamance are homogenous and that cashew tree plantation are dominated by a single
species (Table 3).

 Table 3: Diversity index
 Variables Shannon index Evenness (E)
 (H’)
 Secondary forest 4.13 bits (a) 0.75 (a)
 Cashew tree plantation 0.8 bit (b) 0.27 (b)
 Pr (>F) 5.86e-15 *** 2e-16 ***
 Signif. codes : 0 ‘***’ 0.001 ‘**’ 0.01 ‘*’ 0.05 ‘.’ 0.1 ‘ ’ 1
 The letter (a-b) represents the significant differences between the indices of the two types of vegetation
 formations.

3.4. Jaccard similarity index
 This index measures the proportion of common species between the two environments. It shows that the similarity
of the environments in terms of species is very low (13%). The diversity is very different in the two plant formations
(Table 4).

 Table 4: Jaccard similarity index
 Secondary forest Cashew tree plantation
 Secondary forest 1
 Cashew tree plantation 0.13 1

3.5. Carbon stock and economic equivalent to the REDD+ market
 The carbon stock estimate shows that it is 58.274 t C/ha in secondary forests compared to 109.398 t C/ha in
cashew tree plantation. However, the Newman Keuls test at the 5% threshold shows a significant difference in carbon
stock between these two ecosystems formations (p = 3.09e-12). The CO2 equivalent is 213.69 t /ha for secondary
forests and 401.14 t/ha for cashew tree plantation with a significant difference (p = 1.14e-12). This gives an economic
value of 1,946,224.4 FCFA for secondary forests and 3,653,667.3 FCFA for cashew tree plantation (Table 5).

 Table 5: Estimation of biomass, carbon stock and equivalent economic value / ha
 Variables Secondary forest Cashew tree Student Newman Keuls
 plantation Test at the 5% threshold
 Aerial Biomass (BA) 99.275 t/ha 198.343 t/ha Pr (>F) = 0.0019 **
 Root Biomass (BR) 17.273 t/ha 20.453 t/ha Pr (>F) = 0.000568 ***
 Total Biomass (BT) 116.548 t/ha 218.796 t/ha Pr (>F) = 2e-16 ***
 Sequestered carbon stock 58.274 t C/ha 109.398 t C/ha Pr (>F) = 3.09e-12 ***
 CO2 equivalent 213.69 t/ha 401.14 t/ha Pr (>F) = 1.14e-12 ***
 REDD+ carbon price (14 Euro/T) 2991.66 5616.27 ---

 6
Nipp. J. Environ. Sci., 1(9): 1022

 REDD+ carbon price (FCFA) 1 946 224.4 3 653 667.3 ---
 Signif. codes : 0 ‘***’ 0.001 ‘**’ 0.01 ‘*’ 0.05 ‘.’ 0.1 ‘ ’ 1

3.1. Distribution of CO2 stock and basal area according to diameter classes
 The CO2 stock and the basal area evolve proportionally for each of the two types of formations according to the
different diameter classes. The highest values of sequestered CO2 correspond to the highest values of the basal area.
For cashew tree plantation (Figure 3), the high value of the CO2 stock starts from the diameter (≥ 95 cm).

 180
 CO2 (T/ha) Basal area (m2/ha)
 160

 140

 120
 Values

 100

 80

 60

 40

 20

 0
 0 50 100 150 200 250 300 350
 Diameter classes (cm)

 Figure 3: Distribution of CO2 equivalent and basal area by diameter classes in cashew tree plantation

 In the secondary forest (Figure 4), this value starts from 12 cm. In general, the high density has a negative impact
on the CO2 stock. For this implies a decrease in the size of tree diameters.

 7.000000 Basal area (m2/ha) CO2 (T/ha)

 6.000000

 5.000000

 4.000000
 Values

 3.000000

 2.000000

 1.000000

 0.000000
 0 10 20 30 40 50 60
 Diameter classes (cm)

 Figure 4: Distribution of CO2 equivalent and basal area by diameter classes in a secondary forest

4. DISCUSSION
 The diversity within the two types of ecosystems shows that the establishment of cashew tree plantation leads to
selective cutting of more than 37 species in secondary forests in Casamance. This low diversity noted in cashew tree
plantation was reported by Ndiaye et al. (2017) who reported a diversity of 5 species/plantation at the level of the
 7
Ndiaye et al.
Comparative study of the carbon stock of a cashew tree plantation (Anacardium occidentale L.) and secondary forest in Casamance,
 Senegal

former rural community of Djibanar in Senegal. Other authors showed that agroforestry systems offer higher
diversity, which varies according to silvicultural techniques and localities (Sonwa et al., 2001; 2007; Zapfack et al.,
2002). According to Manfo et al. (2015) a cocoa-based agroforest can conserve up to 47 species depending on the
use systems in the plots. The absence of regeneration in the cashew tree plantation is explained by the intensity of
the work during plantation maintenance prior to nut collection operations. Indeed, just before the nut harvest, the
producers clean the cashew nut plantations to facilitate the collection. This does not encourage the development of
young plants (Ndiaye, 2020). The morphological variability of the different individuals shows that in the secondary
forests of Casamance, individuals of medium diameters are very present contrary to cashew tree plantation which are
mostly composed of large diameters.
 However, given the morphological and physiological variability of woody species, Montagnini and Nair (2004)
reports that the amount of carbon sequestered is dependent on tree species, geographical regions (climate, soil),
planting densities and management of the system. Thus, the highest densities were noted at the level of secondary
forests (696 individuals / ha) and 205 individuals / ha for cashew tree plantation.
 The carbon stock in the secondary forests and cashew tree plantation of Casamance are estimated at 58.274 t C/ha
and 109.398 t C/ha respectively. For the secondary forests, this value is almost equal to that of France (59 t C/ha),
the Netherlands and Belgium (60.8 t C/ha) (Pignard et al., 2000; Lebègue et al., 2004). Compared to cashew tree
plantation, they have a higher carbon stock potential than forests in Germany, which is 100 t C/ha (Baritz, Strich,
2000).
 Even if the soil component was not taken into account in this study, the values obtained in cashew tree plantation
are much higher than those obtained in Néré and Karité plantation in Benin. The carbon stock in these parks varies
32.62 ± 5.91 t C/ha. In Côte d'Ivoire, Gueulou et al. (2020) obtained a mean carbon stock value of 22.21 t C/ha at the
Lamto Scientific Reserve.
 According to Albrecht and Kandji (2003), the carbon stock capacity of an agroforestry system varies between 12
and 228 t C/ha with an average value of 95 t C/ha. This defined interval confirms the results obtained in this study
with regard to cashew tree plantation.

5. CONCLUSION

This study showed that cashew tree plantation, beyond their economic and social contribution to the health of rural
populations, can play a major role in carbon stock thanks to the high potential of cashew tree plantation in terms of
atmospheric carbon storage. Thus, it is necessary to apply rigorous management in these agro-systems so that they
can fully play their role in mitigating CO2 emissions into the atmosphere.

Conflict of Interest: authors declare that there is no conflict of interest.

REFERENCES

Alamgi M. and Al-Amin M. (2008). Allometric models to estimate biomass organic carbon stock in forest vegetation.
 Journal of Forestry Research 19, 101–106.
Albrecht, A. et Kandji, S.T. (2003). Carbon sequestration in tropical agroforestry systems. Agriculture, Ecosystems
 and Environment. 99: 15-27.
Baritz R., Strich S. (2000). Forests and the National Greenhouse Gas Inventory of Germany. Biotechnol. Agron. Soc.
 Environ. 4 (4), p. 267–271.
Cairns, M.A., S. Brown, E.H. Helmer, G.A. Baumgardner. (1997). Root biomass allocation in the world's upland
 forests. Oecologia.111, 1-11.
Cienciala E., Apltauer J., Cerny M., and Exnerova Z. (2005). Biomass functions applicable for European beech,
 Journal of Forest Science 51: 147–154.
Devineau J., Lecordier C. & Vattoux R. (1984). Evolution de la diversité spécifique du peuplement ligneux dans une
 succession préforestière de colonisation d’une savane protégée des feux (Lamto, Côte d’Ivoire). Conservatoire
 et jardin botanique Genève, 39(1), 103-133
Dixon, R.K., Brown, S., Houghton, R.A., Solomon, A.M., Trexler, M.C. and Wisniewski, J. (1994). Carbon pools
 and flux of global forest ecosystems. Science 263, 185–190.
GIEC. (2001). Bilan 2001 des changements climatiques : mesures d’atténuation. Rapport du groupe de travail III du
 GIEC. Cambridge University Press, Cambridge, UK, 93 p.

 8
Nipp. J. Environ. Sci., 1(9): 1022

Gueulou N, Douffi K G-C, Yenilougo S, Kone M, and Bakayoko A. (2020). Evaluation de la couverture forestière
 et du stock de carbone forestier de la réserve scientifique de Lamto (Côte d’Ivoire). International Journal of
 Innovation and Applied Studies. Vol. 28 N°3, pp. 682-689
Lebègue C., Laitat É., Perrin D., Pissart G. (2004). Mise en œuvre de carottages de sol et de minirhizotrons pour
 l’étude à long terme de la réponse des fines racines d’épicéa (Picea abies (L.) Karst.) à l’augmentation de la
 concentration en CO2 dans l’atmosphère. Biotechnol Agron. Soc. Environ. 8 (1), p. 41–53
Legendre, L &. Legendre. P. (1984). La structure des données écologiques. 2ième Cd. Tome 2. Masson. Paris et les
 Presses de L’Université du Québec.260p.
Malhi Y, Baker TR, Phillips OL, Almeida S, Alvarez E, Arroyo L, Chave J, Czimczik CI, Di Fiore A, Higuchi N,
 Killeen TJ, Laurance SG, Laurance WF, Lewis SL, Montoya LMM, Monteagudo A, Neill DA, Nunez Vargas
 P, Patin˜ o S, Pitman NCA, Quesada CA, Silva JNM, Lezama AT, Vasques Martinez R, Terborgh J, Vinceti
 B, Lloyd J. (2004). The above-ground coarse wood productivity of 104 Neotropical forest plots. Glob Change
 Biol 10:563–591
Manfo, D. A., Tchindjang, M., Youta, H. J. (2015). Systèmes agroforestiers et conservation de la biodiversité dans
 un milieu fortement anthropisé : le cas d'Obala. Revue Scientifique et Technique Forêt et Environnement du
 Bassin du Congo, 5, 22-34
Meunier, Q., Boldrini S., Moumbogou C., Morin A., Ibinga S., Vermeulen C. (2014). Place de l’agriculture itinérante
 familiale dans la foresterie communautaire au Gabon. Bois et Forêts des Tropiques, 319 (1) : 65-69.
Mitchell Aide, T., Zimmerman, J.K., Pascarella, J.B., Rivera, L. et Marcano-Vegas, H. (2000). Forest regeneration
 in chronosequence of tropical abandoned pastures: implications for restoration ecology. Restoration Ecology.
 8(4): 328-338.
Montagnini, F. et Nair, P.K.R. (2004). Carbon sequestration: An underexploited environmental benefit of
 agroforestry systems. Agroforestry Systems. 61: 281-295.
Ndiaye S, Charahabil M M, Diatta M, Aidara Fall C A L. (2020). Effet de l’anacardier (anacardium occidentale l.)
 sur les proprietes physicochimiques des sols (Casamance / Sénégal). American Journal of Innovative Research
 and Applied Sciences.10 (2): 44-54
Ndiaye S, Charahabil M M, Ndiaye O, Diatta M. (2017). Influence de la flore ligneuse associée dans la production
 des parcs à Anacardium occidentale L. dans la communauté rurale de Djibanar (Casamance/Sénégal). Int. J.
 Biol. Chem. Sci. 11(2): 585-596
Ndiaye S. (2020). Caractérisation agroécologique et socioéconomique des systèmes de production des parcs à
 anacardier En Casamance (Sénégal). Thèse de doctorat, ED-STI, Université Assane Seck de Ziguinchor. 158p
Oelbermann, M., Voroney, R.P. et Gordon, A.M. (2004). Carbon sequestration in tropical and temperate agroforestry
 systems: a review with examples from Costa Rica and southern Canada. Agriculture, Ecosystems &
 Environment. 104: 359-377.
PADEC. (2016). Programme de l’Appui au Développement Economique de la Casamance. Enquête sur le sous-
 secteur de l’anacarde au Sénégal. Résumé global. 23p
Palm, C.A., Woomer, P.L., Alegre, J., Arevalo, L., Castilla, C., Cordeiro, D.G., Feigl, B., Hairiah, K., Kotto-Same,
 J., Mendes, A., Moukam, A., Murdiyarso, D., Njomgang, R., Parton, W.J., Ricse, A., Rodrigues, V., Sitompul,
 S.M. et Van Noordwijk, M. (2000). Carbon sequestration and trace gas emissions in slash-and-burn and
 alternative landuses in the humid tropics. Final Report, Alternatives to Slash and Burn (ABS). Climate Change
 Working Group, Phase II. ICRAF, Nairobi, Kenya. 29 p.
Pignard G., Dupouey JL., Arrouays D., Loustau D. (2000). Carbon stocks estimates for French forests. Biotechnol.
 Agron. Soc. Environ. 4 (4), p. 285–289.
Samb C.O, Faye E, Dieng M, Sanogo D, Samba NSA et Koita B. (2018). Dynamique spatio-temporelle des
 plantations d’anacardier (Anacardium occidentale L.) dans deux zones agro-écologiques du Sénégal. Afrique
 SCIENCE 14(3) (2018) 365 – 377.
Sané T., Benga A. et Sall O, 2010. La Casamance face aux changements climatiques : enjeux et perspectives. 23ième
 Colloque de l’Association Internationale de Climatologie, Rennes 2010. 559-564
Schroeder, P.E., Dixon, R.K. et Winjum, J.K. (1993). Ordenación forestal y agrosilvicultura para reducir el dióxido
 de carbono atmosférico. Unasylva. 173(44): 52-60.
Sharrow, S.H. et Ismail, S. 2004. Carbon and nitrogen storage in agroforests, tree plantations, and pastures in western
 Oregon, USA. Agroforestry Systems. 60: 123-130.
Sonwa, D. J., Weise, S. F., Tchatat, M., Nkongmeneck, B. A., Adesina, A. A., Ndoye, O., Gockowski J. (2001). The
 role of cocoa agroforests in rural and community forestry in Southern Cameroon. Rural Develop For Netw
 Paper 25g: 1–10.

 9
Ndiaye et al.
Comparative study of the carbon stock of a cashew tree plantation (Anacardium occidentale L.) and secondary forest in Casamance,
 Senegal

Sturges H A. (1926). The Choice of a Class Interval. Journal of the American Statistical Association, vol. 21, n° 153,
 mars 1926, p. 65-66
Tufekcioglu, A., Raich, J.W., Isenhart, T.M. et Schultz, R.C. (2003). Biomass, carbon and nitrogen dynamics of
 multi-species riparian buffers within an agricultural watershed in Iowa, USA. Agroforestry Systems. 57: 187-
 198.
Valentini S. G. (2007). Evaluation de la séquestration de carbone dans des plantations agroforestières et des jachères
 issues d’une agriculture migratoire dans les territoires autochtones de Talamanca au Costa ; Mémoire de Maître
 es sciences (M.Sc) ; Faculté des Sciences de l’Agriculture et de l’alimentation, Université Laval Québec,
 (2007) 140 p.
Winjum, J.K., S. Brown, and B. Schlamadinger. (1998). Forest harvests and wood products: sources and sinks of
 atmospheric carbon dioxide. Forest Science 44: 272-284
Yabi I, Yabi Biaou F et Dadegnon S. (2013). Diversité des espèces végétales au sein des agro-forêts à base
 d’anacardier dans la commune de Savalou au Benin. Int. J. Biol. Chem. Sci. 7(2): 696-706
Yaméogo, G., Yélémou B., Traoré D. (2005). Pratique et perception paysannes dans la création de parc agroforestier
 dans le terroir de Vipalogo (Burkina Faso). Biotechnologie, Agronomie, Société et Environnement, 9p.
Yenonfan N L, Gbaï I, Kooke G X, Djossou J-M, A C Kanninkpo et Tente B A H. (2020). Évaluation du stock de
 carbone dans les sols sous plantations d’ananas (Ananas comosus) biologique et conventionnelle sur le plateau
 d’Allada au sud du Bénin. Rev. Ivoir. Sci. Technol., 35 231 – 246
Zapfack, L., Engwald, S., Sonké, B., Achoundong, G., Madong, B. A. (2002). The impact of land conversion on plant
 biodiversity in the forest zone of Cameroon. Biodiversity and Conservation, 11, 2047-2061

 10
You can also read