Comparison of CO2 emissions of MARPOL Annex VI compliance options in 2020 - Safety4Sea
←
→
Page content transcription
If your browser does not render page correctly, please read the page content below

Comparison of CO2 emissions of MARPOL Annex VI compliance options in 2020

Comparison of CO2 emissions of MARPOL
    Annex VI compliance options in 2020

    This report was prepared by:
    Jasper Faber, Anne Kleijn, Diederik Jaspers

    Delft, CE Delft, August 2020

    Publication code: 20.190191E.091

    Client: Alfa Laval, in cooperation with Yara Marine and Wärtsilä

    Publications of CE Delft are available from www.cedelft.eu

    Further information on this study can be obtained from the contact person Jasper Faber (CE Delft)

    © copyright, CE Delft, Delft

     CE Delft
     Committed to the Environment

     Through its independent research and consultancy work CE Delft is helping build a sustainable world. In the
     fields of energy, transport and resources our expertise is leading-edge. With our wealth of know-how on
     technologies, policies and economic issues we support government agencies, NGOs and industries in pursuit of
     structural change. For 40 years now, the skills and enthusiasm of CE Delft’s staff have been devoted to
     achieving this mission.

2   190191 - Comparison of CO2 emissions of MARPOL Annex VI compliance options in 2020 – August 2020
Content
    Summary                                                                                            4

1   Introduction                                                                                       6
    1.1 Background of the study                                                                        6
    1.2 Objective of the study                                                                         7
    1.3 Scope of the study                                                                             7
    1.4 Outline of the report                                                                          7

2   Methodology                                                                                         8
    2.1 Introduction                                                                                    8
    2.2 General approach                                                                                8
    2.3 Reference scenario’s                                                                           10
    2.4 Definition compliance routes                                                                   12
    2.5 Methodology to estimate CO2 impact                                                             16

3   GHG emissions of compliance options                                                                28
    3.1 Introduction                                                                                   28
    3.2 CO2-eq. emissions when using an EGCS                                                           28
    3.3 CO2-eq. emissions when using desulphurised fuel                                                31
    3.4 Conclusion                                                                                     34

4   Conclusion                                                                                         36

5   References                                                                                         37

A   Prelim Hydrorefinery PFD                                                                           39

3   190191 - Comparison of CO2 emissions of MARPOL Annex VI compliance options in 2020 – August 2020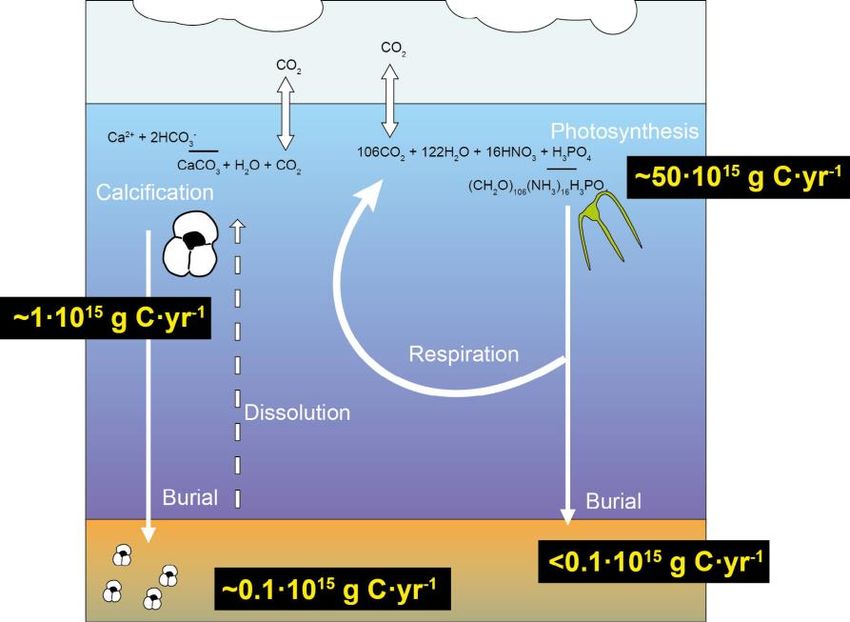
Summary
    MARPOL Annex VI regulation 14 sets limits for the sulphur content of fuel oil.
    As of January 1st, 2020, the sulphur content of fuel oils used outside Emissions Control Areas
    (ECAs) is 0.50% m/m. inside ECAs, the limit has been 0.10% m/m since 2015.

    Apart from using compliant fuels, MARPOL Annex VI allows ships to comply by using
    alternative compliance options, as long as those options are at least as effective in terms of
    emission reductions as the sulphur content limits.

    In practice, there are two options to comply with the MARPOL Annex VI Regulation 14:
    — using an exhaust gas cleaning system (EGCS) in combination with fuel oils with a sulphur
        content that is higher than 0.50% or 0.10%; and;
    — using fuel oil with a sulphur content of 0.50%, respectively 0.10% or less.

    Both options result in an increase of well-to-wake CO2 emissions:
    — an EGCS requires energy which is generated by engines running on fuel oil and thus
        generate CO2;
    — desulphurisation in a refinery requires hydrogen which is generally produced from
        methane, emitting CO2 in the process, as well as energy.
    This report quantifies and compares the CO 2 footprint of both options.

    The analysis is carried out for five reference ships, which collectively provide a good
    reflection of the ship types which currently have installed scrubbers or which have a large
    demand for scrubbers:
    — cruise ship (100,000 GT);
    — small container ship (4,000 TEU);
    — large container ship (18,000 TEU);
    — bulk carrier (80,000 dwt);
    — oil tanker (200,000 dwt).

    The CO2 footprint of using an EGCS depends on the sulphur content of the fuel and the
    amount of fuel a ship uses in an ECA. The higher the difference between the sulphur
    content of the fuel and the allowed emissions of sulphur oxides, the more energy an EGCS
    requires. CO2 emissions associated with producing and installing the EGCS are small
    compared to the operational emissions. In contrast, by discharging acidic washwater into
    the ocean, an EGCS results in CO2 emissions from the ocean, which are of a similar order of
    magnitude as the CO2 emissions from operating the EGCS. In total, CO2 emissions increase
    typically by 1.5-3%.

    The CO2 footprint of desulphurising fuel oil in the refinery depends on the crude oil used
    and the layout of the refinery. Using a generic refinery model, this report analyses the CO2
    impact of two options: hydrotreatment of residual fuel and hydrocracking in combination
    with hydrotreatment.

    In both cases, the fuel quality inevitably improves. This is consistent with earlier studies
    that show that low-sulphur fuels will have a lower viscosity and a lower aromatics content
    than traditional residual fuels.

4   190191 - Comparison of CO2 emissions of MARPOL Annex VI compliance options in 2020 – August 2020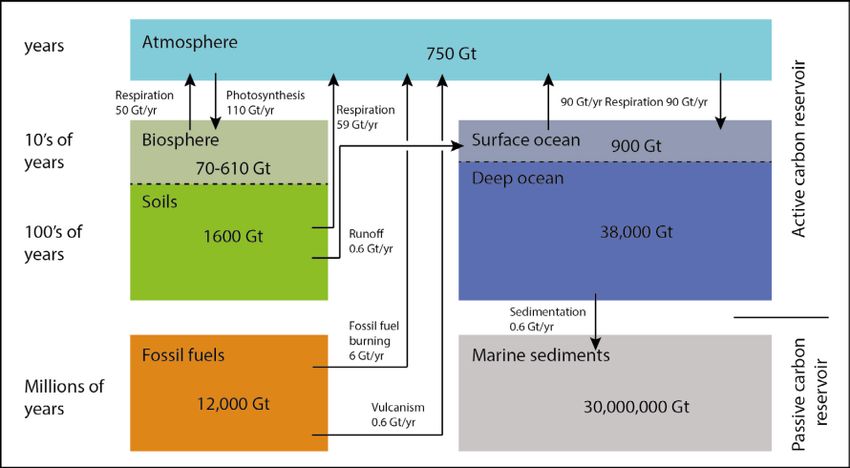
This report finds that the CO2 footprint depends on the extent by which the fuel quality is
    improved. A theoretical calculation of the amount of CO2 emitted only to remove a
    sufficient amount of sulphur from fuel oil shows that the footprint increases by around 1%.
    This method ignores the inevitable fuel quality improvement. A theoretical calculation of
    amount of CO2 required to treat fuel until all the fuel products have the required sulphur
    content shows that the footprint increases by around 20-25%. This calculation ignores the
    fact that many of the resulting products meet quality standards of road or aviation fuels
    and will therefore unlikely be used as marine fuels. Therefore, the former is not physically
    possible, while the quality of the latter fuel is too good to be sold as a marine fuel.
    In reality, the CO2 emissions associated with desulphurising fuels will be between these
    extreme values.

    The additional CO2 emissions of both compliance options are compared with each other.
    The results for a petroleum-based fuel with a sulphur content of 3.5% m/m is shown in
    Figure 1.

    Figure 1 - Additional CO2 emissions (in %) for the reference ships for the different MARPOL Annex VI
    compliance options when using fuel with a sulphur content of 3.5% m/m

     30,0%

     25,0%

     20,0%

     15,0%
             Refinery - likely range

     10,0%

      5,0%

      0,0%
                                       Cruise ship     Small container ship Large container ship     Bulk carrier           Oil tanker

                                                     Packed bed EGCS                       Inline EGCS
                                                     Refinery - theoretical minimum        Refinery - theoretical maximum

5   190191 - Comparison of CO2 emissions of MARPOL Annex VI compliance options in 2020 – August 2020
1 Introduction
1.1   Background of the study
      Since its adoption in 1997, MARPOL Annex VI has included a 4.50% m/m limit to the sulphur
      content of marine fuel. In October 2008, MEPC 58 agreed to reduce the maximum sulphur
      content to 3.5% m/m from 2012 and to 0.5% m/m from 2020 onwards (in emission control
      areas, stricter limits apply) by prohibiting the use of any fuel oil that exceeds this limit.
      The 2020 implementation state has been reaffirmed in 2016 after a fuel oil availability
      assessment concluded the refinery sector has sufficient capacity to meet the demand of the
      shipping sector for compliant fuels.

      Apart from using compliant fuels, MARPOL Annex VI allows ships to comply by using
      alternative compliance options, as long as those options are at least as effective in terms of
      emission reductions as the sulphur content limits. In the case of sulphur, alternative
      compliance options comprise the use of exhaust gas cleaning systems that remove sulphur
      oxides from the exhaust (commonly called EGCSs).

      The number of ships with EGCSs installed or on order was about 1,000 in May 2018 (EGSCA,
      2018) and is expected to be set at around 4,000 in January 2020 (EGSCA, 2019). At the same
      time, discussions continue about the environmental impacts of the use of EGCSs. Both Japan
      and Panama have submitted studies to MEPC 74 on the environmental impacts of EGCSs,
      which reach different conclusions.

      The Japanese research study concludes that risks of discharge water from scrubbers to the
      marine environment and marine aquatic organism are in the acceptable range or negligible
      from both short-term and long-term perspectives (MEPC , 2019). The Panamanian literature
      study concludes that there is cause for concern about the impacts of EGCSs on marine life
      and that PM emissions of ships with an EGCS may be higher than emissions of ships using
      low-sulphur fuels.

      Other studies have analysed the environmental impacts of EGCSs on water quality in ports
      and coastal waters (CE Delft, 2019) or the impact of difference MARPOL Annex VI
      Compliance options on air and water emissions, based on a case study (IVL, 2019).

      From the different submissions and other studies, it is clear that there is uncertainty about
      the environmental impacts of the use of EGCSs, both about which environmental impacts
      are relevant, how large the impacts are and about how they should be judged.

      In order to provide factual input to the debate, this report analyses the environmental
      impact of EGCSs and compare the results with the environmental impact of using compliant
      fuels. In order to compare like-with-like, the impact is assessed from well-to-wake for five
      different reference ships.

6     190191 - Comparison of CO2 emissions of MARPOL Annex VI compliance options in 2020 – August 2020
1.2   Objective of the study
      The objective of the study is to compare the CO2 emissions of two ways to comply with the
      MARPOL Annex VI sulphur regulation: using EGCSs in combination with high-sulphur fuels or
      using low-sulphur fuels.

      This comparison will be conducted on a well-to-wake basis, implying that all GHG emissions
      over the lifecycle of both compliance options are considered. In this way, a full-integrated
      comparison of the CO2 emissions of both options has been carried out.

1.3   Scope of the study
      In this study, the following basic principles are applied:
      — As mentioned in Section 1.2, the well-to-wake GHG emissions of using low-sulphur fuels
          and using EGCSs are compared in this study. In this assessment, we will focus on the
          main elements contributing to these GHG emissions. Elements that have a negligible
          impact on the comparison between both compliance options and processes that are the
          same for both options (e.g. the extraction of crude oil or its transport to refineries) is
          excluded from the analyses. This implies that this study is not a formal life cycle
          analysis (LCA). However, as all major elements are covered, the results of this study
          will provide a good indication of the GHG emissions that are caused by both compliance
          options.
      — The comparative analysis of using low-sulphur fuel and using an EGCS is carried out for
          five reference ships:
          • a 100,000 GT cruise ship;
          • a 4,000 TEU container ship;
          • a 18,000 TEU container ship;
          • a 80,000 dwt bulk carrier;
          • a 200,000 dwt oil tanker.
          These five ships provide a good reflection of the main ship types that currently have
          installed scrubbers or which have a large demand for scrubbers. More detailed
          information on these five reference ships can be found in Section 2.3.
      — In this study, we assume that all ships comply with MARPOL Annex VI. In other words,
          the impact of non-compliance on emissions is not assessed.
      — The study will be confined to ships using petroleum-based fuels. In principle, LNG,
          methanol or other low-sulphur fuels can also be used to comply with MARPOL Annex VI.
          However, in practice LNG is only an option for new ships since the costs of retrofitting
          existing ships are prohibitive. Methanol and other alternative fuels are only used by a
          very small number of ships so these are currently not really viable options.

1.4   Outline of the report
      The methodology applied in this study is discussed in detail in Chapter 2. In Chapter 3 all
      results of the study are presented. Finally, the conclusions of the study can be found in
      Chapter 4.

7     190191 - Comparison of CO2 emissions of MARPOL Annex VI compliance options in 2020 – August 2020
2 Methodology
2.1   Introduction
      In this chapter we present the methodology applied in this study to assess the well-to-wake
      GHG emissions of applying low-sulphur fuels and using EGCSs. In Section 2.2 we first briefly
      describe the general approach of the study. The reference scenario applied in the
      assessments is discussed in Section 2.3, while both compliance options are defined in
      Section 2.4. Finally, the specific methodology to assess the GHG emissions of both options
      are discussed in Section 2.5.

2.2   General approach
      To compare the well-to-wake GHG emissions (expressed in CO 2-equivalents, i.e. CO2-eq.) of
      the appliance of low-sulphur fuels and the use of heavy fuel oil (HFO) in combination with a
      EGCS, the additional CO2-eq. emissions of both compliance options compared to the
      reference scenario of using HFO (without any exhaust gas cleaning technology) are
      estimated. This is explained in more detail for both compliance options in Figure 2:
      — The low-sulphur fuel pathway (top) requires desulphurisation of fuels in the refinery.
          The additional CO2 emissions of the production of low-sulphur fuels are estimated.
          We have not been able to find studies into the energy density of low-sulphur fuels.
          The available evidence suggests that the energy density varies between different types
          of fuels and is very similar to the range of energy densities of HFO (CIMAC, 2018).
          Therefore, we do not assume a change in CO2 emissions in the operation phase.
      — The EGCS pathway (bottom) uses the same fuel as the reference scenario. In the
          operation phase, the energy required to operate the EGCS results in additional CO2
          emissions, while the emissions associated with the production and installation of the
          EGCS also are accounted for.

8     190191 - Comparison of CO2 emissions of MARPOL Annex VI compliance options in 2020 – August 2020
Figure 2 – Framework for comparison of environmental impacts
Production phase Operation phase
Refinery: Ship: using
production of low compliant fuel in
sulphur fuel ICE
Refinery:
Well Ship: using HFO
production of HFO
Ship: using HFO in
Refinery:
ICE combined with
production of HFO
an EGCS
Production of EGCS
Reference scenario Compliance option 1: Compliance option 2:
low sulphur fuels using EGCS
The CO2-eq. emissions of transport of fuels or materials are not included in our estimations.
As for the transport of fuels, no difference exist between the reference scenario and both
compliance options. In all scenarios, crude oil have to be transported from the well to the
refinery and from the refinery to the ship. Therefore, these transport emissions will be the
same in all scenarios. There may be a difference in the transport emissions associated to
the production and installation of the EGCSs (material to the production facility, EGCS units
from the production facility to the ship) between the reference scenario and the scenario
considering the use of an EGCS. However, based on IVL (2019) it was concluded that these
emissions are negligible compared to the other CO2-eq. emissions associated to the
production and operation of the EGCSs. Additional CO2-eq. emissions because of possible
refinery expansions to produce compliant fuel for 2020 and additional transport of fuel
products are not taken into account because they cannot be quantified.
The estimation of additional CO2-eq. emissions for both compliance options compared to
the reference scenario is carried out for five different reference ships (see Section 1.3).
For each reference ship the difference in annual emissions is estimated, based on
assumptions made on the annual fuel consumption of these ships. This is discussed in
more detail in Section 2.3.
9 190191 - Comparison of CO2 emissions of MARPOL Annex VI compliance options in 2020 – August 20202.3 Reference scenario’s
In this section, we briefly discuss the main issues with respect to the reference scenario.
This includes among others the reference ships, the type of fuel used by the ships and the
extent to which these ships sail in emission control areas.
2.3.1 Reference ships
The calculations carried out in this study are performed for five different types of reference
ships. These ships are selected because they are known to have installed EGCSs. The key
characteristics such as engine power and total fuel consumption was based on the average
power/fuel consumption of similar ships in 2012, according to IMO (2014). These ships and
their main characteristics are presented in more detail in Table 1 and their sources/
assumptions mentioned hereafter.
Table 1 – Overview reference ships and their technical and design characteristics
Characteristics Cruise ship Small Large Bulk carrier Oil tanker
container ship container ship
Ship size
Gross tonnage, TEU 100,000 GT 4,000 TEU 18,000 TEU 80,000 DWT 200,000 DWT
or DWT:
Type and number of engines/boilers
Type of power Diesel – Electric Diesel Diesel Diesel Diesel
generation (1) propulsion (mechanical) (mechanical) (mechanical) (mechanical)
propulsion propulsion propulsion propulsion
(2)
Main engine type N/A Medium speed Slow speed Slow speed Slow speed
4 stroke engine 2 stroke engine 2 stroke engine 2 stroke engine
No. of main engines N/A 1 2(2) 1 1
(3)
No. of auxiliary 6 3 6(3) 3 3
engines
No. of boilers(4) 2 1 2 2 2
Installed power and engine load
Average installed 76,1 34,6 60,2 9,7 27,2
power (MW) (5)
Average installed N/A 24,7 43,0 8,2 21,4
main engine power
(MW) (7)
Average installed N/A 9,9 17,2 1,5 5,7
auxiliary engine
power (MW) (7)
Average main N/A 33 56 54 47
engine load
(%MCR)(8)
Average aux engine N/A 60 60 60 50
load (%MCR) (5)
Average required 55,5 14,1 34,4 5,4 12,9
power (MW)
Average required 73 41 57 55 48
total engine load
(%)
10 190191 - Comparison of CO2 emissions of MARPOL Annex VI compliance options in 2020 – August 2020Characteristics Cruise ship Small Large Bulk carrier Oil tanker
container ship container ship
Fuel consumption
Average annual 47,200 13,900 25,300 5,400 15,300
main engine fuel
consumption
(tonnes) (8)
Average annual 25,500 3,900 6,100 1,100 3,600
auxiliary engine
fuel consumption
(tonnes) (8)
Average annual 500 600 1,100 300 1,100
boiler fuel
consumption
(tonnes) (8)
Average total 73,200 18,400 32,500 6,800 20,000
annual fuel
consumptions
(tonnes) (8)
SFOC (g/kWh) of 210.8 202,6 179,4 180,1 183,2
main engine at
average load (9)
SFOC (g/kWh) of 226.3 229.0 229.0 229.0 233.7
auxiliary engine at
average load (9)
Scrubbers and pumps (Packed bed technology)
Number of 2 1 2 1 1
(10)
scrubber(s)
Number of pump(s) 4 2 3 2 2
(10)
Scrubbers and pumps (Inline technology)
Number of 5 2 2 1 2
(10)
scrubber(s)
Number of pump(s) 5 2 3 1 2
(10)
Sources: IMO (2014) and CE Delft.
(1) Assumption made by CE Delft based on generic propulsion trend based on the ship size.
(2) Assumption made by CE Delft based on technical expertise and for bulk carrier, propulsion trends from
(The Motorship, 2014) is used for the assumption.
(3) Assumption made by CE Delft based on bulk carrier configuration due to lack of data.
(4) Assumption made by CE Delft based on operational profile/technical expertise.
(5) Data derived from 4th IMO GHG Study 2018.
(6) Data derived from Clarkson. Container ships selected which are built between 2015 and 2020 and which has
corresponding ship size as the reference container ships.
(7) Data derived from the main engine to auxiliary engine power ratio which is given in the IMO 3rd GHG study
2014.
(8) Data derived from IMO 3rd GHG study 2014 (IMO, 2014) and a range has been provided that takes into
consideration all the operation modes (at berth, manoeuvring, anchorage and at sea).
(9) SFOC has been calculated based using the Eq.(3) of IMO 3rd GHG study.
(10) Average data provided by Alfa Laval, Wärtsilä and Yara Marine.
11 190191 - Comparison of CO2 emissions of MARPOL Annex VI compliance options in 2020 – August 20202.3.2 Reference maritime fuels
Prior to the introduction of the global sulphur cap of 0.50% m/m, the mean sulphur content
of heavy fuel oil was: 2.6% m/m, with over 80% of the samples between 2.0 to 3.5% (MEPC,
2018).
For this study, we have chosen two reference maritime fuels that reflect choices made by
shipping companies that install scrubbers:
— a fuel with a sulphur content of 2.2% m/m; and
— a fuel with a sulphur content of 3.5% m/m.
2.3.3 Emission control areas
Emission Control Areas (ECAs), or sulphur Emission Control Areas (SECAs), are sea areas in
which stricter requirements with respect to air pollutant emissions are imposed on vessels.
Areas covered by such requirements are, for example, the Baltic Sea, the North Sea, the
North American ECA (including most of the US and Canadian coast) and the US Caribbean
ECA. In the MARPOL regulations, a distinction is made between the sulphur limits inside and
outside SECAs/ECAs. The current SECA/ECA limit is 0.1% m/m sulphur in the fuel. The global
limit was up to and including 2019 equal to 3.5% m/m, but is reduced to 0.5% m/m since
the 1st of January 2020.
The reference ships considered in this study sail both within and outside SECAs/ECAs.
To take this into account in estimating the CO2-eq. emissions of both compliance options,
we have made a distinction in our calculations between the fuel consumed inside and
outside these areas. Heavy fuel oil with a sulphur content equal to 3.5% m/m and heavy
fuel oil with a sulphur content equal to 2.2% are considered to be representative for the
maritime fuel market. Therefore, for the fuel consumed inside the SECA/ECA, the CO2-eq.
emissions of reducing the sulphur emissions from 3.5% m/m and 2.2% m/m to 0.1% m/m is
estimated for both compliance options, while for fuel consumed outside the SECA/ECA, this
approach has been replicated for a reduction of sulphur emission from 3.5% m/m and 2.2%
m/m to 0.5% m/m.
The average annual fuel consumption within and outside SECAs/ECAs is shown for the
various reference ships in Table 2.
Table 2 – Annual fuel consumption (%) within and outside SECAs/ECAs
Cruise ship Small Large Bulk carrier Oil tanker
container ship container ship
Annual fuel consumption within 15 10 5 5 5
SECAs/ECAs (%)
Annual fuel consumption outside 85 90 95 95 95
SECAs/ECAs (%)
Source: Assumptions CE Delft.
2.4 Definition compliance routes
This report shows the differences in CO2-eq. emissions of both compliance options: the use
of low-sulphur fuels and the use of high-sulphur fuels in combination with an EGCS.
Section 2.4.1 shows the definition of the first option and Section 2.4.2 shows the definition
of the second option.
12 190191 - Comparison of CO2 emissions of MARPOL Annex VI compliance options in 2020 – August 20202.4.1 Low-sulphur fuels
Ships using compliant fuels use fuels with a sulphur content of maximally 0.1% m/m in
(S)ECAs and maximally 0.5% m/m outside (S)ECAs.
In general, various types of refineries exist with different footprints per unit of operation.
For a first order estimate, we use a generic refinery model of Prelim, Versions 1.2 and 1.3
(Abella, et al., 2017-2019). Footprints based on specific other refinery types require process
modelling of the hydrodesulphurisation unit or HDS of that specific refinery. Relevant for
this study, the origin of the hydrogen feed of an HDS differs per refinery type. In the
Prelim 2 model we assume hydrogen production by steam methane reforming (SMR). For the
footprint of hydrogen production the CO2-eq. value of the Prelim model was used plus the
EU-ETS value for reference. More variation exists, while in practice an HDS will receive a
blend of feeds and the products is again blended to meet various fuel specifications.
The actual rerouting of flows for obtaining reduced sulphur HFO or MGO is unknown.
However, the desulphurisation reaction requires constant stoichiometric amounts of
hydrogen per unit of sulphur removed. Additionally, the same amount of hydrogen is
required to convert the removed sulphur into hydrogen sulphide, so it can be further
processed in a Claus unit of the refinery.
The HDS also removes nitrogen, which requires very little extra feed of hydrogen.
However, much larger amounts of hydrogen are fed to the HDS for processing the fuel to its
hydrogen specification and for carbon displacement. So the desulphurisation is only a small
part of the hydrogen footprint of an HDS. The working point of 0.14% initial sulphur in the
Prelim model, was normalised to a value per 1 w% sulphur removal, please refer to Annex A
for a schematic overview of input and output flows. Overall, a 5% hydrogen loss was
accounted for in the model.
Other footprints of the HDS comprise natural gas feed, power and steam. These are about
constant for a specific processing volume and independent of the degree of sulphur
removal. We assume power to be produced on site by natural gas fed CHP and steam by
natural gas fed steam boilers. Greenhouse gas emissions from these operations other than
CO2 were also included in the CO2-eq. value i.e. methane slip of natural gas in the CHP and
originated from the Prelim model.
These latter footprints have been allocated over the HDS linear to the level of hydrogen
feed, resulting in a minor 1.4% contribution for the desulphurisation.
Finally, a correction was applied to convert the footprint from the input feed to a value per
ton of diesel.
2.4.2 High-sulphur fuels in combination with EGCSs
Ships using EGCSs to comply with the sulphur regulations commonly use fuels with a sulphur
content of 3.5% m/m or 2.2% m/m.
In principle, an exhaust gas cleaning system (EGCS) or a scrubber is an equipment that
removes sulphur oxides from the exhaust gas of ship’s engine(s) and boilers. By using this
kind of equipment, ships can use fuels with a sulphur content above the allowed limit.
During fuel combustion, the sulphur is oxidised to sulphur dioxide (SO2). A small amount of
SO2 will be further oxidised to sulphur trioxide (SO3) (IVL, 2019). The total amount of SO2
and SO3 is also called SOx.
13 190191 - Comparison of CO2 emissions of MARPOL Annex VI compliance options in 2020 – August 2020The exhaust gas stream (SOx) will be mixed with seawater or fresh water in the EGCS.
The SOx dissolve in the water (along with other components of the exhaust gas). With the
use of seawater, the natural chemical composition of the seawater is being used for the
removal process. The ability to neutralise SOx with seawater depends on the alkalinity of
the seawater. While with respect to the use of freshwater, an alkaline chemical such as
caustic soda (NaOH) is used for neutralisation and scrubbing.
Seawater scrubbers are known as open loop systems since the seawater that is being used
for scrubbing is discharged back into the sea (with or without a washwater treatment
system). Hence the washwater is not recirculated. Since the washwater is being discharged
back into the sea, the emissions from the exhaust gases and especially SO2 have been
transferred from the gas phase into water phase, causing no sludge removal exists in the
system.
Fresh water scrubbers, also called closed-loop scrubbers, recirculate the water in the
exhaust tower after being cooled with the help of a cooling pump and cleaned with the help
of a process tank. Closed loop systems are able to operate at no discharge mode for a
limited period of time thus being more suitable for ships whose operational profile includes
sailing at sensitive areas such as Baltic areas or to ports where the discharge of washwater
in the sea is banned.
According to (Clarksons research, 2019a), a total of 3,371 scrubbers have been installed
until March 2020. Most of these are open loop systems. Open loop systems are more
attractive within the retrofit market segment since they require less space and
modifications onboard. With respect to retrofits and new builds installations, most of the
scrubbers (around 60% or 2,033) are installed as a retrofit on existing vessels (Clarksons
research, 2019a). This number also includes retrofits that are still pending to be installed.
With the above data, which indicates that open loop systems currently are the most
commonly installed EGCS, we have considered an ‘Open loop’ EGCS with a multi stream
configuration that have been retrofitted on all the five reference ship types (See Table 1)
as the preferred compliance route for sulphur regulations. A multi stream configuration
(multiple main and auxiliary engines) means that multiple exhaust gas streams are
connected and diverted into a single scrubber tower. In the context of this study, this
means that multiple exhaust gas sources of both main and auxiliary engines are sent to a
single scrubber tower for the scrubbing and neutralisation process.
Open loop system can be segregated based on their type of technology used for
scrubbing/neutralising:
1. Packed bed or venturi technology.
2. Inline technology.
Packed bed or venturi technology: This technology removes sulphur by inertial or
diffusional impaction, reaction with a sorbent or reagent slurry, or absorption into liquid
solvent (EPA, 2015). This removal process is executed in a chamber which contains layers of
variously shaped-packing material such as Raschig rings, spiral rings or Berl saddles that
provides a large surface area for liquid-particle contact to happen. The packing is held in
place by wire mesh retainers and supported by a plate near the bottom of the scrubber.
The scrubbing liquid is evenly introduced above the packing to maximise the efficiency.
The liquid coats the packing and establishes a thin film. The nominal water flow is
approximately 45 m3/MWh.
14 190191 - Comparison of CO2 emissions of MARPOL Annex VI compliance options in 2020 – August 2020Inline technology: This technology is a longer and slimmer version compared to the
traditional design of open loop scrubber. The reduction in size is enabled by having an open
spray solution where the scrubbing water is being divided into six spray layers to ensure a
good mix between gas and water. A water trap situated in the scrubber inlet prevents
scrubbing water from entering the engine (Wärtsilä, 2017). An inline system has a smaller
spatial footprint than a packed bed system but it requires a higher water flow. The system
has no moving parts inside.
Both packed bed and inline are the well-established and commonly applied open loop
technologies currently available in the market. To make sure we take into account all the
open loop systems for our analysis, this study considers both packed bed and inline
technology.
Table 3 – EGCS and their associated technical characteristics
Factors Technical - Assumptions and Data points
EGCS type Open loop.
EGCS technology Packed bed or inline scrubber.
EGCS configuration Multi stream (Multiple engines connected to a single scrubber).
EGCS installation Open loop without washwater treatment system
(A conservative case).
EGCS size Engine sizes of the reference ships (Table 1) are derived from the (IMO,
2014). Based on the engine size (MW) corresponding scrubber size will be
calculated by the manufacturers and that input data will be used for our
calculations.
EGCS lifetime 25 years
EGCS capacity For this study, we will assume two capacities of scrubbing, one for 3.5% S and
one for 2.2% S as mentioned above. The below represents the four scenarios
that will be taken into account for calculations.
Outside ECA’s: 3.5% S 0.5% S m/m & 2.2% S 0.5% S m/m
Inside ECA’s: 3.5% S 0.1% S m/m & 2.2% S 0.1% S m/m
EGCS installation type As per (Clarksons, 2019b) & (EGSCA, 2018), the current fleet comprises more
ships that are retrofitted with scrubbers than new buildings with scrubbers.
Therefore, and because retrofits are likely to have a larger environmental
footprint than new builds due to the energy consumption during the
installation phase, we will assume that scrubbers are retrofitted to the below
mentioned five reference ship types.
EGCS operating modes It is assumed that scrubbers operate in all the following modes especially
after 2020:
At berth (Less than 1 knot)
Anchored (1 knot – 3 knots)
Maneuvering (Greater than 3 knots and less than 20% MCR)
Slow-steaming (Between 20% MCR and 65% MCR)
Normal cruising (Above 65% MCR)
For simplicity reasons, we have considered the average load of each
reference ship type based on (IMO, 2014) which takes into consideration all
the above operating modes. We assume that the entire power for operating
the scrubber is always provided by the auxiliary engines/generator sets.
Aux engine(s)/boiler integration: It is assumed that the main engine, the auxiliary engines and the boiler is
integrated in the EGCS.
15 190191 - Comparison of CO2 emissions of MARPOL Annex VI compliance options in 2020 – August 2020Factors Technical - Assumptions and Data points
Type of power cycle: The power cycle of each reference ship type has been assumed based on the
CE Delft expertise and propulsion trends for a particular ship category based
on the size. In general, a 4 stroke engine has higher exhaust temperatures
than a 2 stroke engine, which means that for the same volumetric flow of
exhaust, more water is required for cooling and saturation. While a 2 stroke
engine has higher volumetric flow of exhaust than a 4 stroke engine, which
means that for the same power of engines volumetric flow of exhaust more
power of scrubber is required (Panasiuk, et al., 2018).
Feed or washwater pump(s) + The feed or the washwater pumps has been segregated based on the scrubber
electromotor(s): technology.
Packed bed: A feed water pump has a flow rate of 400 m3/h.
Inline: A feed water pump has a flow rate of 720 m3/h.
Note: the weight of both the pump and the electromotor has been taken into
account in the calculations.
Seawater alkalinity: When ships operate in low alkaline environments such as the Baltic sea, great lakes and
Mississippi, the need for additional water required for the scrubber process will increase compared to operation
in conventional sea areas. This scenario will increase the feed water pump flow rate, causing an increase in
energy demand and consequently an increase in the discharge of washwater. This ‘operational scenario’ is not
included in the calculations.
2.5 Methodology to estimate CO2 impact
Section 2.5.1 describes the methodology to estimate the CO2 impact of low-sulphur fuels.
Section 2.5.2 describes the methodology to estimate the CO2 impact of high-sulphur fuels in
combination with the use of EGCSs.
2.5.1 Methodology to estimate the CO2 impact of low-sulphur fuels
In general, refineries differ in their set-up. However, we use a conventional hydro-refinery
set-up with diesel hydro-treatment as defined in the Prelim model, see the process flow
diagram in the Annex A.
To produce the alternative low-sulphur marine fuels different pathways and blending
strategies may be applied. The current flow of vacuum residue for today marine HFO fuels
is to be replaced by a compliant low-sulphur product. In practice, this will be achieved by
rerouting and blending depending on the specific refinery and crude oil assays.
With respect to the scope of this study the impact of additional desulphurisation for two
generic cases are considered to meet the final specifications of the compliant fuel:
1. Feeding 100% HFO to a reside hydro-cracker resulting in different products. Followed by
additional hydro-treatment of the diesel fraction in an HDS.
2. Hydro-treatment of straight-run diesel in an HDS.
16 190191 - Comparison of CO2 emissions of MARPOL Annex VI compliance options in 2020 – August 2020Case 1
The first case assumes that HFO currently brought to the market is now processed in a
residue furnace and residue hydro-cracker. Impact is derived from a 100% HFO feed.
Apart from diesel and gasoil, the hydro-cracker gives multiple other products like naphtha
and residue HFO. In the Prelim model, the hydro-cracker removes 40% of the sulphur, which
is not sufficient to produce compliant fuels. Therefore, further processing of diesel product
is required in a diesel HDS. Please refer to Figure 3.
Figure 3 - Process to remove sulphur from residue HFO in hydro-cracker and diesel hydro-treater
In general, for these process routes to remove additional sulphur, nitrogen, unsaturation
and aromatics consists following process steps are considered:
— Hydrogen production; as input for the hydro-treatment additional hydrogen is required.
The most common method to produce hydrogen is by steam methane reforming (SMR).
In this method high-temperature steam (700 to 1,000°C) is used to produce hydrogen
from a methane source, such as natural gas (NG). Under pressure, the methane reacts
with steam in the presence of a catalyst to produce hydrogen, carbon monoxide and
carbon dioxide. In a next step, the carbon monoxide and steam are reacted using a
catalyst to produce carbon dioxide and more hydrogen. In a final step, carbon dioxide
and other impurities are removed from the gas stream, leaving essentially pure
hydrogen.
— Residue hydro-cracker furnace; vacuum residue/HFO with about 3.5 m% sulphur
obtained from a crude assay matching this sulphur content (Arab Light-Stratiev, 3.35 m%
S) is fed to a residue furnace for thermal pre-treatment. Herein natural gas is
consumed.
In order to start with 3.5 and 2.2 m% of sulphur, the impact is scaled linearly based on
the actual sulphur reduction percentage.
— Residue hydro-cracking; under hydrogen feed the vacuum residue is cracked to a mix of
lighter components like cracking gas, naphtha, diesel, gas oil plus a residue/HFO.
17 190191 - Comparison of CO2 emissions of MARPOL Annex VI compliance options in 2020 – August 2020— Hydro-treatment; the diesel fraction is fed to the diesel hydro-treater. Here in
unwanted impurities/inorganic components (including sulphur, nitrogen, unsaturation
and aromatics) are removed by processing at high temperature and pressure in the
presence of hydrogen and a catalyst. In this process, hydrogen reacts with the sulphur in
the fuel to form gaseous hydrogen sulphide, which is then separated from the fuel.
Also for naphthalene and aromatics hydro-treating is considered the most common
method for removal. In an industrial refinery, hydro-treatment takes place in a fixed
bed reactor at elevated temperatures ranging from 300 to 400°C and elevated pressures
ranging from 30 to 100 kPa, in the presence of a catalyst consisting of an alumina base
impregnated with cobalt and molybdenum.
— Claus process; the product gas rich in hydrogen sulphide resulting from the hydro-
treatment process is further processed in the Claus plant. The Claus process consists of
a thermal stage (combustion chamber, waste heat boiler) and some catalytic reaction
stages (reheater, reactor and condenser). The main products of this process are
elemental sulphur and fuel gas. This fuel gas is used elsewhere in the refinery and
replaces the impact of the consumption of natural gas.
— Utilities steam and power. Steam is considered to be produced by natural gas and
refinery gas. Power is assumed to be produced by natural gas fed power plants.
As indicated in Figure 3, specific inputs (e.g. natural gas, electricity) and intermediate
products (H2) are required in each of these process steps. The use of these inputs and
intermediate products result in additional production footprint. The amounts of natural gas,
electricity, steam and hydrogen that are required in each step of sulphur, aromatics, and
naphthalene removal are taken from the detailed refinery model Prelim Versions 1.2 and
1.3. The following assumptions are used in this respect:
— We consider the marginal increase of primary resources for additional hydro-treatment
(compared to the conventional sulphur level in HFO) in an existing refinery assuming
linearity versus removal.
— As indicated in Section 1.3, we assume that no new refinery capacity will be developed
and hence no additional process steps are included in the assessment. This also implies
that the hydrogen used is coming from existing Steam Methane Reformers (SMR).
— Cost increase exclusively by extra primary energy sources: natural gas and grid power
— Steam of SMR is used elsewhere in the refinery and equivalent distracted from the
natural gas consumption.
— Hydrogen consumption for H2S to enable processing in Claus is included in the
assessment.
— Claus process with its input and output energy streams is included.
— Of The Claus process produces hydrogen as a by-product which is used elsewhere in the
refinery. It replaces natural gas and thus leads to lower CO2 emissions.
— Heat, steam and power consumption of hydro-treatment is allocated by the amount of
hydrogen consumed per component (sulphur, Claus H 2S and aromatics).
— The footprint effect of the yield and sale of additional elemental sulphur production is
neglected.
Case 2
In this case it is assumed that blending with diesel distillates is applied in reaching sulphur
compliance for marine fuels. Therefore, the impact is exclusively determined by additional
hydro-processing in the HDS including allocated utilities required to produce ultralow-
18 190191 - Comparison of CO2 emissions of MARPOL Annex VI compliance options in 2020 – August 2020sulphur feedstock for marine fuel blends with compliant sulphur levels. An overview of the
diesel hydro-treatment processes involved in the Prelim model used are shown in Figure 4.
Figure 4 - Process to remove sulphur from straight run diesel
Based on these assumptions, the amounts of inputs and intermediate products have been
estimated by using the Prelim 1.2 and 1.3 refinery model.
2.5.2 Methodology to estimate the CO2 impact when using EGCSs
When effective as an alternative compliance mechanism to the MARPOL Annex VI sulphur
requirements, an EGCS achieves the goal of reaching a maximum limit of 0.5% S m/m
outside ECA’s and reaching a maximum limit of 0.1% S m/m inside ECA’s. Heavy fuel oil with
a sulphur content equal to 3.5% m/m and heavy fuel oil with a sulphur content equal to
2.2% are considered to be representative for the maritime fuel market. Therefore, for the
fuel consumed inside the SECA/ECA, the CO2-eq. emissions of reducing the sulphur
emissions from 3.5% m/m and 2.2% m/m to 0.1% m/m is estimated for both compliance
options, while for fuel consumed outside the SECA/ECA, this approach has been replicated
for a reduction of sulphur emission from 3.5% m/m and 2.2% m/m to 0.5% m/m. This is
shown in Table 4.
Table 4 - Sulphur reduction scenario’s
Sulphur reduction scenario’s
Inside ECA 3.5 – 0.1 % S m/m
2.2 – 0.1 % S m/m
Outside ECA 3.5 – 0.5 % S m/m
2.2 – 0.5 % S m/m
Figure 5 shows all the elements included in the calculation of the CO2 emissions during the
lifetime of an EGCS. The diagram also provides insight in the elements for which data was
available and for which data was not available. As earlier discussed, the transportation is
19 190191 - Comparison of CO2 emissions of MARPOL Annex VI compliance options in 2020 – August 2020not included in the calculations for both compliance options and is therefore not included in
the diagram.
Figure 5 – Calculation model for the entire lifecycle for EGCS compliance route
Production
Producti on of Wa s te materials
s crubber tower Producti on of (Not i ncluded since the steel
Extra ction &
(Onl y the s crubber water da ta which is used has a
production of
cons umed pump a nd ma rket mix of 56,7% primary
ra w ma terial
el ectricity is el ectromotor s teel a nd 43,3% s econdary
i ncl uded) s teel)
Installation
Ins tallation or
Ins tallation of
modi fication of
Ins tallation of feed water
s ea chest &
s crubber tower pump a nd
overboard
el ectromotor
di s charge
Operation
Opera tion at
the 4 Sul phur
reduction
s cenario’s
Incl uded i n the calculations Not i ncl uded in the ca lculations
Production process
The initial phase is the production phase, where the focus is on all the raw materials
acquired and the energy consumed to produce a fully functioning EGCS for the five different
reference ship types. An EGCS, both packed bed and inline technology, mainly consists of
the scrubber tower, pump(s) with the electric motor(s) to supply the required water and
piping, fitting, valves and sample lines, which are necessary to integrate the EGCS unit
(scrubber tower and pumps) with multiple exhaust streams. The size of the scrubber tower
and the amount of required pumps are directly dependant on the fuel quality (content
sulphur), engine sizes and the corresponding amount of exhaust streams, which need to
scrubbed.
20 190191 - Comparison of CO2 emissions of MARPOL Annex VI compliance options in 2020 – August 2020CO2 emissions are caused during the extraction of the raw materials for the production and
the production of the scrubber tower, the feed or washwater pump, the necessary piping to
feed the scrubber with seawater from the sea chest and to discharge the washwater
overboard. All the above mentioned elements covers the scope of the production phase,
which are needed to calculate the (kg) CO2-eq. footprint. An overview is shown in Table 5.
Table 5 – Different elements of EGCS during the production phase
Phases Data availability
Raw materials for the production of scrubber tower Yes, included in the calculations
Raw materials for the production of scrubber pump Yes, included in the calculations
and electromotor
Raw materials for the production of the sealing fan No, assumed that this is negligible
Raw materials for the production of piping, valves, No, assumed that this is negligible
sample lines and fitting
Energy needed to manufacture the scrubber tower Yes, but only electricity included in the calculations.
from the extracted raw materials Data about required heat, steam or gas not possible to
estimate.
Energy needed to manufacture the scrubber pump and No, not included in the calculations
electromotors
EGCSs are exposed to seawater, exhaust gases and a high concentration of chlorine. For this
reason, EGCSs are made from materials, which are high resistant to corrosion. Table 6
shows an overview of the typical materials used for the production of an EGCS and the
associated equipment.
Table 6 – Raw materials required for the production of an EGCS and associated equipment’s
Open loop Scrubber tower Feed or washwater Piping Valves/Sample lines and
technology pump fitting
Packed bed 254SMO (SS alloy), Pump: GRE, GRP, GRVE, Negligible
technology Carbon steel, NiAlbz*, Stainless Carbon steel,
Stainless steel with steel Super duplex
duplex materials steel
Electromotor:
Aluminium, Stainless
steel
Inline technology Alloy 59 (Nickel Housing: GRE, GRP, GRVE, Negligible
chromium- Bronze/NiAlBz*/ Carbon steel,
molybdenum) Super duplex Super duplex
6 MO grades (Stainless steel
steel alloy), Duplex, Impeller: Bronze/
254SMO Superduple
Electromotor: 90%
Aluminium
10% Ss
*NiAlBr = Nickel aluminium and bronze alloy.
21 190191 - Comparison of CO2 emissions of MARPOL Annex VI compliance options in 2020 – August 2020As shown in Table 6, the scrubber tower for packed bed technology is predominated by
steel and its variants. The scrubber tower for inline technology, on the other hand, is
dominated by both alloys of nickel chromium molybdenum and stainless steel variants.
Since no distinction is made in the data of alloy which is received from Ecoinvent
(a database used by LCA experts to derive environmental footprint data for various products
and activities), the data for world steel which possess a market mix of primary steel (56.7%)
and secondary/recycled steel (43.3%) is used. The use of this market mix does not take into
account the eventual benefits at end of life because of the extra recycled steel in the
market.
The composition of the pump(s) and electromotor(s) for both packed bed and inline
technology slightly differ, mainly due to the fact that the pump used for inline technology
contains a bronze impeller.
There is a lack of information regarding the amount and size of the materials, which are
necessary for the production of the piping, valves, sample lines and fittings of an EGCS. In
addition, pipe lengths are case specific, depending on factors such as ship size, engine size
and flow rate (m3/h). Furthermore, most manufactures of EGCSs are not involved in the
installation process on board. This does not make it possible to make a realistic assumption.
It can be assumed that the required materials for piping, valves, sample lines and fittings
are almost equal for both packed bed and inline technology. Due to lack of reliable
information is has been assumed that the required materials for piping, valves, sample lines
and fittings are negligible compared to the production of the scrubber tower(s) and the
pump(s). This is not included in the calculations and the comparison with the ‘low-sulphur
fuel’ compliance option.
Energy consumption
Electricity necessary for the production of the scrubber tower is taking into account, but
the electricity necessary for the production of the pump(s) and electromotor(s) is not taken
into account since this is unknown. It is expected that corresponding CO2-eq. is negligible in
the overall picture. More research can be done in this area in a potential next in-depth
investigation.
Calculations
The CO2 footprint of extraction and production of scrubber tower and feed or washwater
pump (including electromotor) is used to derive the kg CO2-eq. per year, by dividing this
value by the life time of the scrubber (25 years) (IVL, 2019). To provide the reader an
example, Table 7 shows for a large container ship (18,000 TEU) the kg CO2-eq. for these two
important production elements and the total production impact.
Table 7 – kg CO2-eq./year for the production process of an EGCS for a large container ship
Open loop technology kg CO2-eq./year for kg CO2-eq./year for the Total kg CO2-eq./year for
the production of production of feed or the production process
scrubber tower(s) washwater pump(s) &
electromotor(s)
Packed bed 5,736.4 2,028.9 7,765.3
Inline 4,371.3 2,727.6 7,098.9
22 190191 - Comparison of CO2 emissions of MARPOL Annex VI compliance options in 2020 – August 2020Installation process
The second element within the life cycle of an EGCS is the installation process.
This includes the following steps:
1. Modification of the exhaust funnel.
2. Installation of the scrubber tower(s) (Inline technology has only one tower while packed
bed has the venturi tower as well).
3. Installation of feed or washwater pump(s) and electromotor.
4. Installation of the sealing fan.
5. Installation or modification of the sea chest (adjustment to the water intake demand of
the EGCS).
6. Installation or modification of the overboard discharge.
The steps are based on the similar ideology that all the five reference ship types are fitted
with an open loop EGCS without a discharge cleaning system. The installation of a scrubber
takes approximately 16 to 20 days. Installation of the scrubber tower and modification of
the sea chest are the activities, which have to be carried out while the ship is in dry dock.
It is assumed that the rest of the installation work does not require the ship to be in dry
dock. Due to a lack of information and complexity in building scenarios such as geographical
location of the installation and the electricity mix in the concerned country, there is
decided not to include this phase in the CO2 footprint calculations.
It is assumed that the five reference ships are existing vessels which will be retrofitted,
which means that a certain amount of CO2 is being emitted to the installation phase of
EGCSs. However, in 25 years it is expected that the CO2 emissions corresponding to the
installation process will become negligible since the installation of the vessel is included in
the new building process.
Operation
The power (and thus fuel) needed to operate the EGCS is commonly referred to as the fuel
penalty. This fuel penalty is usually predominated by the power required for the pump(s).
The pump(s) ensure a safe operation of the scrubber such as maintaining the spray patterns
and eventually maintaining the efficiency of the scrubber.
The power required by the pumps depends on the engine load, the sulphur content of the
fuel oil and on the applicable sulphur limit. Figure 6 shows the relation for the cruise
reference ship.
23 190191 - Comparison of CO2 emissions of MARPOL Annex VI compliance options in 2020 – August 2020Figure 6 - Relation between engine load and pump power for various fuel contents and sulphur limits
700,0
EGCS pump power (kW)
600,0
500,0
400,0
300,0
200,0
100,0
0,0
20% 30% 40% 50% 60% 70% 80% 90%
engine load (%MCR)
3.5% outside ECA 3.5% in ECA
2.2% outside ECA 2.2% in ECA
Besides the fuel penalty, one of the other main concerns among ship owners is the
increase in backpressure. An increase in back pressure can increase the engine load, which
consequently increase the SFOC of the engine. According to the manufacturers of EGCSs, in
general the increase of SFOC due to back pressure is held below 1%. This correlates with the
information from marine engine manufacturers who indicate a maximum allowable back
pressure threshold for an EGCS. Furthermore, engine manufacturers evaluate the scrubber
impact on engine performance/load and recommend possible counter measures to ensure
safe and reliable operation of the engine in combination with the EGCS, which further
reduce any possibility of increase in SFOC. Since the fuel penalty caused due to back
pressure is below 1%, we assume that this is negligible and is therefore not been included in
the operational CO2 footprint calculations.
Calculations
The average installed power and average engine load for both main and auxiliary engines
are derived from the 3rd IMO GHG Study 2014 (IMO, 2014). The required pump power at the
average required total engine load is based on input from the EGCS manufactures who
based the values on the installed power and average load. The required pump power is
multiplied by the SFOC (g/kWh) of the auxiliary engines and divided by the total annual fuel
consumption to calculate the additional required fuel to scrub one ton of fuel.
Subsequently, the operational CO2 footprint per reference ship per year is calculated with
the use of the CO2 emission factor of HFO (3,114 kg CO2/ton of HFO) (IMO, 2014) and the
total annual fuel consumption. This methodology is used to calculate the CO2 footprint of
each reference ship per year for all the four ‘sulphur reduction scenarios’ mentioned in
Table 4.
The calculated CO2 footprint per year of the reference ships based on the above mentioned
methodology does not take into account the operational profile of the ship in terms of
sailing inside or outside ECAs. To include this and place the results into perspective, the
amount of fuel (%) necessary inside ECAs (Table 2) is multiplied by the CO2 footprint caused
by scrubbing the total annual fuel consumption from respectively 3.5% S or 2.2% S to
24 190191 - Comparison of CO2 emissions of MARPOL Annex VI compliance options in 2020 – August 20200.1% S m/m. The amount of fuel (%) necessary outside ECAs is multiplied by the CO2
footprint caused by scrubbing the total annual fuel consumption from respectively 3.5% S
or 2.2% S to 0.5% S m/m.
Ships using EGCS wash the exhaust gases in order to meet the sulphur regulations which
restrict the release of SO2 emissions. The resulting acid washwater, which contains SO2 is
released into the sea. This leads to the acidification of the water. Researchers have looked
into the effect of the release of acid washwater by ships using scrubbers in the North Sea
and compared the results with the impact of CO2 emissions on ocean acidification.
This study, conducted by European commission (EU Science Hub , 2016), concluded that in
overall terms CO2 emissions are the leading cause of ocean acidification in the North sea.
CO2 emissions from the ocean
Release of acidic washwater can cause CO2 emissions, which can in turn cause the
acidification of seawater. The chemical reaction of the process is:
HCO3- + H+ -> H2O + CO2(g)
Dutch institute NIOZ published about ocean acidification. The amount of carbon present is
ocean waters is considerably large, see Figure 7 of carbon presence and distribution:
Figure 7 - Carbon presence and distribution in ocean waters.
Source: NIOZ Ocean Acification
25 190191 - Comparison of CO2 emissions of MARPOL Annex VI compliance options in 2020 – August 2020For inorganic carbon the equilibrium is controlled by the so called ‘carbonate pump’ (left)
and ‘biological pump’ (right) as described in Figure 8:
Figure 8 – Carbon equilibrium by carbonate pump in ocean waters
Source: NIOZ Ocean Acification
From this it can be concluded that biological uptake of CO 2 by calcification and algae can
be neglected compared and most carbon is released to the atmosphere.
The inorganic equilibrium at specific pH is depicted in Figure 9.
Figure 9 - The inorganic carbon equilibrium and pH
Source: NIOZ Ocean Acification
26 190191 - Comparison of CO2 emissions of MARPOL Annex VI compliance options in 2020 – August 2020Under current seawater pH conditions seawater is supersaturated with respect to CaCO 3 in
most surface waters. Calcium concentration varies little in the open ocean, but the ocean
acidification decreases CO32- concentration and thereby degree of supersaturation.
In the reaction of SOx with water the strong sulphuric acid is produced. Per mole SO2 or SO3
this results in 2 moles H3O+:
SO2 + H2O ---> 2 H3O+ + SO32-
SO3 + H2O ---> 2 H3O+ + SO42-
When taking into account Figure 9 and the supersaturation of carbonate in most surface
waters in ‘worst case’ we assume that discharge can locally decrease supersaturation, shift
the pH at the point of discharge to a significantly lower value. This releases two moles by
reaction of all H3O+ with bicarbonate by:
HCO3- + H3O+ H2CO3 + H2O
and
H2CO3 H2O + CO2 (g)
Because of the large quantities of sulphur removed, the CO 2 emissions from the seawater are
significant.
27 190191 - Comparison of CO2 emissions of MARPOL Annex VI compliance options in 2020 – August 2020You can also read