Comparison of Energy Contributions and Workloads in Male and Female Badminton Players During Games Versus Repetitive Practices
←
→
Page content transcription
If your browser does not render page correctly, please read the page content below
ORIGINAL RESEARCH
                                                                                                                                                   published: 24 June 2021
                                                                                                                                          doi: 10.3389/fphys.2021.640199

                                                Comparison of Energy Contributions
                                                and Workloads in Male and Female
                                                Badminton Players During Games
                                                Versus Repetitive Practices
                                                Yue Fu 1 , Yu Liu 2 , Xiaoping Chen 1,3* , Yongming Li 4 , Bo Li 4 , Xinxin Wang 4 , Yang Shu 3 and
                                                Lei Shang 5
                                                1
                                                  School of Kinesiology, Shanghai University of Sport, Shanghai, China, 2 Key Laboratory of Exercise and Health Sciences of
                                                Ministry of Education, Shanghai University of Sport, Shanghai, China, 3 China Institute of Sport Science, Beijing, China,
                                                4
                                                  School of Physical Education and Sport Training, Shanghai University of Sport, Shanghai, China, 5 School of Competitive
                                                Sport, Beijing Sport University, Beijing, China

                                                Purpose: The aim of this study was to compare the energy contributions and workloads
                                                in men and women during badminton matches versus frequently used multi-ball
                                                smash practices.

                           Edited by:
                                                Methods: Fourteen badminton players performed one badminton singles game and
                     Nicolas Babault,           one session of smashing practice on separate days. The energy contributions were
                Université Bourgogne
                                                examined in terms of each individual’s three energy systems and substrate oxidation,
              Franche-Comté, France
                                                while workloads included heart rate (HR), Player Load (PL), accelerations, decelerations,
                        Reviewed by:
                        Cristina Cortis,        changes of direction, and jumps.
            University of Cassino, Italy
               Daniel Rojas-Valverde,           Results: (1) During games, male players exhibited higher adenosine triphosphate–
     National University of Costa Rica,         phosphocreatine system contribution (EPCr , kJ) (p = 0.008) and average rate of
                            Costa Rica
                                                carbohydrate oxidation (RCHO , g/min) (p = 0.044) than female players, while female
                  *Correspondence:
                                                players showed greater absolute PL (p = 0.029) and more accelerations (p = 0.005) than
                       Xiaoping Chen
                chenxiaoping@ciss.cn            male players. Furthermore, players who lost performed higher relative PL (p = 0.017)
                                                than those who won. (2) Higher energy system contributions, including EPCr (kJ)
                   Specialty section:
         This article was submitted to
                                                (p = 0.028), EHLa (kJ) (p = 0.024), EAer (kJ) (p = 0.012), ETot (kJ) (p = 0.007), and RCHO
                   Exercise Physiology,         (g/min) (p = 0.0002), were seen in male players during repetitive spike practices. Male
               a section of the journal         players also made greater number of jumps (p = 0.0002). (3) Players exhibited higher
               Frontiers in Physiology
                                                aerobic energy contribution (p < 0.001), mean HR (p = 0.002), and HRmax (p = 0.029)
       Received: 16 December 2020
           Accepted: 20 April 2021              during games, while exhibiting greater anaerobic energy contribution (p < 0.001) and
          Published: 24 June 2021               relative PL (p = 0.001) during repetitive practices.
                             Citation:
        Fu Y, Liu Y, Chen X, Li Y, Li B,
                                                Conclusion: The similarities between male and female badminton players in
  Wang X, Shu Y and Shang L (2021)              proportional use of the three energy systems during games and repetitive spike training
 Comparison of Energy Contributions
                                                indicate similar relative energy demands for both genders. However, considering the
  and Workloads in Male and Female
   Badminton Players During Games               need for higher aerobic capacity in competition, it might be advisable to design
          Versus Repetitive Practices.          appropriate work:rest ratios for repetitive practices in daily training.
           Front. Physiol. 12:640199.
    doi: 10.3389/fphys.2021.640199              Keywords: athlete monitoring, match loads, smash training, energy supply, triaxial accelerometer

Frontiers in Physiology | www.frontiersin.org                                          1                                            June 2021 | Volume 12 | Article 640199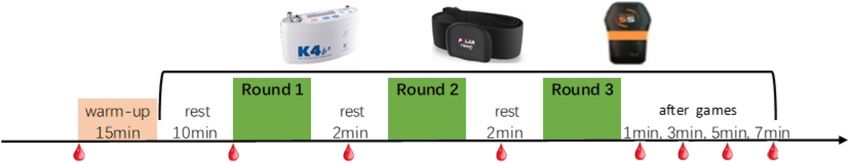
Fu et al.                                                                                                               Energy Contributions and Workloads

INTRODUCTION                                                              energy contributions and workloads in men and women during
                                                                          badminton matches and repetitive training.
Badminton is a physically demanding racquet sport that                       Therefore, the main purpose of this study was to compare
involves frequent bouts of high-intensity activity, and a                 the energy contributions and workloads in male and female
complex skill concerning repeated acceleration, deceleration,             badminton players. The further aim was to describe differences of
changes of direction (CoD), and jumps (Jum) (Cabello and                  energy contributions and workloads between badminton matches
Gonzalez, 2003; Abdullahi et al., 2019). Well-trained badminton           and intermittent stroke practices with a 1:2 work:rest ratio.
players are able to stroke using a diverse set of sport-specific
techniques at varying frequencies throughout a match. To
improve various kinds of stroke techniques, high-repetition               MATERIALS AND METHODS
practices are used extensively during daily training. However,
the workload of high-repetition stroke techniques has received            Participants
limited attention. A deeper understanding of the high-repetition          Fourteen healthy sub-elite badminton players who competed at
techniques may help to develop sport-specific training programs           the national level in their age group volunteered to participate
that could enhance performance in competitive badminton.                  in this study. The players stopped training 24 h before testing.
The contribution of each energy system in matches and                     They were instructed to maintain a regular diet and not to
for specific badminton skills is unclear. Previous studies                perform additional vigorous exercise during the experiment.
exploring the energetic profile of badminton players in games             On the day of testing, participants finished breakfast at least
showed a 60–70% aerobic-dominant profile (Chin et al., 1995;              1 h before reporting to the training center. All participants
Faccini and Dai Monte, 1996; Deka et al., 2017), and some                 were medically screened to ensure no contraindications to study
scientists found the adenosine triphosphate–phosphocreatine               participation. Anthropometric and performance characteristics
(ATP-PCr) system (EPCr ) and the glycolysis system (EHLa )                of these participants are presented in Table 1. Prior to the study,
to be the main suppliers of energy (Li and Ling, 1997).                   the players, their coaches, and guardians were informed of the
However, energy contributions may be influenced by different              test procedures and potential risks. After having the benefits and
physical loads, such as different strokes, foot movements                 risks explained to them, the players and their guardians provided
and the frequencies with which these actions take place.                  informed written consent. Ethical approval (approval number:
Therefore, a better understanding of the badminton player’s               20200901) was obtained from the research ethics committee of
energy contribution can only be established by investigating              the China Institute of Sport Science, Beijing, China.
the energetic profile for each combination of these and
similar actions.                                                          Design and Procedures
   Quantifying the physiological and physical loads imposed
                                                                          The study design was cross-sectional. All participants performed
by competitions and training drills is vital to understanding
                                                                          one badminton singles game and one session of repetitive spike
the dose–response nature of the exercise process with regard
                                                                          practice on separate days (both tests were conducted indoors at
to optimizing players’ performances. Athletic ability, gender,
                                                                          similar times of day: players who performed in the morning or
and posture are related to badminton injuries by understanding
                                                                          afternoon also practiced in the morning or afternoon). Energy
loading characteristics. For example, unskilled female players
                                                                          contributions and workloads were monitored by simultaneous
have been shown to be more vulnerable to lower extremity
                                                                          gas exchange measurements, HR technology and accelerometer
injuries (Lam et al., 2018), and postures have been associated with
                                                                          technology during games and practices. Before the formal test,
knee injuries during badminton games (Sasaki et al., 2018).
                                                                          the players performed 15 min sparring practice and dynamic
   Workloads have been extensively investigated in different
                                                                          stretching to warm up. After sitting still for 10 min, they
sports (Garcia et al., 2019, 2020; McFadden et al., 2020).
                                                                          put on the portable spirometry system (K4b2 , Cosmed, Rome,
Workloads include heart rate (HR), rating of perceived exertion
                                                                          Italy), HR monitor (Polar Accurex Plus, Polar Electro Inc.,
(RPE), Player Load (PL), accelerations (Acc), decelerations (Dec),
                                                                          Kempele, Finland), and Catapult OptimEye S5 (Catapult Sports,
CoD, Jum, and so on. Although studies that quantify these
loads are mostly limited to match performance or selected
training periods (Bartlett et al., 2017; Simpson et al., 2020;
                                                                          TABLE 1 | Participants’ characteristics.
Taylor et al., 2020), the loads required in various sport-
specific practices are equally important. Liu found that the                             Age (years)      Height (cm)     Body mass (kg)       Training
player’s lower back is an ideal location for a wearable sensor                                                                                experience
capable of monitoring overall badminton external loads (Liu                                                                                     (years)

et al., 2021). Trivial to moderate relationships have been found          Males         18.25 ± 3.41     181.88 ± 9.26     70.99 ± 17.80     10.88 ± 3.00
between internal and external match loads in male, singles                (N = 8)
badminton players (Abdullahi et al., 2019). However, additional           Females       16.50 ± 2.51     168.67 ± 3.88      54.95 ± 5.86      9.17 ± 2.56
research comparing energy contributions and workloads in                  (N = 6)
male and female badminton players is warranted in order to                Total         17.50 ± 3.08     176.21 ± 9.90     64.12 ± 15.87     10.14 ± 2.85
                                                                          (N = 14)
determine potential gender differences in practice strategies
and recovery needs. At present, no study has compared the                 Data are presented as mean ± SD.

Frontiers in Physiology | www.frontiersin.org                         2                                              June 2021 | Volume 12 | Article 640199
Fu et al. Energy Contributions and Workloads
FIGURE 1 | Test flow chart of a badminton match.
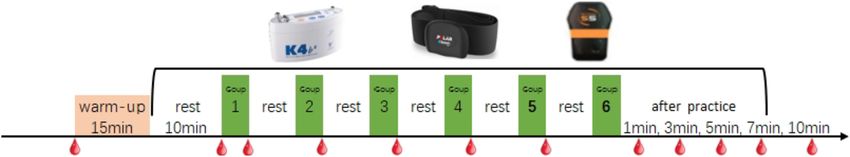
FIGURE 2 | Test flow chart of multi-ball stroke practice for each player.
Melbourne, VIC, Australia). Standard calibration was performed Energy Contributions Monitoring
with a 3-L syringe and a standard gas with a known composition The energy contributions monitored by portable spirometry
(O2 : 15.00%, CO2 : 5.09%), which was corrected for barometric included the ATP-PCr system/anaerobic alactic contribution
pressure and humidity prior to the test. Players wore the (EPCr ), the glycolytic system/anaerobic lactic energy contribution
abovementioned devices during the games and practice sessions. (EHLa ), the oxidative system/aerobic energy contribution (EAer ),
Prior to the warmup, immediately before the first set, between the total energy contribution (ETot ), the average rate of
each set and during the recovery period following the games carbohydrate oxidation (RCHO ), and the average rate of lipid
or practice, 10 µl of capillary blood was collected from the ear oxidation (RLip ). Calculations of the average energy contributions
lobe to determine the blood lactate concentration (Biosen C and energy costs were made using gas exchange data that were
line, EKF Diagnostic, Magdeburg, Germany). The accumulated recorded during the test and rest periods.
blood lactate values were used to calculate the energy from the
anaerobic lactic pathway. Calculation of the energy system’s contributions
To estimate the energy expenditure of all tests, the sum of the
contributions of the three energy systems was determined in
Badminton Match Play
accordance with the methodology used by other studies in sports
Prior to the formal test, the players were divided into seven pairs
(di Prampero, 1981; Davis et al., 2014; Julio et al., 2017; Li et al.,
for the singles games; pairing was organized to ensure that players
2018, 2020):
were of a similar skill level. They were also instructed to dress and
eat as they usually would for a match. The games would follow (1) The ATP-PCr system contribution was shown as EPCr and
the rules of the International Badminton Federation: three games estimated using the first 3-min fast phase of the V̇O2 after
played to 21 points; if both players score 20 points, a player must exercise (games or practices), with a caloric equivalent of
lead his or her opponent by 2 points to win. During the game, 0.021131 kJ/ml at respiratory exchange ratio >1.0. The first
when the leading player scored 11 points, both players took a 1- 3-min slow phase of the V̇O2 was determined by using an
min rest. Between the rounds, players had a 2-min break. The approximated exponential equation estimated from a non-
competitions were judged by a national referee. In order to make linear fitting procedure. The equation was derived from the
the test resemble an actual game as much as possible, the winners actual V̇O2 of the second 3 min after exercise.
and losers were given different rewards as incentives. The specific
test process is shown in Figure 1. Fast phase of theV̇O2 (ml)
= actualV̇O2 (ml) − slow phase of theV̇O2 (ml)
Repetitive Stroke Practice EPCr (kJ) = fast phase of theV̇O2 (ml) × 0.021131(kJ/ml)
Fourteen players performed six sets of spike practice 10 times. An
experienced coach was responsible for continuous serves from (2) The glycolytic system contribution, shown as anaerobic
the other half of the court to ensure that the participants could lactic energy contribution (EHLa ), was calculated from the
perform the overhead stroke smoothly. After each set, the players accumulated blood lactate during the test (maximal value
took a break (sitting still) for twice the exercise time. The specific subtracted resting value) with the O2 -lactate equivalent of
test process is shown in Figure 2. 3.0 ml/mM/kg (assuming that the accumulation of 1 mM
Frontiers in Physiology | www.frontiersin.org 3 June 2021 | Volume 12 | Article 640199Fu et al. Energy Contributions and Workloads
in lactate was equivalent to 3 ml O2 per kilogram of body Workloads Monitoring
mass). Resting blood lactate was the value before warmup The workload variables used in this study were HR, absolute
and maximal blood lactate was the largest of all values. PL, relative PL, Acc, Dec, CoD (left and right), and Jum. A 10-
Hz GPS device fitted with a 100-Hz triaxial accelerometer,
Accumulated blood lactate (mM) = gyroscope, and magnetometer (OptimEye S5, Catapult Sports,
Melbourne, VIC, Australia) was securely positioned between
maximal blood lactate (mM) − resting blood lactate (mM)
the participant’s scapulae using a custom-made vest. The device
firmware version was 7.40. The data were processed by the
EHLa (kJ) = accumulated blood lactate (mM) manufacturer’s software (OpenField, v1.21.1, Catapult Sports,
× 3.0(ml/mM/kg) × body mass (kg) × 0.021131(kJ/ml) Melbourne, VIC, Australia). The numbers of Acc, Dec, CoD,
and Jum and CoD, including both left turns (CoD left) and
(3) The oxidative system contribution, shown as aerobic right turns (CoD right), were measured by the device’s inertial
energy contribution (EAer ), was calculated from the sensors, throughout the test. (Data between sets were excluded).
accumulated V̇O2 during test above resting levels, with Absolute PL was defined as the sum of the acceleration vectors
a caloric equivalent of 0.021131 kJ/ml at respiratory as assessed through the accelerometer (Catapult OptimEye S5)
exchange ratio >1.0. Rest levels were defined as in three axes (lateral, vertical, and anterior/posterior). Relative
4.0 ml/min/kg for males and 3.5 ml/min/kg for females PL was determined as PL per minute in each period. Both
in a standing posture. Total V̇O2 during exercises (games absolute PL and relative PL were measured in arbitrary units
or practices) was calculated from the portable spirometry (au). The PL variable demonstrated strong validity and reliability
system and expressed in milliliters. indices to assess the neuromuscular load of each referee, and
the corresponding value was calculated through the following
Resting V̇O2 for males (ml) equation:
= 4.0 (ml/min/kg) × bodymass (kg) × duration (min) Player Load t=n =
Resting V̇O2 for females (ml)
s
t=n
X (Xt=n − Xt=n−1 )2 (Yt=n − Yt=n−1 )2 (Zt=n − Zt=n−1 )2
= 3.5(ml/min/kg) × bodymass(kg) × duration(min) 100
t=0
AccumulatedV̇O2 (ml) = totalV̇O2 (ml) − restingV̇O2 (ml)
where X refers to acceleration in the medial–lateral direction, Y
EAer (kJ) = accumulatedV̇O2 (ml) × 0.021131(kJ/ml) refers to vertical acceleration, and Z represents acceleration from
the anterior-to-posterior direction. Time is represented by t and
(4) The total energy expenditure (ETol ) was computed as the n refers to number.
sum of EPCr , EHLa , and EAer . In addition, the contributions
of the three energy systems were expressed as a percenage Statistical Analyses
of the total energy expenditure. Statistical analyses were conducted using the IBM SPSS
statistical software (version 25.0, IBM Corporation, Armonk,
ETot (kJ) = EPCr (kJ) + EHLa (kJ) + EAer (kJ) NY, United States). Results were expressed as means ± standard
EPCr (%) = EPCr (kJ) ÷ ETot (kJ) × 100% deviations (SD). The Shapiro–Wilk test was used to assess
normality. Comparisons between male and female players as well
EHLa (%) = EHLa (kJ) ÷ ETot (kJ) × 100% as players who won their matches compared with the losing
players were carried out using independent-sample t-tests if
EAer (%) = EAer (kJ) ÷ ETot (kJ) × 100%
data satisfied normal distribution. Otherwise, non-parametric
test (Mann–Whitney U test) was used to compare groups.
Calculation of substrate oxidation
Significance level was set at p < 0.05.
Substrate oxidation was estimated for the interval session,
including work and rest periods. Carbohydrate and lipid
oxidation rates were calculated by the non-protein respiratory RESULTS
quotient (Peronnet and Massicotte, 1991; Pettersson et al., 2019),
Oxygen consumption (V̇O2 ) and carbon dioxide production
Results of Energy Contributions and
(V̇CO2 ) were expressed in liters per minute (L/min) and
oxidation rate in grams per minute (g/min): Workloads During Game
The 14 players played a total of seven games. Six matches reached
Carbohydrate oxidation rate two rounds; only one game (female) had three rounds. The
average match duration was 24.93 ± 6.33 min. Statistics for the
= (4.585 × V̇CO2 ) − (3.226 × V̇O2 ) energy contributions and workloads are presented in Table 2.
Lipid oxidation rate According to non-parametric distributions, only the comparisons
of absolute PL (AU) and decelerations (n) between men and
= (1.695 × V̇O2 ) − (1.701 × V̇CO2 ) women and the comparisons of EPCr (%), relative PL (AU), and
Frontiers in Physiology | www.frontiersin.org 4 June 2021 | Volume 12 | Article 640199Fu et al. Energy Contributions and Workloads
TABLE 2 | Descriptive results of energy contributions and workloads during a badminton match.
Males Females Victory Defeat Total
Energy contributions EPCr (kJ) 45.04 ± 10.04 28.55 ± 5.14* 44.82 ± 13.43 33.42 ± 8.19 38.17 ± 11.69
EHLa (kJ) 13.62 ± 11.04 7.30 ± 3.19 12.96 ± 10.84 9.67 ± 8.11 11.19 ± 9.20
EAer (kJ) 832.07 ± 175.63 826.76 ± 226.96 817.37 ± 213.89 840.88 ± 178.66 830.03 ± 187.54
ETot (kJ) 920.82 ± 164.26 862.62 ± 224.83 914.19 ± 214.84 883.98 ± 176.39 896.57 ± 184.38
EPCr (%) 5.01 ± 1.47 3.51 ± 1.09 5.05 ± 1.83 3.90 ± 1.09 4.38 ± 1.48
EHLa (%) 1.74 ± 1.61 0.87 ± 0.42 1.74 ± 1.74 1.11 ± 0.93 1.38 ± 1.29
EAer (%) 93.25 ± 2.98 95.62 ± 1.38 93.20 ± 3.52 94.98 ± 1.75 94.24 ± 2.65
RCHO (g/min) 1.56 ± 0.69 0.96 ± 0.12* 1.52 ± 0.81 1.17 ± 0.38 1.33 ± 0.62
RLip (g/min) 0.67 ± 0.16 0.52 ± 0.08 0.64 ± 0.19 0.59 ± 0.12 0.61 ± 0.15
Workloads Mean HR (bpm) 162.38 ± 18.35 171.17 ± 8.93 168.57 ± 19.42 163.71 ± 10.63 166.14 ± 15.25
HRmax (bpm) 194.50 ± 15.00 198.50 ± 4.76 194.29 ± 13.61 198.14 ± 9.84 196.21 ± 11.58
Absolute PL (AU) 111.85 ± 19.77 147.82 ± 31.24* 118.76 ± 24.49 135.77 ± 35.21 127.27 ± 30.44
Relative PL (AU) 5.02 ± 0.26 4.92 ± 0.86 4.66 ± 0.39 5.29 ± 0.571 4.98 ± 0.57
Accelerations (n) 41.75 ± 14.92 72.50 ± 18.63* 50.00 ± 17.23 59.86 ± 27.12 54.93 ± 22.42
Decelerations (n) 46.38 ± 29.91 68.17 ± 29.86 55.71 ± 35.68 55.71 ± 28.02 55.71 ± 30.82
CoD left (n) 144.13 ± 40.76 165.67 ± 75.82 143.00 ± 62.66 163.71 ± 53.08 153.36 ± 56.81
CoD right (n) 82.25 ± 35.25 70.00 ± 11.54 83.86 ± 37.50 70.14 ± 11.39 77.00 ± 27.56
Jumps (n) 27.63 ± 16.17 31.50 ± 19.58 30.71 ± 20.69 27.86 ± 14.16 29.29 ± 17.09
Values are expressed as means ± SD. EPCr , ATP-PCr system contribution; EHLa , glycolytic system contribution; EAer , aerobic energy contribution; ETot , total energy
contribution; RCHO , average rate of carbohydrate oxidation; RLip , average rate of lipid oxidation; HR, heart rate; Max, maximum; PL, Player Load; CoD, changes of direction.
*Significantly different from males (p < 0.05).
1 Significantly different from victory (p < 0.05).
jumps (n) between victory and defeat used an on-parametric Male players accumulated a significantly greater number of jumps
test (Mann–Whitney U test); other variables used independent- (p = 0.0002) during multi-ball spike practices, but no differences
sample t-tests. There were statistically significant differences in other training load variables were seen between genders.
in EPCr (kJ), RCHO (g/min), absolute PL, and accelerations (n)
between male and female players (p < 0.05). Male players Differences in Energy Contributions and
exhibited higher anaerobic alactic capacity (p = 0.008) and Workloads Between Game and
average rate of carbohydrate oxidation (p = 0.044) than female
Repetitive Stroke Practice
players. The female players showed greater workloads in absolute
Comparisons of energy contributions and workloads in single-
PL (p = 0.029) and number of accelerations (p = 0.005)
player games and multi-ball spike training are presented in
compared with their male counterparts. No other significant
Table 4. Only some indicators (those less influenced by duration)
gender differences were seen during a match. Furthermore,
were selected. Since data exhibited non-parametric distributions,
defeated players exhibited a higher relative PL than winners
comparisons of EHLa (%), EAer (%), and RCHO (g/min) between
(p = 0.017).
games and stroke practices used an on-parametric test (Mann–
Whitney U test); other variables used independent-sample t-tests.
Results of Energy Contributions and Among these indicators, players exhibited higher EPCr (%)
Workloads During Repetitive Stroke (p = 0.00003) and EHLa (%) (p < 0.001) during repetitive spike
training, and higher aerobic energy contribution (p < 0.001)
Practice during games. Higher mean HR (p = 0.002) and max HR
The average spike training session was 11.4 ± 0.45 min. No (p = 0.029) were found during games, but greater relative PL
significant difference in duration was seen between male and (p = 0.001) was seen in multi-ball spike training.
female players. Descriptive statistics of energy contributions
and training load-related results are presented in Table 3.
Only comparisons of EPCr (%), accelerations (n), decelerations DISCUSSION
(n), CoD Left (n), and CoD Right (n) between men and
women used an on-parametric test (Mann–Whitney U test), Badminton matches last around 28–78 min (10–21 min/round)
because these data exhibited non-parametric distributions, and and are fast paced with intermittent moments. The duration of
other variables used independent-sample t-tests. Higher energy a single bout is about 6–12 s, and the number of shots in a
system contributions, including EPCr (kJ) (p = 0.028), EHLa (kJ) bout is around 5–12 strokes (Faude et al., 2007; Abián-Vicén
(p = 0.024), EAer (kJ) (p = 0.012), ETot (kJ) (p = 0.007), and et al., 2013; Abian et al., 2014; Gawin et al., 2015; Laffaye et al.,
RCHO (g/min) (p = 0.0002), were seen in male players; there 2015; Kah Loon and Krasilshchikov, 2016; Savarirajan, 2016).
was no difference in the percentages of the three energy systems. These bouts involve multiple accelerations, decelerations, CoD,
Frontiers in Physiology | www.frontiersin.org 5 June 2021 | Volume 12 | Article 640199Fu et al. Energy Contributions and Workloads
TABLE 3 | Descriptive results of energy contributions and workloads during the occurrence of low-intensity intervals between bouts, which
stroke practices.
is characterized by 72.6–74.8% ˙V̇O2 max, 70–85% HRmax, and
Males Females Total 1.98–4.6 mM blood lactate concentration (Majumdar et al., 1997;
Cabello and Gonzalez, 2003; Faude et al., 2007; Sung, 2016).
Energy EPCr (kJ) 43.37 ± 5.53 32.07 ± 11.17* 38.53 ± 9.91 Other studies have revealed that the energy consumption is
contributions
significantly greater in singles matches when compared with
EHLa (kJ) 48.32 ± 24.81 19.86 ± 12.09* 36.12 ± 24.52
doubles matches and that these differences are not related to
EAer (kJ) 439.16 ± 88.83 325.46 ± 32.61* 390.43 ± 89.82
a player’s gender (Lee, 2013). Similar to the findings of the
ETot (kJ) 530.85 ± 108.10 377.39 ± 45.99* 465.09 ± 115.40
present study, gender differences in activity patterns induced
EPCr (%) 8.55 ± 2.61 8.34 ± 2.31 8.46 ± 2.39
only slightly different physiological responses (Fernandez et al.,
EHLa (%) 8.71 ± 3.15 5.18 ± 3.04 7.20 ± 3.49
2013). Our investigation explored the energy contributions and
EAer (%) 82.74 ± 3.31 86.48 ± 3.38 84.34 ± 3.74
workloads in male and female badminton players: while the
RCHO (g/min) 2.44 ± 0.58 1.10 ± 0.26* 1.86 ± 0.82
similarities in proportional use of the three energy systems
RLip (g/min) 0.56 ± 0.10 0.51 ± 0.11 0.54 ± 0.10
between male and female badminton players during games and
Workloads Mean HR 146.57 ± 10.42 149.73 ± 14.44 147.92 ± 11.89
(bpm)
training sessions indicate similar relative energy demands for
HRmax 189.38 ± 8.00 185.50 ± 6.53 187.71 ± 7.41
both genders, male players showed higher EPCr (kJ) during games
(bpm) and greater energy contributions, including EPCr (kJ), EHLa (kJ),
Absolute PL 77.78 ± 6.78 68.71 ± 14.10 73.89 ± 11.09 EAer (kJ), and ETot (kJ), during spike practices than female
(AU) players. At the same time, male players had a higher average rate
Relative PL 6.30 ± 0.63 5.60 ± 0.91 6.00 ± 0.81 of carbohydrate oxidation during games and repetitive practice
(AU) sets. This suggests that players (especially males) should enhance
Accelerations 3.38 ± 2.62 7.83 ± 10.01 5.29 ± 6.89 carbohydrate supplementation during competition and high-
(n)
intensity training. Additionally, female players showed greater
Decelerations 4.38 ± 4.03 3.17 ± 3.82 3.86 ± 3.84
workloads in absolute PL and the number of accelerations
(n)
compared with male players, while male players accumulated
CoD left (n) 37.88 ± 11.78 31.50 ± 12.55 35.14 ± 12.08
a significantly greater number of jumps during spike practices.
CoD right (n) 16.50 ± 17.91 4.83 ± 3.54 11.50 ± 14.61
Jumps (n) 61.25 ± 21.71 9.17 ± 10.61* 38.93 ± 31.82
No other differences in workload variables between genders
were observed. In contract to the present study, Rojas-Valverde
Values are expressed as means ± SD. EPCr , ATP-PCr system contribution; et al. (2020) found gender-related differences in maximum
EHLa , glycolytic system contribution; EAer , aerobic energy contribution; ETot , total
energy contribution; RCHO , average rate of carbohydrate oxidation; RLip , average accelerations, relative accelerations, and relative distance during
rate of lipid oxidation; HR, heart rate; Max, maximum; PL, Player Load; CoD, games. This is most likely related to the monitoring equipment’s
changes of direction. method of generating statistics for jumping: the equipment used
*Significantly different from males (p < 0.05).
in this study only recorded jumps when both feet were off
the ground simultaneously at a certain vertical height; it did
TABLE 4 | Differences of energy contributions and workloads between not record as jumps those movements in which only one foot
games and practices.
left the ground or when one foot left the ground, then the
Game Practice other. The different jumping styles and heights between genders
likely explain the difference in the number of jumps recorded.
Energy contributions EPCr (%) 4.38 ± 1.48 8.46 ± 2.39*
Differences in workloads between this study and other studies
EHLa (%) 1.38 ± 1.29 7.20 ± 3.49*
may be related to the dissimilarities in type, intensity, and
EAer (%) 94.24 ± 2.65 84.34 ± 3.74*
duration of the activities involved (Ghosh et al., 1990, 1993; Chin
RCHO (g/min) 1.33 ± 0.62 1.86 ± 0.82
et al., 1995; Faude et al., 2007; Aydogmus, 2015; Deka et al.,
RLip (g/min) 0.61 ± 0.15 0.54 ± 0.1
2017). For instance, the frequency and movement pattern during
Workloads Mean HR (bpm) 166.14 ± 15.25 147.92 ± 11.89*
an overhead stroke may differ between players (Sasaki et al.,
HRmax (bpm) 196.21 ± 11.58 187.71 ± 7.41*
2020) while lunging during underhand strokes on the dominant
Relative Player 4.98 ± 0.57 6.00 ± 0.81*
Load (AU)
hand side leg had greater mediolateral acceleration than other
movements (Nagano et al., 2020).
Values are expressed as means ± SD. EPCr , ATP-PCr system contribution; The importance of the aerobic energy supply in badminton
EHLa , glycolytic system contribution; EAer , aerobic energy contribution; ETot , total
energy contribution; RCHO , average rate of carbohydrate oxidation; RLip , average was underestimated in some studies, which observed that
rate of lipid oxidation; HR, heart rate; Max, maximum; PL, Player Load; CoD, 60–70% energy is contributed by the aerobic system and
changes of direction. approximately 30% by the anaerobic system, with greater demand
*Significant differences between game and multi-ball spike training.
on the anaerobic alactic metabolism than the lactic anaerobic
metabolism (Phomsoupha and Laffaye, 2015). The results of this
and jumps, which can raise one’s HR to 95% of its maximum level study, which observed that almost 95% energy is contributed
(HRmax) (Gawin et al., 2015; Laffaye et al., 2015; Abdullahi and by the aerobic system, pointed to the need for a higher aerobic
Coetzee, 2017). However, the workloads and average intensity capacity in competitive badminton players. Daily training should
are not very high over the entire duration of a match due to be designed to further develop a sufficient endurance capacity.
Frontiers in Physiology | www.frontiersin.org 6 June 2021 | Volume 12 | Article 640199Fu et al. Energy Contributions and Workloads
Furthermore, there are great differences in the proportions Study results suggest that there are important differences
of the three energy systems between competition and the in the contributions of the three energy systems between
intermittent spike training with a 1:2 work:rest ratio. Players competition and repetitive spike training. Considering the
exhibited higher aerobic energy contribution during games, and need for higher aerobic capacity in competition, it may
higher anaerobic energy contribution during spike training. be practical for badminton coaches and athletes to choose
This suggests that we should put particular emphasis on appropriate intermittent work:rest ratio in this technique
the aerobic ability of badminton players and that a larger during high-repetition practices. We suggest that players at
intermittent work:rest ratio of each repetitive drill should be different competitive levels should undertake training regimens
considered. Integrated training programs should be conducted of different work:rest ratios and overall durations.
to combine physical demands with decision-making demands. Monitoring and quantifying energy contributions and
Aerobic assessment using indirect calorimetry is impractical workloads during matches and training are indispensable
on the court due to the burden of wearing portable metabolic for determining individualized training regimes. Training
devices. Some coaches use V̇O2 max to distinguish players’ programs should be adjusted according to specific competitive
levels, but Ooi observed that V̇O2 max may not discriminate characteristics in accordance with the demands of different
elite badminton players from sub-elite counterparts, suggesting sports. Wearable technologies are an efficient method for
that tactical knowledge and psychological readiness could monitoring workloads throughout the season in order to help
be more important for elite athletes (Ooi et al., 2009). We enhance players’ performances.
suggest that players at different levels of expertise should
undertake different training regimens, with different work:rest
ratios and overall durations. Given that HR monitoring DATA AVAILABILITY STATEMENT
may not provide accurate data on the energetic demands
for badminton players, an indirect calorimetry test on The raw data supporting the conclusions of this article will be
court to assess energetic demands would be more precise made available by the authors, without undue reservation.
(Rampichini et al., 2018). Nevertheless, the results from
laboratory treadmill testing seem to be a poor predictor of
a player’s ability, compared to their game play performance ETHICS STATEMENT
(Heller, 2010).
The present study’s limitations include a lack of repeated The studies involving human participants were reviewed and
match and training data and the relatively small sample size. approved by the Ethics Committee of China Institute of Sport
Future research into both energy contributions and workloads Science, China. Written informed consent to participate in this
derived from laboratory experiments is warranted in order to study was provided by the participants’ legal guardian/next of kin.
understand the relative differences in workloads of each player.
The need for additional research also applies to the determination
of sprint classifications specific to badminton, as well as game-
AUTHOR CONTRIBUTIONS
specific CoD or acceleration. YL and XC contributed to conception and design of the study.
Consequently, we encourage measuring these activities both YL, BL, and XC designed the study. XW and LS collected the
in future research and during practices throughout the sports data. XW and YF conducted the analyses. YF and YS wrote
season. Future studies should expand our knowledge of energy the manuscript. All authors read and approved the final version
contributions and workloads in routine badminton drills, of the manuscript.
including spike training with different work:rest ratios and
other combinations of badminton techniques. Additionally,
this study should be made of badminton players at different FUNDING
levels of expertise.
This work was supported by the China Institute of Sport Science
(Basic17-30) and National Key Research and Development
Program of China (2018YFF0300500).
APPLICATIONS AND CONCLUSION
Our findings highlight the similarities in proportional use ACKNOWLEDGMENTS
of the three energy systems between male and female
badminton players throughout competition and repetitive We would like to thank all the volunteers who took part in this
spike training. Players (especially males) should enhance study that were supported by Nanjing Sport Institute, Shanghai
carbohydrate supplementation during competition and high- University of Sport and China Institute of Sport Science. We
intensity training in accordance with the higher carbohydrate gratefully appreciate all the volunteers who participated in
oxidation rate observed. this study.
Frontiers in Physiology | www.frontiersin.org 7 June 2021 | Volume 12 | Article 640199Fu et al. Energy Contributions and Workloads
REFERENCES Kah Loon, L., and Krasilshchikov, O. (2016). Match and game performance
structure variables in elite and youth international badminton players. J. Phys.
Abdullahi, Y., and Coetzee, B. (2017). Notational singles match analysis of male Educ. Sport 16, 330–334.
badminton players who participated in the African Badminton Championships. Laffaye, G., Phomsoupha, M., and Dor, F. (2015). Changes in the game
Int. J. Perform. Anal. Sport 17, 1–16. doi: 10.1080/24748668.2017.130 characteristics of a badminton match: a longitudinal study through the
3955 olympic game finals analysis in men’s singles. J. Sports Sci. Med. 14,
Abdullahi, Y., Coetzee, B., and van den Berg, L. (2019). Relationships between 584–590.
results of an internal and external match load determining method in male. Lam, W. K., Lee, K. K., Park, S. K., Ryue, J., Yoon, S. H., and Ryu, J. (2018).
Singles Badminton Players. J. Strength Cond Res. 33, 1111–1118. doi: 10.1519/ Understanding the impact loading characteristics of a badminton lunge among
JSC.0000000000002115 badminton players. PLoS One 13:e0205800. doi: 10.1371/journal.pone.0205800
Abian, P., Castanedo, A., Feng, X. Q., Sampedro, J., and Abian-Vicen, J. Lee, J. y (2013). Analysis of exercise intensity and energy consumption during
(2014). Notational comparison of men’s singles badminton matches between practice match in men and women badminton players. Korean J. Sport 14,
Olympic Games in Beijing and London. Int. J. Perform. Anal. Sport 14, 227–236.
42–53. doi: 10.1080/24748668.2014.11868701 Li, Y., and Ling, W. (1997). Research into the relationship between the particular
Abián-Vicén, J., Castanedo, A., Abian, P., and Sampedro, J. (2013). Temporal of time structure and energy supply way in badminton match. J. Guang. Phys.
and notational comparison of badminton matches between men’s singles Educ. Instit. 17, 26–31.
and women’s singles. Int. J. Perform. Anal. Sport 13, 310–320. doi: 10.1080/ Li, Y. M., Li, B., Wang, X. X., Fu, W. J., Dai, B. Y., Nassis, G. P., et al. (2020).
24748668.2013.11868650 Energetic profile in forehand loop drive practice with well-trained, young
Aydogmus, M. (2015). Physical profiles of Turkish elite badminton players. Asia table tennis players. Int. J. Environ. Res. Public Health 17:3681. doi: 10.3390/
Life Sci. 24, 335–342. ijerph17103681
Bartlett, J. D., O’Connor, F., Pitchford, N., Torres-Ronda, L., and Robertson, S. J. Li, Y. M., Niessen, M., Chen, X. P., and Hartmann, U. (2018). Method-induced
(2017). Relationships between internal and external training load in team-sport differences of energy contributions in women’s kayaking. Int. J. Sports Physiol.
athletes: evidence for an individualized approach. Int. J. Sports Phys. Perform. Perform. 13, 9–13. doi: 10.1123/ijspp.2016-0491
12, 230–234. doi: 10.1123/ijspp.2015-0791 Liu, T. H., Chen, W. H., Shih, Y., Lin, Y. C., Yu, C., and Shiang, T. Y. (2021).
Cabello, M. D., and Gonzalez, B. J. J. (2003). Analysis of the characteristics of Better position for the wearable sensor to monitor badminton sport training
competitive badminton. Br. J. Sports Med. 37, 62–66. doi: 10.1136/bjsm.37.1.62 loads. Sports Biomech 1–13. doi: 10.1080/14763141.2021.1875033 [Epub ahead
Chin, M. K., Wong, A. S., So, R. C., Siu, O. T., Steininger, K., and Lo, D. T. (1995). of print].
Sport specific fitness testing of elite badminton players. Br. J. Sports Med. 29, Majumdar, P., Khanna, G. L., Malik, V., Sachdeva, S., Arif, M., and
153–157. doi: 10.1136/bjsm.29.3.153 Mandal, M. (1997). Physiological analysis to quantify training load
Davis, P., Leithauser, R. M., and Beneke, R. (2014). The energetics of semicontact in badminton. Br. J. Sports Med. 31, 342–345. doi: 10.1136/bjsm.31.
3 x 2-min amateur boxing. Int. J. Sports Physiol. Perform. 9, 233–239. doi: 4.342
10.1123/IJSPP.2013-0006 McFadden, B. A., Walker, A. J., Bozzini, B. N., Sanders, D. J., and Arent,
Deka, P., Berg, K., Harder, J., Batelaan, H., and Mc, G. M. (2017). Oxygen S. M. (2020). Comparison of internal and external training loads in
cost and physiological responses of recreational badminton match play. male and female collegiate soccer players during practices vs. Games.
J. Sports Med. Phys. Fitness 57, 760–765. doi: 10.23736/S0022-470.7.16.06 J. Strength Cond. Res. 34, 969–974. doi: 10.1519/JSC.0000000000
319-2 003485
di Prampero, P. E. (1981). Energetics of muscular exercise. Rev. Physiol. Biochem. Nagano, Y., Sasaki, S., Higashihara, A., and Ichikawa, H. (2020). Movements
Pharmacol. 89, 143–222. doi: 10.1007/BFb0035266 with greater trunk accelerations and their properties during badminton
Faccini, P., and Dai Monte, A. (1996). Physiologic demands of badminton match games. Sports Bio. 19, 342–352. doi: 10.1080/14763141.2018.14
play. Am. J. Sports Med. 6(Suppl.), S64–S66. 78989
Faude, O., Meyer, T., Rosenberger, F., Fries, M., Huber, G., and Ooi, C., Tan, A., Ahmad, A., Kwong, K., Sompong, R., Mohd Ghazali, K., et al.
Kindermann, W. (2007). Physiological characteristics of badminton (2009). Physiological characteristics of elite and sub-elite badminton players.
match play. Eur. J. Appl. Physiol. 100, 479–485. doi: 10.1007/s00421-007- J. Sports Sci. 27, 1591–1599. doi: 10.1080/02640410903352907
0441-8 Peronnet, F., and Massicotte, D. (1991). Table of nonprotein respiratory quotient:
Fernandez, J., Tellez, J. G. D., Moya-Ramon, M., Cabello-Manrique, D., and an update. Can. J. Sport Sci. 16, 23–29.
Mendez-Villanueva, A. (2013). Gender differences in game responses during Pettersson, S., Edin, F., Bakkman, L., and McGawley, K. (2019). Effects of
badminton match play. J. Strength Condit. Res. 27, 2396–2404. doi: 10.1519/ supplementing with an 18% carbohydrate-hydrogel drink versus a placebo
JSC.0b013e31827fcc6a during whole-body exercise in -5 degrees C with elite cross-country ski athletes:
Garcia, B. F., Buckley, J. D., Bishop, C., Schwerdt, S., Porter, J., Bailey, D., et al. a crossover study. J. Int. Soc. Sports Nutr. 16:46. doi: 10.1186/s12970-019-
(2020). External and internal workload demands of women’s twenty 20 cricket 0317-4
competition. J. Sci. Med. Sport 23, 89–93. doi: 10.1016/j.jsams.2019.09.006 Phomsoupha, M., and Laffaye, G. (2015). The science of badminton: game
Garcia, S. D., Pino, O. J., Garcia, R. J., Vaquera, A., and Ibanez, S. J. characteristics, anthropometry, physiology, visual fitness and biomechanics.
(2019). Internal and external demands in basketball referees during the U- Sports Med. 45, 473–495. doi: 10.1007/s40279-014-0287-2
16 European Women’s championship. Int. J. Environ. Res. Public Health Rampichini, S., Limonta, E., Pugliese, L., Ce, E., Bisconti, A. V., Gianfelici, A.,
16:3421. doi: 10.3390/ijerph16183421 et al. (2018). Heart rate and pulmonary oxygen uptake response in professional
Gawin, W., Beyer, C., and Seidler, M. (2015). A competition analysis of the single badminton players: comparison between on-court game simulation and
and double disciplines in world-class badminton. Int. J. Perform. Anal. Sport 15, laboratory exercise testing. Eur. J. Appl. Physiol. 118, 2339–2347. doi: 10.1007/
997–1006. doi: 10.1080/24748668.2015.11868846 s00421-018-3960-6
Ghosh, A. K., Goswami, A., and Ahuja, A. (1993). Evaluation of a sports specific Rojas-Valverde, D., Gómez-Carmona, C. D., Fernández-Fernández, J., García-
training programme in badminton players. Indian J. Med. Res. 98, 232–236. López, J., García-Tormo, V., Cabello-Manrique, D., et al. (2020). Identification
Ghosh, A. K., Mazumdar, P., Goswami, A., Ahuja, A., and Puri, T. P. S. (1990). of games and sex-related activity profile in junior international badminton. Int.
Heart rate and blood lactate response in competitive badminton. Ann. Sports J. Perform. Anal. Sport 20, 323–338. doi: 10.1080/24748668.2020.1745045
Med. 5, 85–88. Sasaki, S., Nagano, Y., and Ichikawa, H. (2018). Loading differences in single-leg
Heller, J. (2010). Physiological profiles of elite badminton players: aspects of age landing in the forehand- and backhand-side courts after an overhead stroke in
and gender. Br. J. Sports Med. 44:17. doi: 10.1136/bjsm.2010.078725.51 badminton: a novel tri-axial accelerometer research. J. Sports Sci. 36, 2794–2801.
Julio, U. F., Panissa, V. L. G., Esteves, J. V., Cury, R. L., Agostinho, M. F., and doi: 10.1080/02640414.2018.1474535
Franchini, E. (2017). Energy-system contributions to simulated judo matches. Sasaki, S., Nagano, Y., and Ichikawa, H. (2020). Differences in high trunk
Int. J. Sports Physiol. Perform. 12, 676–683. doi: 10.1123/ijspp.2015-0750 acceleration during single-leg landing after an overhead stroke between junior
Frontiers in Physiology | www.frontiersin.org 8 June 2021 | Volume 12 | Article 640199Fu et al. Energy Contributions and Workloads and adolescent badminton athletes. Sports Bio. 1–16. doi: 10.1080/14763141. rugby union players. J. Strength Cond. Res. 34, 1723–1730. doi: 10.1519/JSC. 2020.1740310 [Epub ahead of print]. 0000000000002391 Savarirajan, R. (2016). Result of heart rate, playing time and performance of tamilnadu badminton senior ranking players. Int. J. Sports Sci. Fitness 6, Conflict of Interest: The authors declare that the research was conducted in the 43–56. absence of any commercial or financial relationships that could be construed as a Simpson, M. J., Jenkins, D. G., Scanlan, A. T., and Kelly, V. G. (2020). Relationships potential conflict of interest. between external- and internal-workload variables in an elite female netball team and between playing positions. Int. J. Sports Physiol. Perform. 15, Copyright © 2021 Fu, Liu, Chen, Li, Li, Wang, Shu and Shang. This is an open-access 841–846. doi: 10.1123/ijspp.2019-0619 article distributed under the terms of the Creative Commons Attribution License Sung, B. J. (2016). Study of physical activity and heart rate in national badminton (CC BY). The use, distribution or reproduction in other forums is permitted, provided players. Exerc. Sci. 25, 248–255. doi: 10.15857/ksep.2016.25.4.248 the original author(s) and the copyright owner(s) are credited and that the original Taylor, R. J., Sanders, D., Myers, T., and Akubat, I. (2020). Reliability and validity publication in this journal is cited, in accordance with accepted academic practice. No of integrated external and internal load ratios as measures of fitness in academy use, distribution or reproduction is permitted which does not comply with these terms. Frontiers in Physiology | www.frontiersin.org 9 June 2021 | Volume 12 | Article 640199
You can also read