Complex, Dynamic Combination of Physical, Chemical and Nutritional Variables Controls Spatio-Temporal Variation of Sandy Beach Community Structure
←
→
Page content transcription
If your browser does not render page correctly, please read the page content below
Please do not remove this page

Complex, Dynamic Combination of Physical,
Chemical and Nutritional Variables Controls
Spatio-Temporal Variation of Sandy Beach
Community Structure
Ortega Cisneros, K; Smit, A J; Laudien, J; et.al.
https://research.usc.edu.au/discovery/delivery/61USC_INST:ResearchRepository/12126451310002621?l#13127185530002621

Ortega Cisneros, K., Smit, A. J., Laudien, J., & Schoeman, D. S. (2011). Complex, Dynamic Combination of
Physical, Chemical and Nutritional Variables Controls Spatio-Temporal Variation of Sandy Beach Community
Structure. PL o S One, 6(8). https://doi.org/10.1371/journal.pone.0023724

Link to Published Version: https://dx.doi.org/10.1371/journal.pone.0023724
Document Type: Published Version

USC Research Bank: https://research.usc.edu.au
research-repository@usc.edu.au
CC BY V4.0
Copyright © 2011 Ortega Cisneros et al. This is an open-access article distributed under the terms of the
Creative Commons Attribution License, which permits unrestricted use, distribution, and reproduction in any
medium, provided the original author and source are credited.
Downloaded On 2020/12/17 01:17:59 +1000

Please do not remove this page
Complex, Dynamic Combination of Physical, Chemical
and Nutritional Variables Controls Spatio-Temporal
Variation of Sandy Beach Community Structure
Kelly Ortega Cisneros1,2*, Albertus J. Smit2, Jürgen Laudien3, David S. Schoeman2,4
1 Leibnitz Center for Marine Tropical Ecology, Bremen, Germany, 2 School of Biological and Conservation Sciences, University of KwaZulu-Natal, Durban, South Africa,
3 Alfred Wegener Institute for Polar and Marine Research, Bremerhaven, Germany, 4 School of Environmental Science, University of Ulster, Coleraine, Northern Ireland

     Abstract
     Sandy beach ecological theory states that physical features of the beach control macrobenthic community structure on all
     but the most dissipative beaches. However, few studies have simultaneously evaluated the relative importance of physical,
     chemical and biological factors as potential explanatory variables for meso-scale spatio-temporal patterns of intertidal
     community structure in these systems. Here, we investigate macroinfaunal community structure of a micro-tidal sandy
     beach that is located on an oligotrophic subtropical coast and is influenced by seasonal estuarine input. We repeatedly
     sampled biological and environmental variables at a series of beach transects arranged at increasing distances from the
     estuary mouth. Sampling took place over a period of five months, corresponding with the transition between the dry and
     wet season. This allowed assessment of biological-physical relationships across chemical and nutritional gradients
     associated with a range of estuarine inputs. Physical, chemical, and biological response variables, as well as measures of
     community structure, showed significant spatio-temporal patterns. In general, bivariate relationships between biological
     and environmental variables were rare and weak. However, multivariate correlation approaches identified a variety of
     environmental variables (i.e., sampling session, the C:N ratio of particulate organic matter, dissolved inorganic nutrient
     concentrations, various size fractions of photopigment concentrations, salinity and, to a lesser extent, beach width and
     sediment kurtosis) that either alone or combined provided significant explanatory power for spatio-temporal patterns of
     macroinfaunal community structure. Overall, these results showed that the macrobenthic community on Mtunzini Beach
     was not structured primarily by physical factors, but instead by a complex and dynamic blend of nutritional, chemical and
     physical drivers. This emphasises the need to recognise ocean-exposed sandy beaches as functional ecosystems in their
     own right.

  Citation: Ortega Cisneros K, Smit AJ, Laudien J, Schoeman DS (2011) Complex, Dynamic Combination of Physical, Chemical and Nutritional Variables Controls
  Spatio-Temporal Variation of Sandy Beach Community Structure. PLoS ONE 6(8): e23724. doi:10.1371/journal.pone.0023724
  Editor: Simon Thrush, National Institute of Water & Atmospheric Research, New Zealand
  Received May 4, 2011; Accepted July 22, 2011; Published August 17, 2011
  Copyright: ß 2011 Ortega Cisneros et al. This is an open-access article distributed under the terms of the Creative Commons Attribution License, which permits
  unrestricted use, distribution, and reproduction in any medium, provided the original author and source are credited.
  Funding: This study was financed within the framework of the NRF-IRDP project (KZN Coastal Trophic Flows, ICD2006072700035). Additional financial support
  was provided by a DAAD (Deutscher Akademischer Austausch Dienst) scholarship to KOC, a Royal Society grant to DSS. The funders had no role in study design,
  data collection and analysis, decision to publish, or preparation of the manuscript.
  Competing Interests: The authors have declared that no competing interests exist.
  * E-mail: kortegac@gmail.com

Introduction                                                                         have adverse effects on local ecology [16–18], and should further
                                                                                     minimise the influence of ecological interactions [13]. Under such
   In most ecological systems, including those of the oceans,                        circumstances, greatest abundance and diversity of resident
community structure emerges from a complex interplay between                         macroinfauna would be expected on fine-sand, dissipative beaches
biotic interactions and abiotic environmental factors [1–6]. An                      [19], while coarse-sand, reflective beaches should harbour small
exception to this apparent rule seems to be ocean-exposed sandy                      populations of only a few species [20].
beaches. These systems are highly dynamic in space and time, and                        On the other hand, much of the evidence for physical control
as a result, are traditionally referred to as ‘‘physically stressed’’ [7],           comes from studies that measured only physical beach features
in the sense that individual resident macrobenthic species appear                    [8,20,21]; characteristics such as primary productivity and food
to respond independently to physical features of the environment,                    availability have been largely ignored, or considered as being
with the influence of biotic interactions being negligible [8].                      subsumed within sampling designs. Among the few studies that
Although evidence to the contrary is slowly accumulating [9–12],                     have assessed chemical variables, salinity has been the most
the role of biotic interactions in structuring the macrobenthic                      prominent and most influential in community structure [22].
communities of intertidal beaches is still considered trivial in all                 Despite the importance of biological interactions (including food
but the least disturbed and lowest energy systems [13].                              availability) as a factor controlling the structure and dynamics of
   Anthropogenic influence is nowadays ubiquitous in marine                          benthic communities in general [6,23–27], as well as those of other
communities [14]. Of particular concern for beaches is the rate of                   soft-sediment shores [2,3,28,29], few studies of beach community
coastal urbanisation [15], which brings with it extensive coastal                    ecology have taken this into account [30–32]. It is therefore
armouring as well as additional elements of disturbance. These all                   evident that broader consideration of the roles of a range of

       PLoS ONE | www.plosone.org                                                1                               August 2011 | Volume 6 | Issue 8 | e23724
Complex Control of Sandy Beach Community Structure
potential structuring processes should enhance understanding of seston and nekton are exported to coastal waters and adjacent
the ways in which sandy beach macrobenthic communities are systems, including sandy beaches [47]. Due to this cycle, estuarine
structured. input to Mtunzini Beach should be minimal toward the end of a
Opportunities to investigate the relative roles of physical, dry season, with any depression in salinity or elevation in nutrient
chemical and nutritional gradients in structuring intertidal beach concentrations and associated surf-zone plankton productivity
macrobenthic communities arise around estuary mouths. Because being limited to the immediate vicinity of the estuary mouth. If the
intertidal sandy beaches are devoid of biogenic structure and beach macroinfauna are sensitive to estuarine inputs, there might
support little primary production [33], they depend heavily on be aggregation at (or avoidance of) areas immediately adjacent to
allochthonous subsidies. In this sense, adjacent ecosystems, such as the estuary mouth, with the communities beyond the reach of
estuaries, can provide significant inputs of both inorganic nutrients these putative gradients distributed along the shore according to
to the surf zone and particulate organic matter to the intertidal physical conditions, with higher macrofaunal abundance and
zone [34]. Moreover, estuaries mediate strong salinity gradients, diversity on sections of the beach with fine sand and wide intertidal
which have been demonstrated to have a detrimental influence on zones. By contrast, as rainfall increases and the river starts to fill,
population and community attributes of sandy beach assemblages estuarine input to the surf zone should increase and any resulting
[22,35–37]. Unfortunately, however, few integrated attempts have effect should spread along the shore. Any corresponding response
been made to include a wide range of physical, chemical and by the macroinfaunal communities is likely to be detectable as
nutritional variables as potential explanatory variables for patterns consistent relationships with chemical or nutritional variables and
of intertidal community structure at the meso-scale. Here, we would provide evidence that responses to other variables can
report on a study that takes advantage of the strong seasonal override the effect of physical beach descriptors.
changes in estuarine flow of the Mlalazi Estuary on the KwaZulu- By sampling an along-shore grid of stations on Mtunzini Beach
Natal (KZN) coast of South Africa to investigate macrobenthic at three discrete times that correspond to the end of the dry season,
community structure at Mtunzini Beach in the presence and the start of the rainy season and the late rainy season, this study
absence of various gradients associated with estuarine inputs. aims to determine whether the beach community responds
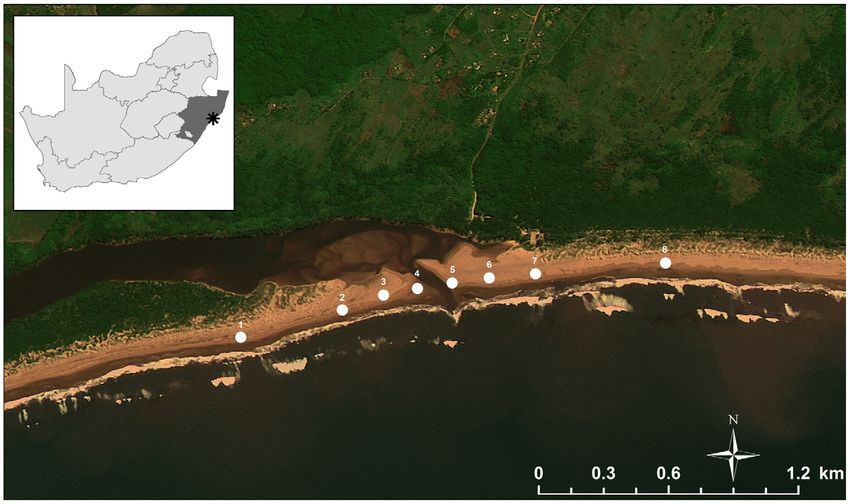
KZN, on the east coast of South Africa (Fig. 1), experiences overwhelmingly to the physical environment or if other factors
marked seasonal cycles in rainfall, resulting in strong temporal are influential. To address this aim, the objectives are: (1) to
patterns of river flow to the extent that many estuaries in this determine if alongshore patterns for physical, chemical and
region are isolated from the sea for much of the dry winter season nutritional features of the beach vary through time; (2) to
by sandbars that block their mouths [38–40]. Because KZN determine whether alongshore patterns in intertidal macrobenthic
marine waters are reasonably oligotrophic [41], seasonal freshwa- community structure vary through time; and (3) to determine,
ter inflow represents the main source of nutrients for estuarine which physical, chemical and nutritional variables are most
food webs [42–46]. During the rainy season, estuarine flow influential in describing changes in macrobenthic community
increases in volume; consequently, larger proportions of estuarine structure.
Figure 1. Map of the study area, indicating the position of the sample stations relative to the Mlalazi estuary. Numerals indicate
station numbers (Station 1 is in the far south; Station 8 is in the far north).
doi:10.1371/journal.pone.0023724.g001
PLoS ONE | www.plosone.org 2 August 2011 | Volume 6 | Issue 8 | e23724Complex Control of Sandy Beach Community Structure
Methods samples were cooled on ice and stored in the dark for a maximum
of two hours before further processing. For the determination of
The Mlalazi Estuary (28u589S; 31u489E, eastern coast of South size-fractioned photopigment concentrations, the samples were
Africa, Fig. 1) is a permanently open estuary with its mouth closing serially filtered (vacuum, ,50 kPa) through 20-mm Nitex mesh (for
only during major droughts. The catchment of approximately microplankton photopigments), 2-mm membrane filters (for
492 km2 [48] is subject to high rainfall of about 1250 mm.yr21, nanoplankton photopigments), and 0.72-mm GF/F filters (for
peaking in austral summer (December–February). The estuary picoplankton photopigments), and then extracted in 90% acetone
length extends from about 11 km in the dry season to 7 km during for 24 hrs in the dark at 4uC. Photopigment concentrations were
the rainy season [49]. The microtidal Mtunzini Beach (maximum determined using a Turner Trilogy fluorometer (Sunnyvale,
tidal range is 2.13 m) borders the estuary and stretches about 5 km California, US) before and after acidification with two drops of
both north and south of the estuary mouth. Nel and Bezuidenhout 1% HCl [56].
[50] classified the grain size of Mtunzini Beach as medium-coarse Corresponding 1-l water samples for the determination of Total
and documented a well-sorted sediment and an intermediate- Suspended Solids (TSS) and Particulate Organic Matter (POM)
reflective beach morphodynamic state. were collected in plastic bottles at each station, and were treated
Biological samples and environmental data were collected identically to the photopigment samples prior to processing. In the
bimonthly between October 2008 and February 2009 (three laboratory, the water was filtered (vacuum, ,50 kPa) through pre-
sessions). Sampling was conducted around low tide within four combusted and pre-weighed GF/F filters. The filters were then
days of a spring tide. Sampling stations were arranged symmet- dried at 60uC for 24 hrs, reweighed and the amount of TSS
rically around the mouth of the Mlalazi Estuary, with four stations determined by mass difference. Additionally, POM determinations
to the north and four to the south (Fig. 1). In each direction, were made from these filters after combusting them at 450uC for
stations were positioned at 25 m, 150 m, 400 m, and 900 m from 12 hrs before reweighing. POM was estimated by mass difference
the mouth. before and after combustion.
For the determination of Particulate Organic Carbon (POC),
Ethics statement Particulate Organic Nitrogen (PON) and C:N ratio, water samples
A sampling permit for scientific investigation was issued to the were collected, stored and processed as described above for TSS
School of Biological and Conservation Sciences, University of determinations. GF/F filters, on which POM had been collected
KwaZulu-Natal, by the Department of Environmental Affairs and were acidified with 2N HCl and again dried at 60uC for 24 hrs.
Tourism, Republic of South Africa. Permit reference numbers were POC and PON were determined using a Flash EA 1112 series
V1/1/5/1 and RES2008/14 for 2008 and 2009, respectively. elemental analyzer (Thermo Finnigan, Milan, Italy). Results were
expressed as percentages of carbon and nitrogen.
Sampling design for macrobenthos For the quantification of Dissolved Inorganic Nitrogen (DIN:
At each station, biological sampling consisted of triplicate shore- nitrate+nitrite) and Dissolved Inorganic Phosphorus (DIP: ortho-
normal transects at 10-m intervals alongshore. Each transect was phosphate) concentrations, 50 ml of water filtrate from the
sampled at ten across-shore sampling levels, arranged at uniform photopigment determination (after filtering through GF/F filters)
intervals between the drift line and the spring low-water mark. At were collected in acid-washed bottles and frozen at 220uC.
each across-shore level, four sediment samples including macro- Nutrient concentrations were determined using a Skalar San++
infauna were excavated using a stainless steel corer of 18-cm continuous-flow analyser (Skalar Analytica BV, The Netherlands),
diameter (surface area of 0.0254 m2) inserted to a depth of about following the methods of Mostert [57]. Salinity measurements
30 cm. These four samples were pooled and washed through a 1- were determined from the resulting filtrate in the laboratory using
mm nylon-mesh sieving bag in the swash zone to remove excess a hand-held refractometer (ATAGO, Japan).
sand. All materials remaining in the sieve bag were stored in Sediment samples for the determination of the granulometric
labelled, sealed polyethylene bags, frozen on return to the measures and Sediment Organic Matter (SOM) content were
laboratory and stored at 220uC until analysis [51,52]. This field taken using a sediment core (internal diameter of 2 cm) to 10-cm
sampling design largely conforms to recommendations by depth at each shore level and station. To determine SOM, 5 g of
Schlacher et al. [53] and represents a sampling effort of 3.05 m2 oven-dried (60uC for 24 hrs) sediment was weighed and
per station and session. Although this sampling effort was smaller combusted at 450uC for six hours before reweighing. Organic
than that recommended by Schoeman et al. [54,55], our aim was matter content was determined as the difference in sediment
to assess spatial and temporal trends in community structure on masses. At each station, SOM content was determined as the
the basis of the most common species, rather than to accurately mean value of the ten samples collected. For grain size analysis, the
estimate macroinfaunal species richness or abundance. In this remaining dried sand was passed through nested sieves with a
sense, the ability to sample more stations compensates for the standard range of w intervals [58], and conventional statistics
slight loss in accuracy and precision of biotic measures at derived [59].
individual stations caused by smaller-than-ideal sample sizes.
Macrobenthic community analysis
Sampling design for environmental variables After defrosting the material collected from the sieved
For the measurement of physico-chemical variables (Table S1), macrofauna cores, organisms were separated from the remaining
triplicate water samples were collected below the water surface (ca. sediment by manual elutriation: the sample was placed in a 25-l
5–10-cm depth) in the swash zone of the eight sandy beach plastic bucket containing 10 l of distilled water, and stirred
stations, and in the mouth of the estuary during each session. vigorously; thereafter, the water was poured through a 1-mm mesh
Separate triplicate samples were taken for the determination of size sieve. This procedure was repeated five times. Govender [60]
photopigment concentrations, organic matter content and dis- determined that three to four repetitions of elutriation are required
solved inorganic nutrient concentrations. to extract 95% of all macrofaunal organisms from sediment
For photopigment concentrations, 250-ml water samples were samples taken at nearby KZN beaches, and that five repetitions
collected in acid-washed plastic bottles from each station. These almost always extract all such organisms. Following elutriation, the
PLoS ONE | www.plosone.org 3 August 2011 | Volume 6 | Issue 8 | e23724Complex Control of Sandy Beach Community Structure
remaining sediment was searched manually for large, heavy- be treated as continuous variables in this context). The procedure
bodied organisms, such as clams and whelks. Specimens were was then rerun without either session or side to assess whether
identified to the lowest taxonomic level possible and enumerated. some suite of other environmental variables might provide a
solution to explain similar amounts of the variance.
Data analysis In multivariate analysis (Bioenv), we are aware of no criteria
Granulometric parameters (mean grain size, sorting, kurtosis that penalize improvement in fit relative to the number of
and skewness) were estimated with the software GRADISTAT parameters (as would be done in a more conventional model fitting
Version 4.0 [61]. Beach morphodynamic state was classified by the Akaike Information Criterion, for example). We therefore
according to Dean’s dimensionless fall velocity (V) [62,63]. Sand- set a simple a priori criterion for the ‘‘optimal’’ environmental
fall velocities were obtained from granulometric determinations; matrix for the Bioenv analysis as that with the smallest number of
wave height and period data were obtained from the WindGuru variables, which improves the correlation by at least 10% relative
website (http://www.windguru.cz, accessed on June 13th, 2009). to the strongest single-factor correlation. Although we acknowl-
Species abundance was estimated as the number of individuals edge that this criterion is arbitrary, we feel that beyond this point,
per strip transect (IST) [53,64,65]. Only beach-resident species each additional environmental variable adds relatively little to the
were considered, and because we intended to conduct a range of explanation of the ordination, and might potentially introduce
multivariate analyses, all species that occurred in fewer than five spurious correlations.
transects (out of a total of 72 transects) were excluded from the Because we conducted many statistical tests, the probability of
analysis, to reduce the number of zeros in the data matrix. Data falsely rejecting at least one null hypothesis (i.e., the probability of
were fourth-root transformed (to further equalize the contributions a false positive result) would be substantially larger than the
to community structure by common and rare species) before the conventionally chosen a-level of 0.05 [70]. Although the
construction of a Bray-Curtis similarity matrix [66] to represent sequential Bonferroni test is sometimes used to adjust inflated a-
resemblances in community structure among transects from each levels on a case-by-case basis, there are several mathematical,
station and session. logical and practical objections to its use [71,72]. We therefore
Inspection of correlograms of environmental variables revealed acknowledge that there is a strong possibility that some of our
significant positive skew in many variables as well as several hypothesis tests will falsely reject true null hypotheses and thus set
nonlinear relationships among variables. To ameliorate potential a to 0.01 to ameliorate this risk. While this concession appears
problems in subsequent analyses, all variables were transformed by arbitrary and will not eliminate false positives, it does provide a
their natural logarithm (ln(x+1)) to linearise relationships and to practical and consistent criterion for hypothesis tests and reduces
provide more symmetrical distributions. All physical variables the false positive rate by a factor of five.
were then converted to z-scores (i.e., scaled to a mean of zero and Data manipulation and most analyses were carried out in R
unit variance) to avoid scale dependence in subsequent analyses. [73]; PERMANOVA and verification of multivariate analyses
Potential collinearity among environmental variables was explored were conducted using PRIMER 6 [74].
by inspecting the correlogram of the transformed data and by
calculating condition indices of the principal components of the Results
correlation matrix, as recommended by Quinn and Keough [67].
Hypotheses regarding spatio-temporal relationships were tested Physical environment
using Pearson correlation, while those concerning patterns were The environment along Mtunzini Beach, as described by beach
tested using PERMANOVA, as described by Anderson et al. [68]. morphodynamics and sediment characteristics, varied substantially
In the latter case, session, side (north/south of the estuary mouth) in space and time (Fig. 2; Table 1, 2). The intertidal beach face
and station (nested within side) were considered to be fixed factors. fluctuated in width between 45 m and 90 m, being significantly
Following each PERMANOVA, post-hoc tests were used to further (p,0.01) wider in October 2008 than in subsequent sessions
explore significant interactions or main effects, using Monte Carlo (Fig. 2A; Table 1). Mean particle size showed that the sediment of
approximate p-values [68] where insufficient unique permutations Mtunzini Beach is coarse, moderately well sorted sand. Spatially,
existed for meaningful tests. Where multivariate hypotheses were sediments were finer and better sorted south of the estuary than to
tested, non-Metric Multidimensional Scaling (nMDS) was used to the north, especially during February 2009 (Fig. 2F–I; Table 1, 2).
illustrate relationships among samples [66]. Temporally, sediments during October 2008 were coarser and
Because environmental data were collected on a per-station more coarse skewed than during other sessions, although skewness
basis, rather than on a per-transect basis, all assessments of decreased with distance from the estuary mouth (Fig. 2F–I;
relationships between physico-chemical variables and community Table 1, 2). According to Dean’s dimensionless fall velocity (DFV),
structure were made on per-station basis. To determine the set of Mtunzini Beach was intermediate (mean V = 3.75), with no spatial
physical variables that best described the observed spatio-temporal or temporal patterns in morphodynamic state, besides a tendency
structure in the community data, the Envfit and Bioenv functions for the beach to be more reflective during October 2008 than
of the Vegan package in R were used [69]. The Envfit function fits during the other sessions (Fig. 2B; Table 1).
individual environmental variables onto a given nMDS ordination
of biotic variables in such a way as to maximize the correlation Chemical environment
between the two data sources. By contrast, the Bioenv function Monthly rainfall varied from 45.4 mm in December 2008 to
investigates different combinations of environmental variables in 184.5 mm in February 2009 (Fig. S1). Instead of increasing
an attempt to identify that subset for which the Euclidean distance gradually through the study period, as one may predict, monthly
resemblance matrix provides the maximum Spearman correlation rainfall was relatively uniform from October to December 2008,
with the Bray-Curtis community resemblance matrix. For the with an increase in January 2009. Salinity measurements matched
Envfit analyses, session and side were treated as factors (categorical this pattern (Fig. 2C; Table 1), being similar during October and
variables) and the remaining variables as vectors (continuous December 2008, when they were uniform alongshore, but salinity
variables). For the Bioenv analysis, we initially considered all fell significantly in February 2009 (Fig. 2C; Table 1). During this
environmental variables, including session and side (which had to final session, salinity was significantly lower south of the estuary
PLoS ONE | www.plosone.org 4 August 2011 | Volume 6 | Issue 8 | e23724Complex Control of Sandy Beach Community Structure
Figure 2. Plots of physical variables collected at the sample stations on Mtunzini Beach. All data are log-transformed and standardized to
a mean of zero and SD of 1. Samples from October 2008 are indicated with white circles, those from December 2008 with grey circles and those from
February 2009 with black circles. Error bars are standard deviations. For clarity, the x-axes are not plotted to scale. Negative distances are stations to
the south of the estuarine mouth. Mean and standard deviation of untransformed data are: (A) Beach width (67.44614.71 m), (B) DFV (3.6960.52), (C)
Salinity (33.2565.89), (D) TSS (52.92619.02 mg.l21), (E) OM (42.97617.23 mg.l21), (F) Sand Particle Size (428.686101.32 mm), (G) Sand Skewness
(1.6660.71), (H) Sand Kurtosis (8.2964.31), (I) Sand Sorting (218.44692.32), (J) SOM (1.2961.05%), (K) DIN (0.6260.65 mM), (L) DIP (0.961.21 mM), (M)
PON (5.4762.72%), (N) POC (45.79624.11%), (O) C:N (8.4462.27), (P) Total Photopigment concentrations (3.5261.10 mg.l21), (Q) Microplankton
Photopigment concentrations (1.0860.62 mg.l21), (R) Nanoplankton Photopigment concentrations (1.9560.87 mg.l21), (S) Picoplankton Photopig-
ment concentrations (0.5460.31 mg.l21).
doi:10.1371/journal.pone.0023724.g002
than to the north, and was lowest in the estuary mouth (Fig. 2C). recorded in the estuary mouth, and additional complexities were
Spatio-temporal patterns in DIN and DIP concentrations reflected evident. Nevertheless, DIN and DIP concentrations tended to be
those in salinity, tending to be high where salinity was low (Fig. 2K, higher during the latter sessions of the study, and this effect was
L; Fig. S1; Table 1). However, maximum concentrations were not more marked to the south of the estuary than to the north.
PLoS ONE | www.plosone.org 5 August 2011 | Volume 6 | Issue 8 | e23724Complex Control of Sandy Beach Community Structure
Table 1. Significant sources of variation in univariate descriptors of the environment on Mtunzini Beach.
Category Type Variable Sources of variation
Physical Morphodynamic Beach width Se
DFV Se
Physical Sediment Sand particle size Se, Si
characteristics Sediment skewness Se
Sediment kurtosis Se
Sediment sorting Si
Chemical Water chemistry Salinity Se6Si, Se
Chemical Nutrients DIN concentration Se6Si, Se, Si
DIP concentration Se6St (Si), Se6Si, St (Si), Se, Si
Nutritional Photopigments concentrations Micoplankton photopigment concentration Se6St (Si), Se6Si, St(Si), Se, Si
Nanoplankton photopigment concentration Se6St (Si), Se6Si
Picoplankton photopigment concentration None
Total photopigment concentration Se6St(Si), Se6Si, St(Si), Se
Nutritional Organic content SOM None
POM None
POC Se6St (Si), Se6Si, Se, Si
PON Se6St(Si), Se6Si, Se, Si
C:N Se, Si
TSS None
Significant (p#0.01) results as identified by two-way fixed-effects PERMANOVA (Table S2). Abbreviations are as follows: Se = session; Si = side; St(Si) = station nested
within side; and St = station (only for variables that were estimated without replication at the station level).
doi:10.1371/journal.pone.0023724.t001
POC and PON concentrations exhibited very similar patterns north concentration gradients in both POC and PON during
and varied strongly between sides and sessions (Fig. 2M, N; December 2008, but a decreasing gradient in POC concentration
Table 1). Concentrations of both differed significantly by session to during February 2009 (Table 2).
the south of the estuary, with values increasing steadily through the C:N ratios were slightly lower to the south of the estuary than to
sample period. To the north of the estuary the trend reversed, with the north, and were similar in October and December 2008, but
both POC and PON concentrations significantly lower during were significantly higher in February 2009 (Fig. 2O; Table 1). In
February 2009 than during preceding sessions. This resulted in October and December 2008, values measured in the estuary were
reversing spatial gradients along the beach, with increasing south- among the highest along the beach, whereas in February 2009,
Table 2. Spatial trends in biotic and abiotic variables along Mtunzini beach during the study period.
Variable Session Trend r df P
Sand particle size February 2009 S-N 0.30 72 8.8561023
Sand skewness October 2008 Away from mouth 0.30 77 6.8861023
Sand sorting February 2009 S-N 0.36 72 1.5661023
Sand sorting All S-N 0.22 222 8.3861024
POC December 2008 S-N 0.58 21 3.4061023
POC February 2009 S-N 20.55 22 5.8461023
PON December 2008 S-N 0.61 21 1.9361023
C:N February 2009 Away from mouth 20.52 22 9.1561023
Micro pigment December 2008 S-N 0.69 21 2.4061024
Nano pigment December 2008 S-N 0.78 21 5.0561026
Total pigment December 2008 S-N 0.85 21 2.0061027
Species richness February 2009 S-N 0.60 22 2.0961023
Pearson correlations against distance from south-most station (Trend = S-N) or absolute distance from estuary mouth (Trend = Away from mouth). Tests were run on
data from individual sessions, and for all sessions combined. Only significant (p#0.01) results are tabulated. Descriptions of variables and their abbreviations are listed in
Table S1.
doi:10.1371/journal.pone.0023724.t002
PLoS ONE | www.plosone.org 6 August 2011 | Volume 6 | Issue 8 | e23724Complex Control of Sandy Beach Community Structure
estuarine values were lowest (Fig. 2O). Despite this, C:N ratios at PON and POC (r = 0.94), and OM and TSS (r = 0.89). This was
beach stations decreased with distance from the estuary during confirmed by analysis of the condition indices of the principal
February 2009 (Fig. 2O; Table 2). components of the correlation matrix, of which only two were
The average concentrations of photopigments in the nano- .30. Because the number of potentially collinear explanatory
plankton size range were almost twice those of the microplankton variables was small, we did not exclude any of them from
fraction, which in turn were twice those of in the picoplankton subsequent analyses, but exercised appropriate care when
fraction (Fig. 2). Photopigment concentrations in the microplank- interpreting results.
ton fraction decreased significantly through the study period on
both sides of the estuary mouth (Fig. 2Q; Table 1, 2). Macroinfaunal community structure
Corresponding patterns for the nanoplankton fraction were less Trends in univariate measures of community structure were
clear, and no trends were found for the picoplankton fraction; as a similar irrespective of whether they were viewed on a per-transect
result, temporal patterns for total photopigment concentrations or per-station basis (Fig. 3). PERMANOVA and correlation
were inconsistent through time (Fig. 2R, S; Table 1). During analysis suggest that macroinfaunal abundance was lowest during
December 2008, both microplankton and nanoplankton photo- October 2008, when both abundance and species richness were
pigment concentrations increased from south to north across the higher to the south of the estuary than to the north (Fig. 3;
beach, a pattern reflected by total photopigment concentrations Table 2). By December 2008, these patterns had broken down,
(Fig. 2P–R; Table 1, 2). In February 2009, this gradient broke and by February 2009, very high numbers of recruiting mole crabs
down, but microplankton photopigment concentrations remained (Emerita austroafricana) and surf clams (Donax madagascariensis)
lower to the south of the estuary than to the north. Interestingly, immediately north of the estuary resulted in higher macroinfaunal
the highest nanoplankton photopigment concentrations were abundance on the northern side of the beach than to the south.
recorded in the estuary mouth during February 2009. The spatio-temporal patterns in univariate community data
Neither TSS nor POM concentrations exhibited any significant were reflected in the multivariate community structure (Bray-
spatio-temporal variation (Fig. 2D, E; Table 1). Concentrations of Curtis resemblance on fourth-root transformed abundance data).
SOM were similarly devoid of clear patterns (Fig. 2J; Table 1). The nMDS biplot (Fig. 4A) illustrates changes in the arrangement
The correlogram of the scaled, transformed environmental of the community structure on Mtunzini Beach from October
variables (Fig. S2), indicated few potentially collinear environ- 2008 to February 2009, with samples from December 2008
mental variables besides sand grain size and DFV (r = 20.94), showing an intermediate position on the ordination between those
Figure 3. Plots of univariate measures of community structure per transect (A, C; mean ± SD) and aggregated by station (B, D).
Samples from October 2008 are indicated with white circles, those from December 2008 with grey circles and those from February 2009 with black
circles.
doi:10.1371/journal.pone.0023724.g003
PLoS ONE | www.plosone.org 7 August 2011 | Volume 6 | Issue 8 | e23724Complex Control of Sandy Beach Community Structure
Figure 4. nMDS ordination of species abundance per transect (A) and aggregated by station (B), fourth-root-transformed using
Bray-Curtis resemblance. Numerals indicate station numbers (Station 1 is in the far south; Station 8 is in the far north, as per Fig. 1); colors indicate
session (white = October 2008; grey = December 2008; black = February 2009); and symbols indicate side of beach relative to the estuary mouth
(square = south; circle = north). Stress = 0.25.
doi:10.1371/journal.pone.0023724.g004
of the first and the last sessions. The stress value for the two- community structure was found to differ significantly only between
dimensional ordination was relatively high at 0.25, but the October 2008 and February 2009 (the p-value for the pair-wise test
significant side6session interaction detected by PERMANOVA on differences in community structure between December 2008
on these multivariate data (Table 3) nevertheless reveals significant and February 2009 was 0.019; although we considered this non
spatio-temporal patterns. Specifically, although the community significant due to our adjustment in a to account for multiple
structure to the south of the estuary did not differ significantly hypothesis tests, this value is nevertheless low, considering the
between October and December 2008, all other pair-wise reduced power of this test).
comparisons were significant. Similarly, the community structure
to the north of the estuary differed significantly between all Correlations between community structure and
sessions. The strongest (and only significant) north-south difference environmental variables
in community structure was detected in February 2009. Together,
Correlations between univariate measures of community
these results mirror the univariate analysis in suggesting a graded
structure and the physical beach environment did not reveal any
change in community structure through time, with strongest
significant relationships when data from all sessions were
spatial patterns in February 2009.
considered simultaneously. The strongest (non-significant) rela-
When pooling the samples by station (to accommodate
tionships in this context were between species richness and
comparison with environmental data, which were not measured
picoplankton photopigment concentrations (r = 0.49, df = 22,
at a per-transect resolution), replication and therefore power are
p = 1.3961022) and between macroinfaunal abundance and the
lost from the PERMANOVA. Nevertheless, the nMDS ordination
C:N ratio (r = 0.50, df = 22, p = 2.0561022). Neither of these
of this modified data set (Fig. 4B) broadly reflected that
relationships were significant for individual sessions; nor were any
constructed on data from individual transects (Fig. 4A). The
of the observed relationships consistent across sessions. During
corresponding PERMANOVA (Table 3) detected a significant
October 2008, macroinfaunal abundance was inversely correlated
main effect of session, although due to reduced power, the
with POC (r = 20.90, df = 6, p = 2.0561023) and PON concen-
trations (r = 20.88, df = 6, p = 3.6061023). During December
Table 3. Significant sources of variation in univariate and 2008, there were no significant relationships and, during February
multivariate measures of community structure. 2009, species richness and abundance were positively correlated
with salinity (r = 0.87, df = 6, p = 4.8361023) and C:N (r = 0.85,
df = 6, p = 8.2861023), respectively.
Type Response variable Sources of variation Inspecting the explanatory power of individual environmental
Univariate Species richness Se6Si, Se variables, the Envfit routine identified four environmental vectors
Macrofaunal abundance Se6St (Si), Se6Si, Se, Si
and one environmental factor as significant (Table 4). Salinity
provided the strongest correlation, followed by DIP concentration,
Multivariate Bray-Curtis resemblance by transect Se6St (Si), Se6Si, Se, Si
C:N ratio and microplankton photopigment concentration.
Bray-Curtis resemblance by station Se Session was the significant environmental factor.
Significant (p#0.01) results as identified by two-way fixed-effects PERMANOVA
When using the function Bioenv to seek matrices of environ-
(Table S3). Abbreviations as per Table 1. mental variables that best correlate with the biotic ordination,
doi:10.1371/journal.pone.0023724.t003 correlations tended to increase with increasing numbers of
PLoS ONE | www.plosone.org 8 August 2011 | Volume 6 | Issue 8 | e23724Complex Control of Sandy Beach Community Structure
Table 4. Fits of environmental vectors and factors to the lowest and spatial patterns in community structure were
biotic ordination of macroinfaunal community structure. strongest.
Using 2-dimensional thin-plate splines fitted by General
Additive Modeling, we overlaid the distribution of these selected
Variable Correlation (r) p environmental variables on the biotic ordinations (Fig. 5A–H).
The results provide evidence that most of the influential
Vector
environmental variables are non-linearly distributed across the
Salinity 0.738 3.461024 biotic ordination. They also demonstrate that the variables
DIP 0.737 3.661024 selected first by the Bioenv routine explain outliers in the biotic
C:N 0.719 4.861024 ordination, and then more general patterns. For example,
Microplankton photopigments 0.600 9.761023
picoplankton photopigment concentration (the first variable
selected by Bioenv) was unusually high at Station 6 in December
Factor
2008 (Fig. 2S) and the C:N ratio (the second variable selected) was
Session 0.593 6.061024 especially high at Station 5 in February 2009 (Fig. 2O). Since
Environmental vectors are continuous variables and factors are discrete
corresponding community samples provided outliers in the biotic
variables. Correlations indicate the strength of the gradient in individual ordination, and the C:N ratio also provides some discrimination
environmental variables across the biotic ordination. Only significant (p#0.01) among sessions (especially separating samples from February 2009
results are tabulated. from those of other sessions), it is not surprising that these variables
doi:10.1371/journal.pone.0023724.t004
together provide an ordination that is fairly strongly correlated
(r = 0.371, Table 5) with the biotic ordination. DIP concentration
environmental variables (Table 5). When session and side were adds to the abiotic ordination’s ability to discriminate among all
included as explanatory variables, correlations peaked at seven sessions; it also highlights the differences between the northern and
variables (r = 0.495, this correlation before rounding was fraction- southern sides of the beach during February 2009, when salinities
ally higher than that for the six-variable ordination). When were lowest and biotic patterns were strongest. The remaining
excluding session and side, correlation peaked at six variables variables add slowly to an increasingly complex pattern.
(r = 0.475, Table 5). When considering the relative increase in Importantly, the nMDS biplots of both the optimal and the best
correlation with each additional variable (Table 5), the set of explanatory environmental matrices (omitting session) showed a
environmental variables identified as optimal by our a priori rule strong resemblance to that for the biotic variables (Fig. 5I, J).
includes only three variables, irrespective of whether we include Although sessions and sides were grouped in a very similar way in
session and side as variables (r = 0.443), or not (r = 0.440). both biotic and abiotic ordinations, individual stations were
Permutation tests reveal that all of the selected correlations are somewhat displaced relative to one another, reflecting the
significant (p,0.01). correlations of 0.440 and 0.475, respectively (Table 5).
To summarize, the most important variables explaining biotic
community structure are: session (identified by PERMANOVA, Discussion
Envfit and Bioenv); the C:N ratio (identified by Envfit and
Bioenv, and it also had the strongest, though non-significant, The concept of overriding physical control in harsh environments
correlation with macroinfaunal abundance over the study is one of three paradigms describing macro-scale community
period), picoplankton photopigment concentrations (identified patterns on exposed sandy beaches [75]. Biological factors
by Bioenv, and it also had the strongest, though non-significant, (including food availability, competition and predation), by contrast,
correlation with species richness over the study period), and DIP have been considered to play a role in structuring macrofaunal
concentration (identified by Envfit and Bioenv). To these, we can communities at the meso-scale only in physically benign habitats,
tentatively add salinity, which was identified as influential only by such as undisturbed dissipative beaches [13]. In this study, we aim to
Envfit, but did have strong correlations with macroinfaunal determine if the macroinfaunal community inhabiting a physically
abundance during February 2009, when salinity values were dynamic beach (intermediate morphodynamic type) really does
Table 5. Correlations between environmental and biotic ordinations for data from Mtunzini Beach.
Analyses including Side and Session as environmental variables Analyses excluding Side and Session as environmental variables
No. Variables r Variables r
1 Session 0.307 Pico pigments 0.251
2 Session, Pico pigments 0.411 C:N, Pico pigments 0.371
3 Session, C:N, Pico pigments 0.443 DIP, C:N, Pico pigments 0.440
4 Session, DIN, C:N, Pico pigments 0.463 Kurtosis, DIP, C:N, Pico pigments 0.456
5 Session, Beach width, DIN, C:N, Pico pigments 0.483 Beach width, DIN, DIP, C:N, Pico pigments 0.464
6 Session, Beach width, Kurtosis, DIN, C:N, Pico pigments 0.495 Beach width, Kurtosis, DIN, DIP, C:N, Pico pigments 0.475
7 Session, Beach width, Kurtosis, DIN, DIP, C:N, Pico 0.495 Beach width, Kurtosis, DIN, DIP, C:N, Pico pigment, Micro 0.457
pigments pigments
Correlations are listed with increasing numbers of variables. Left-hand panel includes factors session and side as variables, whereas the right-hand panel excludes them.
Combinations of variables that maximize the correlation between biotic and abiotic ordinations are in bold, while optimal combinations of variables are italicized.
Descriptions of variables and their abbreviations are listed in Table S1.
doi:10.1371/journal.pone.0023724.t005
PLoS ONE | www.plosone.org 9 August 2011 | Volume 6 | Issue 8 | e23724Complex Control of Sandy Beach Community Structure
Figure 5. Bray-Curtis ordination of fourth-root transformed biotic variables overlaid with 2-dimensional thin-plate splines fitted by
General Additive Modeling. A. Picoplankton photopigment concentrations. B. C:N ratio. C. DIP concentration. D. Sediment kurtosis. E. Beach
width. F. DIN concentration. G. Salinity. H. Microplankton photopigment concentrations. I. nMDS ordination of ‘‘optimal’’ set of environmental
variables. J. nMDS ordination of the set of environmental variables providing the best biotic-environmental correlation. A-F are the variables
identified by the Bioenv routine in order of importance (i.e. the order in which they were selected). G & H are variables selected by Envfit, but that
were not selected by Bioenv. I & J are Euclidean-distance nMDS ordinations of the matrices of environmental variables for the optimal and best
solutions identified by Bioenv.
doi:10.1371/journal.pone.0023724.g005
respond overwhelmingly to the physical environment at the meso- beach width [21] and morphodynamic state (DFV) [13], and to
scale, as predicted by theory. The study site, Mtunzini Beach, is decrease with sand particle size [20]. All of these physical variables
located on an oligotrophic, subtropical coast, and is bisected by the differed significantly between October 2008 and subsequent
Mlalazi Estuary, which is considered the main source of nutrient sessions, but none exhibited significant spatial trends during either
inputs for the beach and surf zone. Our univariate and multivariate October or December 2008. Although univariate measures of
analyses demonstrate significant spatio-temporal variation in the community structure were similarly devoid of spatial pattern
physical and chemical features of the beach-surf-zone system, and during December 2008, both macrofaunal abundance and species
also in its resident macroinfaunal community. If community richness were lower to the south of the estuary than to the north
structure on this beach were subject primarily to physical control, during October 2008, when both biotic variables attained their
we would expect variables associated with the physical beach minimum values and the beach was widest. This provides an initial
environment to consistently provide the best description of indication that even when risks of competition and predation are
macrofaunal distribution through time and space. most limited (i.e. when the densities of organisms are lowest)
In terms of the physical beach environment, macrobenthic [11,13,76], factors other than physical characteristics of the beach
abundance and species richness are expected to increase with can and do influence the spatial distribution of resident
PLoS ONE | www.plosone.org 10 August 2011 | Volume 6 | Issue 8 | e23724Complex Control of Sandy Beach Community Structure
communities. Further evidence against the paradigm of physical drivers of macroinfaunal community structure on Mtunzini
control at the meso-scale is provided by the results from February Beach.
2009. During this session, the finest and best sorted sediments were Using multivariate techniques to explore the covariation in
found to the south of the estuary, but contrary to expectation, ordinations of biotic and abiotic variables, the graded change in
macrofaunal abundance was higher to the north of the estuary, community structure between October 2008 and February 2009,
and there was also a south-north increase in species richness. Our and the increasing degree of spatial structure in February 2009
results therefore strongly suggest that physical factors are not were best explained by sample session, the C:N ratio of organic
adequate predictors of macroinfaunal abundance and species matter, picoplankton photopigment concentration and DIP
richness on Mtunzini Beach. concentration. Sample session probably explains variability in
In terms of the chemical and nutritional composition of the surf- community structure introduced by seasonal patterns such as
zone waters, significant spatio-temporal variations were observed recruitment dynamics. The other influential variables all describe
for most variables and, as predicted, most of these patterns were features of the surf zone that are linked with food availability,
associated with increased estuarine flow in February 2009. either realized (particulate organics of estuarine origin, and
Estuarine input can directly influence macrobenthic community picoplankton abundance) or potential (elevated inorganic nutrient
structure through two mechanisms. The first is a negative impact concentrations of estuarine origin). Although we tentatively
of low salinity on alongshore distribution patterns, abundance, identified salinity as an additional influential variable, it is likely
biomass and life-history traits of sandy beach organisms [35–37]. that most of its explanatory power derives from its strongly
The second is an increase in food resources, either through seasonal temporal pattern, which is already accounted for by
increased surf-zone primary production resulting from elevated sample session. Irrespective of the mechanisms by which the most
concentrations of dissolved inorganic nutrients [34,77], or through influential variables structure the macrobenthic community of
increased inputs of particulate organic matter [34]. During our Mtunzini Beach, none of these variables describe physical aspects
study, salinity showed no along-shore pattern during the dry of the beach face. Even when increasing the number of
season (October and December 2008), but was lower to the south explanatory variables beyond the ‘‘optimal’’ set to include all of
of the estuary than to the north during the rainy season (February those identified as contributing to the maximum correlation with
2009), when salinity values were lowest overall. As anticipated, the biotic ordination, beach width and sediment kurtosis are the
estuarine input to the surf zone strongly influenced patterns in the only physical variables added. While macroinfaunal abundance
concentrations of dissolved inorganic nutrients (DIN and DIP). and diversity are predicted to increase with beach width [21], the
However, although surf-zone phytoplankton was dominated by opposite appears to have occurred here, with lower abundance
nanoplankton (measured by photopigment concentrations), as is and fewer species present on the beach during October 2008,
common in these waters [78–80], elevated nutrient concentrations when the beach was widest. It is difficult to envisage a mechanism
in the surf-zone did not boost phytoplankton concentrations. This by which sediment kurtosis could influence community structure
suggests either that the residence time of DIN and DIP in the surf- on beaches; it is therefore not surprising that kurtosis has not
zone is too short to allow phytoplankton to fully respond, or that previously been identified as being important in this role. Results
the reduced salinity inhibited surf-zone productivity [81,82]. of multivariate analyses therefore support those of univariate
Concentrations of particulate organic material were measured in analyses in contradicting the paradigm of physical control of
our study by SOM and by swash-zone TSS, POM, POC and community structure on Mtunzini Beach.
PON, with the C:N ratio providing an indication of the The present results do not contest the fact that patterns in
provenance of organic matter [83]. Of these variables, POM, physical processes explain significant amounts of variability in
TSS and SOM failed to show significant spatio-temporal patterns macroinfaunal species richness and abundance among geographic
and were unrelated to salinity or inorganic nutrient concentra- regions at macro-ecological scales [13,20,21]. They do, neverthe-
tions. This suggests that estuarine inputs of these materials are less, demonstrate that over smaller spatial scales, other processes
unlikely to directly control community structure on Mtunzini are capable of driving the spatio-temporal distribution patterns of
Beach. PON and POC patterns provided more contrast, and beach macroinfauna, even on physically dynamic beaches. This
peaked to the south of the estuary during February 2009, emphasises the fact that beaches are functional ecosystems [53,84]
corresponding with the presence of a plume of low-salinity that have more in common with other coastal soft-sediment
estuarine water (although to the north of the estuary, both systems than is generally appreciated. This is important for many
variables were at their lowest during this session). C:N ratios also reasons, not least because beaches are increasingly threatened by
reflect a trend of increasing estuarine provenance of swash-zone accelerating coastal squeeze that is driven by climate change and
organics throughout the study period, and in February 2009, when coastal urbanisation [85,86]. The paradigm of physical control has
the C:N ratio was highest, there was a strong gradient of encouraged coastal managers to consider the ecology of beaches
decreasing C:N ratio away from the estuary mouth reinforcing the subordinate to their sedimentary regime, but here we show that
notion that particulate organics were of estuarine rather than the ecology of individual beaches is considerably more complex.
marine origin (although again, we could not account for the low The challenge ahead lies in further exploring this complexity and
C:N measured in the estuary mouth). Despite these anomalies, on in using resultant knowledge to ensure the persistence of beaches
a per-session basis, relationships between univariate measures of as ecosystems within the broader coastal zone.
macroinfaunal community structure and descriptors of the
chemical composition of the surf-zone waters were consistently Supporting Information
stronger than those with physical beach variables. Further, when
Figure S1 Plot of rainfall data in the catchment of the
considering all data from the study simultaneously, the strongest
Mlalazi Estuary. Data corresponds to station 478, Empangeni -
(although not significant at a = 0.01) biotic-abiotic relationships
South African Sugarcane Research Institute (SASRI).
were trends of increasing species richness with picoplankton
(TIF)
photopigment concentrations and of increasing macroinfaunal
abundance with C:N ratio. Together, these results confirm that Figure S2 Correlogram illustrating the relationships
physical features of the beach face are not the most influential among environmental variables. Variables are arranged
PLoS ONE | www.plosone.org 11 August 2011 | Volume 6 | Issue 8 | e23724Complex Control of Sandy Beach Community Structure
according to the strength of relationships expressed in a Table S3 Two-way fixed-effects PERMANOVA on univar-
corresponding PCA of all variables. Upper triangular panel iate and multivariate measures of community structure.
contains pair-wise scatter plots for variables. Lower triangular (DOCX)
panel contains concentration ellipses (1 SD, mean centered) for the
bivariate data, with loess-smoothed curves of the relationships. Acknowledgments
Straight lines and narrow, diagonal ellipses indicate potential
Thanks to Ezemvelo KwaZulu-Natal Wildlife for help with logistics during
collinearities.
the fieldwork, in particular to Callum Beatie and Santosh Bachoo. Special
(TIF) thanks to Linda Harris, Natasha Govender, Troy Inman and other field
Table S1 List of the environmental variables analyzed assistants for their huge help during the fieldwork. Also thanks to Linda
Harris for her assistance with Figure 1. We are grateful to two anonymous
in this study.
reviewers who made helpful comments to a previous version of the
(DOCX) manuscript.
Table S2 Two-way fixed-effects PERMANOVA on uni-
variate descriptors of the physical, chemical and Author Contributions
nutritional environment on Mtunzini Beach. Conceived and designed the experiments: KOC DSS AJS. Performed the
(DOCX) experiments: KOC. Analyzed the data: KOC DSS AJS. Contributed
reagents/materials/analysis tools: DSS AJS JL. Wrote the paper: KOC
DSS AJS JL.
References
1. Hairston NG, Smith FE, Slobodkin LB (1960) Community structure, population 22. Lercari D, Defeo O (2006) Large-scale diversity and abundance trends in sandy
control, and competition – a critique. Ecology 79: 1678–1687. beach macrofauna along full gradients of salinity and morphodynamics. Est
2. Hewitt JE, Pridmore RD, Thrush SF, Cummings VJ (1997) Assessing the short- Coast Shelf Sci 68: 27–35.
term stability of spatial patterns of macrobenthos in a dynamic estuarine system. 23. Pearson TH, Rosenberg R (1987) Feast and famine: structuring factors in
Limnol Oceanogr 42: 282–288. marine benthic communities. In: Gee JHR, Giller PS, eds. The 27th Symposium
3. Norkko A, Cummings VJ, Thrush S, Hewitt JE, Hume T (2001) Local dispersal of the British Ecological Society, Aberystwyth 1986 Blackwell Scientific
of juvenile bivalves: implications for sand flat ecology. Mar Ecol Prog Ser 212: Publications, Oxford. pp 373–395.
131–144. 24. Grant J, Hargrave BT (1987) Benthic metabolism and the quality of sediment
4. Richardson AJ, Schoeman DS (2004) Climate impact on plankton ecosystems in organic carbon. Biol Oceanogr 4: 243–264.
the Northeast Atlantic. Science 305: 1609–1612. 25. Thompson J K, Nichols FH (1988) Food availability controls seasonal cycle of
5. Cury PM, Shin YJ, Planque B, Durant JM, Fromentin JM, et al. (2008) growth in Macoma balthica (L.) in San Francisco Bay, California. J Exp Mar Biol
Ecosystem Oceanography for global change in fisheries. Trends Ecol Evol 23: Ecol 116: 43–61.
338–346. 26. Graf G (1989) Benthic-pelagic coupling in a deep-sea benthic community.
6. Blanchette CA, Schiel DR, Wieters EA, Broitman BR, Kinlan BP (2009) Nature 341: 437–439.
Trophic structure and diversity in rocky intertidal upwelling ecosystems: A 27. Basaguren A, Elosegul A, Pozo J (1996) Changes in the trophic structure of
comparison of community patterns across California, Chile, South Africa and benthic macroinvertebrate communities associated with food availability and
New Zealand. Prog Oceanogr 83: 107–116. stream flow variations. Int Rev Gesamten Hydrobiol Hydrogr 81: 79–91.
7. McLachlan A (1983) Sandy beach ecology: a review. In: McLachlan A, 28. Ambrose WG, Jr. (1984) Influence of predatory polychaetes on the structure of a
Erasmus T, eds. Sandy beaches as ecosystems W. Junk, The Hague. pp soft-bottom community in a Maine estuary. J Exp Mar Biol Ecol 81: 115–45.
321–380. 29. Ambrose WG, Jr. (1991) Are infaunal predators important in structuring marine
8. McLachlan A (1990) Dissipative beaches and macrofauna communities on soft-bottom communities? Am Zool 31: 849–60.
exposed intertidal sands. J Coast Res 6: 57–71. 30. Dugan JE, Hubbard DM, McCrary MD, Pierson MO (2003) The response of
9. Defeo O, Brazeiro A, de Alava A, Riestra G (1997) Is sandy beach macroinfauna macrofauna communities and shorebirds to macrophyte wrack subsidies on
only physically controlled? Role of substrate and competition in isopods. Est exposed sandy beaches of Southern California. Est Coast Shelf Sci 58 S: 25–40.
Coast Shelf Sci 45: 453–462. 31. Lastra M, de la Huz R, Sánchez-Mata AG, Rodil IF, Aerts K, et al. (2006)
10. Schoeman DS, Richardson AJ (2002) Investigating biotic and abiotic factors Ecology of exposed sandy beaches in northern Spain: environmental factors
affecting recruitment of an intertidal clam on an exposed sandy beach using a controlling macrofauna communities. J Sea Res 55: 128–140.
generalized additive model. J Exp Mar Biol Ecol 276: 67–81. 32. Rodil IF, Lastra M, López J (2007) Macroinfauna community structure and
11. Dugan J, Jaramillo E, Hubbard D, Contreras H, Duarte C (2004) Competitive biochemical composition of sedimentary organic matter along a gradient of wave
interactions in macrofaunal animals of exposed sandy beaches. Oecologia 139: exposure in sandy beaches (NW Spain). Hydrobiologia 579: 301–316.
630–640. 33. McLachlan A, Brown AC (2006) The ecology of sandy shores. Burlington, MA,
12. Duarte C, Jaramillo E, Contreras E, Acuña K, Navarro JM (2009) Importance USA: Academic Press. 373 p.
of macroalgae subsidy on the abundance and population biology of the 34. Schlacher TA, Connolly RM (2009) Land-ocean coupling of carbon and
amphipod Orchestoidea tuberculata (Nicolet) in sandy beaches of south central Chile. nitrogen fluxes on sandy beaches. Ecosystems 12: 311–321.
Rev Biol Mar 44: 691–702. 35. Bergamino L, Muniz P, Defeo O (2008) Effects of a freshwater canal discharge
13. Defeo O, McLachlan A (2005) Patterns, processes and regulatory mechanisms in on polychaete assemblages inhabiting an exposed sandy beach in Uruguay. Ecol
sandy beach macrofauna: a multi-scale analysis. Mar Ecol Prog Ser 295: 1–20. Indic 9: 584–587.
14. Halpern BS, Walbridge S, Selkoe KA, Kappel CV, Micheli F, et al. (2008) A 36. Celentano E, Gutiérrez N, Defeo O (2010) Effects of morphodynamic and
Global Map of Human Impact on Marine Ecosystems. Science 319: 948–952. estuarine gradients on a sandy beach mole crab demography and distribution:
15. Airoldi L, Beck MW (2007) Loss, status and trends for coastal marine habitats of implications for source sink habitat dynamics. Mar Ecol Prog Ser 398: 193–205.
Europe. Oceanogr Mar Biol Annu Rev 45: 345–405. 37. Lozoya JP, Gomez J, Defeo O (2010) Modelling large-scale effects of estuarine
16. Lucrezi S, Schlacher TA, Robinson W (2009) Human disturbance as a cause of and morphodynamic gradients on distribution and abundance of the sandy
bias in ecological indicators for sandy beaches: Experimental evidence for the beach isopod Excirolana armata. Est Coast Shelf Sci 87: 472–478.
effects of human trampling on ghost crabs (Ocypode spp.). Ecol Indic 9: 913–921. 38. Day JH (1981) The nature, origin and classification of estuaries. In: Day JH, ed.
17. Lucrezi S, Schlacher TA, Robinson W (2010) Can storms and shore armouring Estuarine ecology with particular reference to southern Africa AA Balkema,
exert additive effects on sandy-beach habitats and biota? Mar Freshw Res 61: Cape Town. pp 1–6.
951–962. 39. Whitfield AK (1992) The characterization of southern African estuarine systems.
18. Sheppard N, Pitt KA, Schlacher TA (2009) Sub-lethal effects of off-road vehicles S Afr J Aquat Sci 18: 89–103.
(ORVs) on surf clams on sandy beaches. J Exp Mar Biol Ecol 380: 113–118. 40. Cooper JAG, Wright CI, Mason TR (1999) Geomorphology and sedimentology.
19. Short AD (1996) The role of wave height, slope, tide range and embaymentisa- In: Allanson BR, Baird D, eds. Estuaries of South Africa Cambridge University
tion in beach classification: a review. Rev Chil Hist Nat 69: 589–604. Press, Cambridge. pp 5–25.
20. McLachlan A, Dorvlo A (2005) Global patterns in sandy beach macrobenthic 41. Pearce AF, Schumann EH, Lundie GSH (1978) Features of the shelf circulation
communities. J Coast Res 21: 674–687. off the Natal Coast. S Afr J Sci 74: 328–331.
21. McLachlan A, Dorvlo A (2007) : Species area relationships for sandy beach 42. Hodgson AN (1987) Distribution of macrobenthic fauna of the Kariega Estuary.
macrobenthos in the context of intertidal width. Oceanologia 49: 1–15. S Afr J Zool 22: 153–62.
PLoS ONE | www.plosone.org 12 August 2011 | Volume 6 | Issue 8 | e23724You can also read


