COMPOUND COSTS: HOW CLIMATE CHANGE IS DAMAGING AUSTRALIA'S ECONOMY - CLIMATECOUNCIL.ORG.AU - Climate Council
←
→
Page content transcription
If your browser does not render page correctly, please read the page content below
COMPOUND COSTS:
 HOW CLIMATE
 CHANGE IS DAMAGING
 AUSTRALIA’S ECONOMY

CLIMATECOUNCIL.ORG.AU
Thank you for
supporting the
Climate Council.
The Climate Council is an independent, crowd-funded organisation
providing quality information on climate change to the Australian public.

    Published by the Climate Council of Australia Limited
    ISBN:    978-1-925573-96-1 (print)
             978-1-925573-97-8 (digital)                                              Professor Will Steffen
                                                                                      Climate Councillor
    © Climate Council of Australia Ltd 2019
    This work is copyright the Climate Council of Australia Ltd. All material
    contained in this work is copyright the Climate Council of Australia Ltd except
    where a third party source is indicated.
    Climate Council of Australia Ltd copyright material is licensed under the
                                                                                      Dr Karl Mallon
    Creative Commons Attribution 3.0 Australia License. To view a copy of this
                                                                                      Director of Science and
    license visit http://creativecommons.org.au.                                      Systems, XDI Pty Ltd.
    You are free to copy, communicate and adapt the Climate Council of Australia
    Ltd copyright material so long as you attribute the Climate
    Council of Australia Ltd and the authors in the following manner:
    Compound Costs: How climate change is damaging Australia’s economy.
    Authors: Will Steffen, Karl Mallon, Tom Kompas, Annika Dean and Martin Rice.      Professor Tom Kompas
                                                                                      Environmental Economist,
    Reviewers: Mark Stafford Smith.                                                   School of Biosciences and
                                                                                      the School of Ecosystem and
                                                                                      Forest Sciences, University
                                                                                      of Melbourne

    —
    Cover image: ‘Townsville Floods’ by Andrew Rankin. Australian Associated
    Press.
    This report is printed on 100% recycled paper.
                                                                                      Dr Annika Dean
                                                                                      Senior Researcher

         facebook.com/climatecouncil                 info@climatecouncil.org.au

         twitter.com/climatecouncil                  climatecouncil.org.au
                                                                                      Dr Martin Rice
                                                                                      Head of Research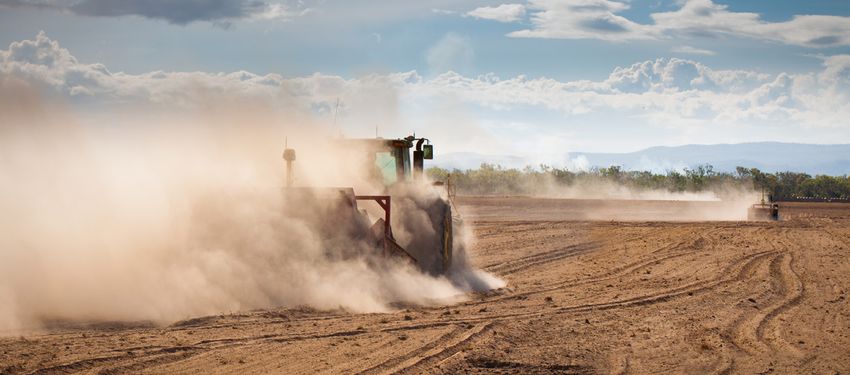
CLIMATE COUNCIL                      i

Contents
Key Findings..................................................................................................................................................................................... ii

1.     Introduction...............................................................................................................................................................................1

2.     Modelling Results.................................................................................................................................................................... 5

       2.1        Impacts on insurance costs and property value in Australia                                                                                                                     6

                  Insurance costs will increase                                                                                                                                                  6

                  Costs will be highly uneven                                                                                                                                                     7

                  Relative property values will decrease                                                                                                                                        10

                  It’s going to get uncomfortably hot                                                                                                                                           10

       2.2        Impacts of rising temperatures on agricultural and labour productivity                                                                                                        11

                  Case study: The cost of the 2009 heatwave across southeastern Australia                                                                                                       12

                  Case study: Costs of climate change to the food system                                                                                                                        14

                  Case study: Costs of climate change on infrastructure                                                                                                                         17

3.     Conclusion and Recommendations................................................................................................................................ 19

4.     Annex A: Methods and assumptions of the agricultural and labour productivity analysis..............................21

5.     Annex B: Methods and assumptions of the property impacts analysis................................................................ 23

References....................................................................................................................................................................................... 25

Image Credits................................................................................................................................................................................. 26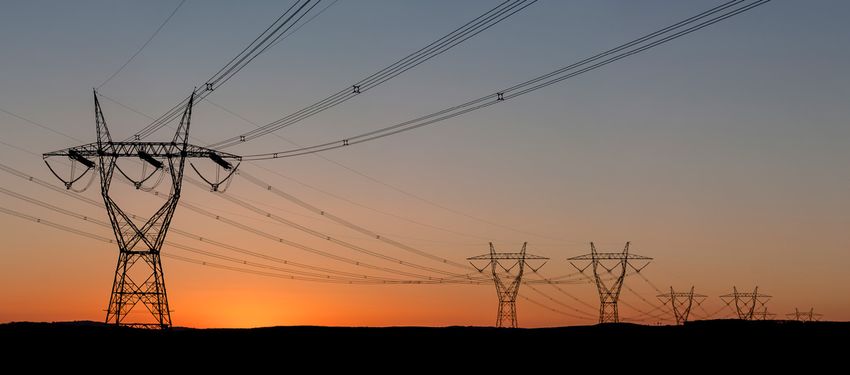
ii    COMPOUND COSTS:
      HOW CLIMATE CHANGE IS DAMAGING AUSTRALIA’S ECONOMY

     Key Findings
     1       2                                                                    3
     Climate change is a major             Detailed new modelling,                The property market is
     threat to Australia’s financial       based on the Federal                   expected to lose $571 billion in
     stability, and poses substantial      Government’s current                   value by 2030 due to climate
     systemic economic risks.              approach to climate change,            change and extreme weather,
                                           finds that the economic                and will continue to lose value
     ›› Direct macroeconomic               damage to Australia’s                  in the coming decades if
        shocks from climate change,        property and agricultural              emissions remain high.
        including reduced agricultural     sectors will be very
        yields, damage to property         significant.                           ›› One in every 19 property
        and infrastructure and                                                       owners face the prospect of
        commodity price hikes, are         ›› Australia’s greenhouse gas             insurance premiums that will
        likely to lead to painful market      emissions have been rising             be effectively unaffordable by
        corrections and could trigger         for four years and we are not          2030 (costing 1% or more of the
        serious financial instability in      on track to meet our weak              property value per year).
        Australia and the region.             2030 emissions reduction
                                              target. If the world followed       ›› Some Australians will be acutely
     ›› Australia’s financial regulators      Australia’s approach we would          and catastrophically affected.
        acknowledge that climate              be on track for at least 3-4°C of      Low-lying properties near rivers
        change is now a central               global warming, which would            and coastlines are particularly at
        concern for the economy               have catastrophic economic             risk, with flood risks increasing
        and financial stability.              consequences.                          progressively and coastal
                                                                                     inundation risks emerging as a
                                                                                     major threat around 2050.

                                                                                  ›› Certain events which are likely
                                                                                     to become more common
                                                                                     because of climate change are
                                                                                     not covered by commercial
                                                                                     insurance, including coastal
                                                                                     inundation and erosion.

                                                                                  ›› More than $226 billion in
                                                                                     commercial, industrial, road,
                                                                                     rail, and residential assets will
                                                                                     be at risk from sea level rise
                                                                                     alone by 2100, if greenhouse
                                                                                     gas emissions continue at
                                                                                     high levels.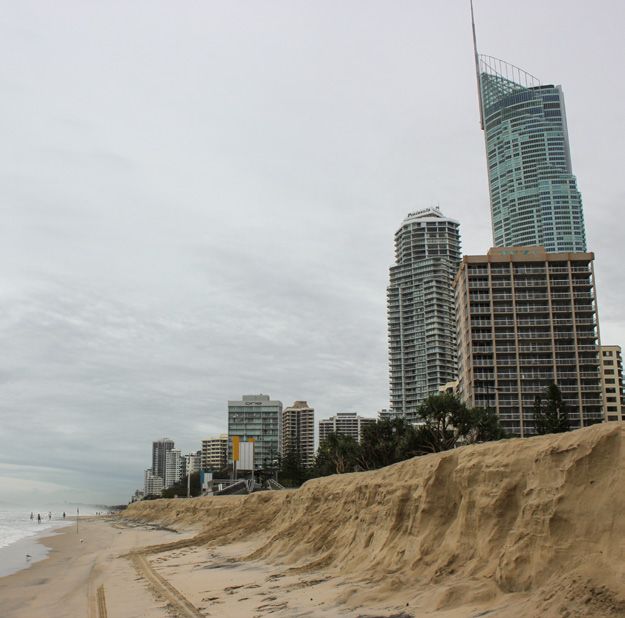
KEY FINDINGS     iii

4
Extreme events like droughts,         ›› By 2090, wheat yields on the
                                                                          5
                                                                          The severe costs of climate
heatwaves, cyclones and                  4,200 family farms in WA that    change outlined in this report
floods have an impact                    produce half of Australia’s      are not inevitable. To avoid
on agriculture and food                  wheat are projected to fall      the costs of climate change
production; this is already              by 41-49% if greenhouse gas      increasing exponentially,
affecting Australia’s economy            emissions remain high.           greenhouse gas emissions
and will cost us much more                                                must decline to net zero
in the future.                        ›› Previous severe droughts         emissions before 2050.
                                         have reduced Australia’s Gross   Investments in resilience and
›› Climate change is increasing          Domestic Product by around       adaptation will be essential to
   the severity and intensity of         1%; estimates suggest that       reduce or prevent losses in the
   extreme weather events in             increasing drought frequency     coming decades.
   Australia.                            and impacts in the future may
                                         reduce GDP by 1% every year.     ›› Increasing resilience to
›› On current trends, the                                                    extreme weather and climate
   accumulated loss of wealth                                                change should become a key
   due to reduced agricultural                                               component of urban planning,
   productivity and labour                                                   infrastructure design and
   productivity as a result of                                               building standards.
   climate change is projected
   to exceed $19 billion by 2030,                                         ›› Buildings and infrastructure
   $211 billion by 2050 and $4                                               must be built to withstand
   trillion by 2100.                                                         future climate hazards and to
                                                                             facilitate the transition to a net
›› By 2050, climate change is                                                zero emissions economy.
   projected to halve the irrigated
   agricultural output of the                                             ›› A credible national climate
   Murray-Darling Basin region,                                              policy is needed to safeguard
   which currently accounts for                                              our economy by reducing the
   50% of Australia’s irrigated                                              direct costs of climate change,
   agricultural output by value                                              and avoiding economic risks
   (about $7.2 billion per year).                                            associated with a sudden,
                                                                             disruptive or disorderly
                                                                             transition to net zero emissions.

                                                                                    climatecouncil.org.au
1   COMPOUND COSTS:
    HOW CLIMATE CHANGE IS DAMAGING AUSTRALIA’S ECONOMY

    1.          Introduction
                There are few forces affecting the                              Australia has always been a land of droughts
                Australian economy that can match                               and flooding rains. However, in the past,
                the scale, persistence and systemic                             extreme weather events were cyclical
                risk associated with climate change.1                           around a stable average, allowing enough
                Australia’s financial regulators have                           time for recovery between events. Now,
                recently made a call for action to deal                         climate change is driving a trend change,
                with climate change, with the Reserve                           increasing both the frequency and severity
                Bank of Australia, the Australian                               of many extreme weather events (Climate
                Prudential Regulation Authority                                 Council 2019). This is shrinking the recovery
                and the Australian Securities and                               times between events, and increasing
                Investment Commission citing                                    the probability of simultaneous events in
                risks posed by climate change as                                multiple locations. Climate change is also
                a central concern for the economy                               increasing the probability of compound
                and financial stability. As the                                 events, where two or more extreme weather
                Deputy Governor of the Reserve                                  events combine to produce impacts that
                Bank of Australia noted, the risks                              are worse than the effects of each event
                that climate change poses to the                                independently (e.g. coincident droughts and
                Australian economy are “first order”                            heatwaves worsening bushfires).
                and have knock-on implications for
                macroeconomic policy (Debelle 2019).                            There are many examples of extreme weather
                                                                                and climate events creating supply shocks
                                                                                that reduce output, cause unemployment and
                                                                                increase prices and inflation. The agriculture
                                                                                sector is particularly sensitive to climate
                                                                                and weather, so despite being a relatively
                                                                                small sector (around 2-3% of Gross Domestic
    Australia’s financial                                                       Product or GDP), the impacts of drought are
                                                                                apparent in aggregate GDP. Previous severe
    regulators have                                                             droughts have reduced economic growth
                                                                                by about 1% (e.g. the 2002-03 drought and

    acknowledged that                                                           the 1994-95 drought) (Commonwealth of
                                                                                Australia 2005). Extreme weather events

    climate change                                                              can also generate supply shocks that push
                                                                                up commodity prices and increase inflation

    poses significant                                                           – for instance Tropical Cyclone Yasi drove
                                                                                up banana prices, boosting inflation by just

    and systemic risks                                                          under 1% (Debelle 2019). Inflation returned
                                                                                to normal the following season, but the
                                                                                prospect of near permanent supply shocks
    to our economy.                                                             driven by climate change poses threats

                1
                 Systemic risks are imposed by interlinkages and interdependencies within a system, where the failure of a single component or
                cluster can cause a cascading failure, resulting in system instability and potential collapse.
CHAPTER 01 2
INTRODUCTION
If climate change continues unabated,
extreme weather and climate events will
increasingly cause economic shocks that
will cascade through the economy.
to economic resilience. Climate change being and the economy at risk. The longer we
can also erode the productive capacity of delay swift and decisive action, the more it
the economy. For instance, funds may be will cost the Australian economy.
diverted towards recovery and away from
investments in new technology, machinery The modelling done for this report2 shows
or research, leading to long-term reductions that climate change is likely to result in sharp
in productivity growth. adjustments in residential property values
in some areas. The total estimated damage-
Climate change also presents broad risks related loss of property value – excluding
to other sectors. Direct macroeconomic any disruptions to productivity – is expected
shocks will arise from the impacts of to rise to $571 billion by 2030, $611 billion by
climate change on housing, temporary or 2050 and $770 billion by 2100.
permanent contractions of some industries
and subsequent reductions in employment, These costs are likely to be highly
commodity price adjustments, and damages concentrated on about 5-6% of properties,
and disruption to critical infrastructure and will represent an enormous cost for
that provide essential services and facilitate those affected, with likely flow-on effects to
economic activity. Australia’s economy the whole economy, as governments become
will also continue to be affected by climate the insurers of last resort. The annual
change impacts on our trading partners. average risk costs of extreme weather and
climate change to properties is projected to
There has been recent media coverage and rise to $91 billion per year in 2050 and $117
commentary on modelling that looks at the billion per year in 2100. These will be felt
costs of deeper emissions reductions than through increased insurance costs and will
the current Federal Government target of predominantly impact the same households
26-28% by 2030 on 2005 levels. It is pointless that will experience the steepest losses in
to do this without actually looking at the property values.
costs of inaction. Studies such as the Garnaut
Review (2008) and the Stern Review (2006) Failure to tackle climate change will also
clearly show that the costs of inaction greatly come at a cost to agriculture and labour
outweigh the costs of action. Over the past productivity. The cumulative loss of wealth for
five years, the Federal Government has Australia from the impacts of climate change
squandered opportunities to tackle climate on agricultural and labour productivity is
change, putting Australian lives, our well- expected to reach $4.2 trillion by 2100.
2
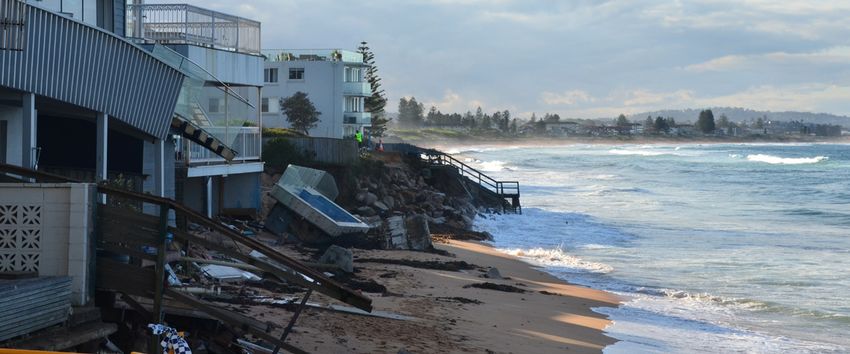
The methods and assumptions behind the modelling can be found in Annex A and B at the back of this report.Figure 1: Australian properties have been battered by powerful storms in the past; as climate change intensifies property
value loss could reach $571 billion by 2030. Impacts like coastal inundation are not covered by insurance policies.
The costs explored here represent a partial Decisions taken now will have major impacts
snapshot of some of the direct costs of on future climate trends and impacts. Until
climate change in a business-as-usual around 2050, a considerable increase in
emissions scenario (i.e. if greenhouse gas climate impacts is locked in from greenhouse
emissions continue unabated). Three case gas emissions that have already been released.
studies are also presented to show the Therefore, it is important to ensure that well
systemic nature of climate change costs, and planned adaptation is underway at all levels
how they may cascade through the economy, now, within a strong framework that should be
affecting households, governments and facilitated by government, but also involve the
businesses. There are also many very private sector. It is also important to accelerate
significant costs of climate change that the transition to a net zero emissions
cannot be adequately captured through an economy by 2050 at the latest and preferably
economic lens, and have not been explored much earlier, or else the costs of adaptation
in this report. These include loss of life, and residual loss and damage will increase
health and wellbeing, reduced safety, and rapidly after 2050. Steering the economy
loss of species and biodiversity. 3 This report to net zero emissions through stable and
focuses on synthesising systemic impacts credible policies is crucial for managing both
of climate change on the economy that have the physical risks from climate change and
previously been very partially estimated, or the risks and opportunities associated with
have been greatly underestimated. decarbonisation of the economy.
Climate change and extreme weather are
projected to reduce property values by
$571 billion by 2030, $611 billion by 2050
and $770 billion by 2100.
3
Some costs to biodiversity have direct and quantifiable impacts. For instance, loss of the Great Barrier Reef due to climate
change would mean loss of the reef’s annual economic contribution of $6.4 billion per year (Deloitte 2017a). In other ways, the
Great Barrier Reef is arguably priceless.CHAPTER 01 4
INTRODUCTION
Cumulative damages to agricultural and
labour productivity from climate change
are expected to reach $4.2 trillion by 2100.
The Climate Council of Australia on the Australian property sector, a separate
commissioned new modelling to inform the analysis was undertaken by the Cross-
results outlined in this report. The modelling Dependency Initiative (XDI). This included
was conducted in two parts. First, damages an assessment of the 15 million addresses in
from climate change to agricultural Australia, with each property tested against
productivity and labour productivity were six extreme weather hazards – flood, coastal
modelled using the Global Trade Analysis inundation, bushfire, wind storms, heat-
Project Computable General Equilibrium waves and soil subsidence. The number of
Model. The potential economic damages properties was assumed to remain stable
from climate change in this computational in the future, but the influence of climate
platform were limited principally to reduced change on the six hazards was modelled
agricultural and labour productivity, loss of to assess annual average risk costs (used to
arable land due to sea level rise and some inform insurance premiums) and property
health impacts. Results were obtained value losses. This assessment was one of the
at various global temperature increases, largest climate change risk assessments of
and are presented in this report as the net property in Australia. See Annex B for more
present value of cumulative damages from details on methods and assumptions.
2017 at different points in time. More details
on the methods can be found in Annex A.
To incorporate impacts of climate change
Failure to act would result in significant
economic damages. The Federal
Government must implement credible
climate policies that set us on a course
for net zero emissions before 2050.5 COMPOUND COSTS:
HOW CLIMATE CHANGE IS DAMAGING AUSTRALIA’S ECONOMY
2. Modelling Results
The modelling scenario adopted in This scenario was chosen as it is the future
this report is one that assumes global that would eventuate if the world were to
greenhouse gas emissions continue to adopt similarly dismal levels of policy effort
rise on a business-as-usual trajectory. to Australia in addressing climate change.
Australia’s greenhouse gas emissions have
risen over the past four consecutive years,
and are set to continue to rise based on
current policies. If the world were to adopt
a similar policy trajectory to Australia, the
global average temperature would increase
by between 3°C and 4°C by the end of this
century (CAT 2019), which is aligned with
the highest emissions scenario outlined by
the Intergovernmental Panel on Climate
Change (IPCC) and used in this report.
The purpose of highlighting the high
emissions scenario is to illustrate that
there are substantial costs associated with
inaction on climate change. These costs are
not inevitable. Many future costs could be
avoided through credible policies that drive
down greenhouse gas emissions to net
zero by 2050 or earlier, and increase climate
change resilience across society.CHAPTER 02 6
MODELLING RESULTS
2.1 Impacts on insurance
costs and property
value in Australia
The property sector has a larger “footprint” INSURANCE COSTS WILL INCREASE
on the Australian economy than any other
industry (AEC Group 2015). The market for The probability of extreme weather events is
residential properties is valued at around increasing due to climate change, putting the
$6.6 trillion (significantly larger than the economy at risk. Reinsurance companies like
Australian Stock Exchange and about Munich RE have stated clearly that insurers
threefold larger than the superannuation cannot keep using the past as a guide to the
industry). Activities involved in facilitating future (Munich RE 2019). In the absence of
the property industry (e.g. construction, adaptation, it is inevitable that insurance
architecture and engineering, banking, premiums will have to rise. Currently, not
insurance and property and business all hazards are covered by commercial
services) directly contribute around 11.5% insurance. Hazards such as bushfires,
to GDP (AEC Group 2015). The property riverine flooding and storm damage are
industry also contributes around 16% generally covered, but events such as coastal
to revenues of governments at all levels inundation, erosion, landslip and subsidence
via taxes, rates and levees (AEC Group are all generally excluded, which means
2015). The industry employs around 1.17 people and business are effectively self-
million Australians and at least 14.1 million insured against these hazards (or insured by
Australians also have a stake in the industry the taxpayer). For example, 3% of properties
via their super funds (AEC Group 2015). are built on soils that can contract and break
foundations in a severe drought. Ideally these
important hazards will become included
in standard policies, though this would
also require higher insurance premiums.
Assuming that these excluded hazards are
incorporated into insurance policies, and
accounting for the increased risks associated
with hazards that are currently generally
covered, modelling undertaken by XDI
estimates that the annual average cost of
damage from extreme weather and climate
hazards to properties will rise to $85 billion
in 2030, $91 billion in 2050 and $117 billion in
2100 (see Table 1).7 COMPOUND COSTS:
HOW CLIMATE CHANGE IS DAMAGING AUSTRALIA’S ECONOMY
Table 1: Annual average risks costs (used to inform insurance premiums) in 2030, 2050 and 2100.
2030 2050 2100
Total annual average risk cost $85 billion $91 billion $117 billion
Percentage of properties over 1% risk cost threshold 5.3% 5.5% 6.6%
Number of houses over 1% risk cost threshold 795,000 (1 in 19) 825,000 (1 in 18) 990,000 (1 in 15)
COSTS WILL BE HIGHLY UNEVEN The results indicate that by 2030 about 1 in
every 19 properties is projected to fall into
The major impact of this increased cost this category, by 2050 about 1 in every 18
will be concentrated on about 5-6% properties, and by 2100 about 1 in every 15
of properties, which will experience properties is projected to fall into this category
average annual risk costs (used to inform (see Table 1). The properties in this category
the pricing of insurance premiums) that are not spread out evenly, but are instead
are effectively unaffordable (costing the concentrated in areas that are highly exposed
equivalent to 1% or more of the property to current and future hazards – like flooding,
value per annum). This would be the bushfires and coastal inundation – and that
equivalent of a person with a home were not built to withstand such events.
worth $500,000 having to set aside
more than $5,000 every year for extreme These figures assume that the type, number
weather losses for the building alone and location of properties remains constant
(not including contents, consequential over time. This means that these figures are
losses, and normal insurance items like highly conservative. Building new properties
house fires and burglary). in areas exposed to current and emerging
hazards could substantially increase the
number of at-risk properties. The Local
Government Areas (LGAs) with the highest
number of impacted properties tend to be
urban LGAs that have a higher number of
If we don’t rapidly properties in total. To convey a normalised
picture of the most impacted LGAs, Table
reduce greenhouse 2 displays the top ten LGAs in each state
and territory with the highest percentage of
gas emissions, by 2030 impacted properties by 2100, as a proportion
of all properties in each LGA.
about 1 in every 19
properties could have
effectively unaffordable
insurance premiums.CHAPTER 02 8
MODELLING RESULTS
Table 2: Top ten most impacted LGAs in each state and territory, by the percentage of impacted properties. Impacted
properties are defined as those where the annual average risk cost is 1% or more of the property value by 2100.
Rank NSW VIC QLD SA TAS WA NT
1 Moree Plains Swan Hill Gold Coast Mid Murray Northern Upper Roper Gulf
Flood; Soil Flood Flood; Flood; Midlands Gascoyne Flood; Soil
Inundation Inundation Flood Flood;
Bushfire
2 Coonamble Campaspe Ipswich Tatiara Launceston Exmouth Central Desert
Flood; Soil Flood Flood; Soil Flood Flood Inundation; Flood
Bushfire
3 Brewarrina Gannawarra Sunshine The Coorong West Coast Beverley Victoria Daly
Flood; Soil Flood Coast Flood; Flood Flood Flood
Inundation Inundation
4 Bogan Benalla Toowoomba Naracoorte Break O’Day Northam MacDonnell
Flood; Soil Flood Mixed and Lucindale Flood; Flood Flood
Flood Inundation
5 Edward Melbourne Rockhampton Robe Central York Alice Springs
Flood Flood; Flood; Flood; Highlands Flood Flood
Inundation Inundation; Inundation Flood
Soil
6 Bourke Moira Western Kingston King Island Moora Unincorporated
Flood; Soil Flood Downs Flood; Flood Flood NT Flood;
Flood; Soil Inundation Inundation
7 Inverell Greater Mackay Mallala Huon Valley Karratha Katherine
Flood; Soil Shepperton Inundation Flood; Flood; Inundation Mixed
Flood Inundation Inundation
8 Narrabri Horsham Townsville Murray Bridge Devonport East Pilbara Barkly
Flood; Soil Flood; Soil Flood; Flood; Flood Flood Flood
Inundation Inundation
9 Murray Loddon Moreton Bay Gawler Latrobe Nannup West Arnhem
Flood Flood Inundation Flood Flood Flood Mixed
10 Walgett Hindmarsh Fraser Coast Barossa Meander Port Hedland Darwin
Flood; Soil Flood; Soil Inundation Flood Valley Inundation Inundation
Flood9 COMPOUND COSTS:
HOW CLIMATE CHANGE IS DAMAGING AUSTRALIA’S ECONOMY
Queensland has a disproportionate number
of LGAs that will be highly impacted by
climate change and extreme weather. In
Queensland, 64% of LGAs have 10% or more
of their properties with an annual average
risk cost that is 1% or more of the property
value by 2100. In the Northern Territory,
24% of the LGAs meet this definition and
in New South Wales 28% of LGAs meet this
definition. Table 3 displays these figures for
all states and territories.
Table 3: Percentage of impacted* LGAs out to 2100 in each state and territory.
2030 2050 2100
New South Wales 23% 23% 28%
Victoria 10% 15% 23%
Queensland 52% 52% 64%
South Australia 8% 8% 10%
Western Australia 11% 11% 12%
Tasmania 3% 3% 3%
Northern Territory 24% 24% 24%
Australian Capital Territory Negligible Negligible Negligible
*An impacted LGA is classified as one where 10% or more of the properties will have an annual average risk cost that is 1% or
more of the property value by 2100.CHAPTER 02 10
MODELLING RESULTS
RELATIVE PROPERTY IT’S GOING TO GET
VALUES WILL DECREASE UNCOMFORTABLY HOT
Household budgets are not elastic. Extra The number of days which are dangerously
money that is spent on insurance must hot has been increasing since the 1950s.
come from spending less on something else. These are days when people experience
When considering lending for mortgages, heat stress, which can result in respiratory
banks look carefully at the annual costs and cardiovascular illness and even
of the borrower, including the cost of premature death. The design of buildings
insurance. Therefore, banks in principle has a strong impact on the cooling needs of
will have to lend less for houses with higher occupants, and most existing dwellings in
insurance costs. Thus, for two equivalent Australia are not able to adequately protect
homes, the one that is more exposed and people from severe heatwaves. There are
vulnerable to climate exacerbated extreme some known approaches for reducing
weather impacts is expected to decrease in heat gain in existing dwellings, but as
value compared to less affected properties. these are not effective in all situations, air
There is some evidence that climate change conditioning may be required to reduce
is already altering property values in parts the heat stress of occupants. In general,
of the United States (such as Miami), where investing in improving the thermal
higher elevation properties are essentially comfort of existing dwellings that are
worth more now, and increasingly will be unable to protect people from heatwaves
worth more in the future (Keenan et al. is a cost-effective preventative health
2018). Based on research commissioned measure. The average cost of a single
from XDI for this report, the total estimated acute hospital admission costs the health
damage-related loss of property value – system approximately $5,171 in Australia
excluding any disruptions to productivity (IHPA 2019). When the health benefits are
or physical damage or replacement costs of considered alongside the social, financial
buildings – is expected to rise to $611 billion and environmental benefits of more
by 2050 and $770 billion by 2100. sustainable housing, there is a clear case for
investing in thermal and energy efficiency
upgrades in existing buildings. For new
Table 4: Damage-related loss in property values
expected in 2030, 2050 and 2100.
buildings, significant opportunities exist to
strengthen building codes to cost-efficiently
improve energy and thermal efficiency
2030 2050 2100 performance whilst protecting occupants
from increased heat stress. Urban planning
$571 billion $611 billion $770 billion
and design can also significantly influence
heat build-up in urban areas. Designing
urban spaces to take consideration of heat
gain in the first instance is much less costly
than retrofitting spaces retrospectively.
Investing in improving energy and thermal
efficiency of new and existing buildings has
considerable economic and health benefits.11 COMPOUND COSTS:
HOW CLIMATE CHANGE IS DAMAGING AUSTRALIA’S ECONOMY
2.2 Impacts of rising
temperatures on agricultural
and labour productivity
Allowing greenhouse gas emissions to Neighbouring countries, many of whom are
continue on a business-as-usual trajectory major trading partners with Australia, are
is not an economically and socially projected to experience much more severe
responsible option for Australia. If this damages than Australia. Total cumulative
were to occur, cumulative damages from damages to 2100 in Southeast Asia are
reduced agricultural and labour productivity more than $167 trillion. Losses in annual
(including via some human health effects) GDP in the region, starting in 2100, range
would reach $19 billion by 2030 and $211 from 12-21%, figures comparable if not
billion by 2050. Damages would ramp up exceeding the 15% reduction in worldwide
dramatically after 2050, with cumulative GDP that occurred during the 1930s Great
loss of wealth between now and 2100 Depression – the worst economic downturn
reaching $4.2 trillion or roughly $61,000 in the history of the industrialised world.
per person on average. This is assuming By comparison worldwide GDP fell just 1%
that the Australian population increases during the Global Financial Crisis in 2008-
to over 60 million in 2100 (i.e. a smaller 09 (Lowenstein 2015).
population increase would naturally imply
an increase in per person damages). These
figures only account for damages arising
from reduced agricultural and labour
productivity, loss of arable land due to sea
level rise and some health impacts. Losses
from riverine flooding, bushfires and other
extreme weather events such as storms and
tropical cyclones – which are all projected
to rise in frequency and/or severity because
of climate change, and are expected to
substantially increase economic losses – are
not included in these figures.
Failing to rapidly and deeply reduce
our emissions would be economically
and socially irresponsible.CHAPTER 02 12
MODELLING RESULTS
CASE STUDY:
The cost of the 2009 heatwave
across southeastern Australia
Climate change is making heatwaves Electricity infrastructure did not cope well
in Australia more frequent, intense and with the heat. The Basslink interconnector
longer lasting (Perkins and Alexander 2013). between Tasmania and Victoria shut
During the summer of 2009, southeastern down due to overheating, significantly
Australia experienced one of the nation’s compromising power supply (Victoria
most severe heatwaves. The heatwave was gets about 6% of its power supply via the
intense, prolonged and extensive, and was Basslink). This coincided with a period
exceptional compared with 100-150 years of high demand for power and reduced
of historical observations. The heatwave efficiency of transmission due to the heat.
contributed to catastrophic bushfire danger There were also a number of heat-related
conditions, and the occurrence of the faults in transformers, resulting in outages
devastating Black Saturday bushfire disaster. of major transmission lines (QUT 2010).
In the five to ten years leading up to the Rolling blackouts were introduced to protect
event, the Millennium Drought had gripped the grid. On the evening of January 30,
eastern Australia, leading to particularly more than 500,000 residents in Melbourne
dry soils and vegetation that were further went without power (QUT 2010). System-
desiccated by the heatwaves. The impacts
of the heatwaves and subsequent bushfires
were substantial. This case study outlines
only the impacts of the heatwaves, the
costs of which are poorly understood as
Figure 2: Emissions from the burning of coal, oil
they rarely result in permanent damage to and gas are causing more frequent, intense and
infrastructure. However, impacts on health prolonged heatwaves in Australia. Heatwaves in
and service disruptions due to failures in Australia can be medical emergencies, resulting
in an increase in emergency department
critical infrastructure are substantial. presentations and excess deaths.
The heatwave during the summer of 2009
sharply increased heat-related deaths in
vulnerable groups. As many as 500 excess
deaths were recorded in Melbourne and
Adelaide (374 deaths in Melbourne and
50-150 deaths in Adelaide) (QUT 2010).
In addition, there were more than 3000
reports of heat-related illness (QUT 2010).
Emergency services such as ambulance
and paramedics, emergency treatment and
mortuary capacity were under severe strain
in both Melbourne and Adelaide (QUT 2010).13 COMPOUND COSTS:
HOW CLIMATE CHANGE IS DAMAGING AUSTRALIA’S ECONOMY
wide failure was narrowly escaped. Between bitumen) (Natural Capital Economics
27-30 January, Adelaide also experienced 2018). Minor disruptions to port operations
rolling blackouts as demand reached in Melbourne were caused by melting
record levels. The failure of the Basslink bitumen, overheating of hydraulics and
interconnector also affected Adelaide. loss of electricity, contributing to loss of
productive hours from the workforce (QUT
Melbourne’s transport services were heavily 2010; McEvoy et al. 2013).
disrupted by the heatwave, with faults in
the rail system including rail buckling, Direct financial losses from the heatwave
malfunctioning carriage air conditioning have been estimated at $800 million (QUT
systems and power failure to the city loop line 2010). These arose from disruptions to
(Osborne & McKeown 2009). More than one electricity and transport services, and
third of services had to be cancelled during emergency services costs. The reduced
the heatwave, with cancellations peaking on labour productivity of people is by far the
January 30. Over 28-30 January, 7% of train largest cost of heatwaves in Australia, at
services in Adelaide were also cancelled due an estimated $8.7 billion per year (0.3-
to the heatwave (QUT 2010). Melbourne’s 0.4% of GDP) (Zander et al. 2015). Climate
road transport system was also affected by change has already made heatwaves
traffic signal disruptions at 124 intersections more frequent, more prolonged and
in metropolitan Melbourne and three more intense, and these trends are set to
intersections in regional Victoria, with about continue over coming decades.
1% of roads affected by flushing (melting
Figure 3: Extreme heat can have significant impacts on infrastructure and essential services, such as electricity transmission.CHAPTER 02 14
MODELLING RESULTS
CASE STUDY:
Costs of climate change
to the food system
The total food value chain in Australia is a like drought, heatwaves, cyclones and floods
major part of the economy, worth about $230 affect both production and value chains.
billion in 2012-13, equivalent to about 13.6% Droughts like the Millennium Drought
of current GDP (Department of Agriculture in the 2000s reduced overall yields from
2014). One fifth of the value comes from the Murray-Darling Basin by about 20%,
production, and the rest is in processing, including the complete failure of some crops
retail and net exports (ABS 2018a; ABARES such as irrigated rice. This drought reduced
2018; Department of Agriculture 2014). It also agricultural income by 42% and employment
employs about a quarter of a million workers, by 70,000 people (a 15% reduction)
nearly half of them outside cities. Two (Commonwealth of Australia 2005); other
thirds of our production is exported (14% droughts in the past 30 years have reduced
of Australian goods and services exports), jobs by 6,000 and farm incomes by 18%
valued at around $45 billion (DFAT 2017). (Wittwer and Griffith 2011; Commonwealth
of Australia 2005). Droughts reduce the
Climate change is influencing all extreme viability of regional towns, and cause spikes
weather events as they are occurring in a in the rate of rural male suicides, by as much
more energetic climate system (Trenberth as 15% (Hanigan et al. 2012). Severe droughts
2011). Australia is one of the most vulnerable are expected to become more frequent,
developed countries in the world to the especially across southern Australia (CSIRO
impacts of climate change. Extreme events and BoM 2015).
Figure 4: Major droughts in Australia have cut GDP growth and affected food prices.15 COMPOUND COSTS:
HOW CLIMATE CHANGE IS DAMAGING AUSTRALIA’S ECONOMY
Climate change will cause significant
economic loss to agricultural heartlands
such as the Murray-Darling Basin and
the Western Australian wheat belt.
The 2009 Melbourne heatwave reduced fall by 41-49% in the absence of reduced
apple and pear crops by 30-70% due to emissions, with shifts in rainfall patterns
sunburn (Thomson et al. 2014). Based having the strongest influence on this
on the losses experienced in the 2009 decline (Taylor et al. 2018). Repeated extreme
heatwave event, the annual expected weather events can reduce agricultural
losses to agriculture from heatwaves is productivity by reducing investments in new
$39.3 million, rising to $109.5 million if technologies and production efficiencies,
greenhouse gas emissions continue at high leading to a permanent loss in productivity
levels (Natural Capital Economics 2018). improvements that might otherwise help
to counteract the effects of climate change.
The 2011 and 2015 cyclones destroyed The 2000s drought was estimated to have
70-90% of the Queensland banana crop, reduced agricultural productivity by 18%
and the recent floods in north Queensland through this effect (Sheng et al. 2019).
killed an estimated 664,000 cattle,
worth an estimated $800 million (ABC Droughts in the 1980s, 1990s and 2000s each
2019). Floodwaters can disrupt transport shaved about 1% off national GDP growth in
routes, interrupting supply chains and the years they occurred (compared to the
compromising food security, as happened global financial crisis in 2008-9 reducing
in the 2011 Queensland floods when GDP by 2%) (Commonwealth of Australia
Rockhampton (population of 75,000) was 2005; RBA 2006; World Bank 2015). Rural
cut off by road, rail and air for two weeks. exports declined by 23% ($2 billion) during
Brisbane came within a day of running out the 2002-3 drought, whilst overall food prices
of bread during the floods (DAFF 2012). rose by 4.4%, twice the rate of the Consumer
Price Index (Quiggin 2007). The current
The food sector is also vulnerable to the drought has already reduced farm output
more chronic effects of ongoing climate by 6% and total GDP by about 0.25% (Debelle
change, like rising temperatures, changing 2019). Even if rainfall returns to normal soon,
rainfall patterns, and the persistent damage the impact of the drought will continue
caused by repeated extreme events. By to exert a drag on the economy for some
2050, without mitigation, we are projected time. Federal drought assistance since 2000
to lose half the irrigated agricultural output has totaled around $6 billion, preventing
of the Murray-Darling Basin (Garnaut 2008), these funds being invested in productive
which is currently worth about $7 billion purposes such as research and development,
per year and accounts for roughly half of innovation or infrastructure. Estimates
Australia’s irrigated agricultural production of future drought frequency and impacts
(ABS 2018b). By 2090 wheat yields on the suggest an effective lowering of GDP by 1%
4,200 family farms that produce 50% of every year (Carroll et al. 2007).
Australia’s wheat in WA are projected toFigure 5: Impacts of climate change on the food system. Source: Authors.
IMPACTS OF CLIMATE CHANGE ON
THE FOOD SYSTEM
INTENSE RAINFALL CYCLONES
HEATWAVES
/ FLOODING / STORMS
RISING AVERAGE RAINFALL
DROUGHT
TEMPERATURES PATTERNS
Changed household purchasing Impacts on balance
Decreased food yields Impacts on food distribution
patterns: Missing meals / less of trade and GDP
/ transportation (disruptions
nutritious meals / less
to roads, railways, ports)
disposable income
Reduced exports
Decreased farm incomes Increased food prices
(increased imports)
Decreased retail activity Impacts on food security
Job losses Debt
in rural areas of importing nations
Disruptions to food
Increased economic pressure Rural outmigration Inflation
processing and retail
Threats to local Regional political
Psychological distress/depression Increased health costs
food security instability / conflict17 COMPOUND COSTS:
HOW CLIMATE CHANGE IS DAMAGING AUSTRALIA’S ECONOMY
CASE STUDY:
Costs of climate change
on infrastructure
Significant costs can arise from the impacts infrastructure increase exposure to supply
of extreme weather on infrastructure. It is chain disruptions. For example, utilities such
expected that around $17 billion (in present as electricity, telecommunications and water
value terms) will need to be spent between are necessary for the functioning of a range
2015 and 2050 on rebuilding critical of other infrastructure.
infrastructure following natural disasters
(Deloitte 2017b). There are already many examples of
infrastructure failures due to the impacts of
Beyond direct damages to infrastructure extreme weather events. In 2017, heatwaves
that necessitate repair or rebuilding, caused 3,600 MW of power to fail in South
significant flow-on costs arise from Australia, New South Wales and Queensland
temporary disruptions to the functioning during a critical demand period (14% of the
of infrastructure. Interdependencies total coal and gas fired power supply to these
between different types of essential urban states) (Ogge and Aulby 2017). A major storm
in South Australia in 2016 caused damage to
electricity transmission infrastructure in the
state (including bringing down 22 electricity
Figure 6: Coastal erosion on the Gold Coast. Climate change transmission towers), which combined with
exacerbates coastal flooding from a storm surge as the storm rides other factors resulted in a cascading failure of
on higher sea levels, putting critical coastal infrastructure at risk.
the network and a power outage across most
of South Australia. The disruption cost of the
storm to businesses in South Australia was an
estimated $367 million (with median losses of
$5000 per business) (Business SA 2016).
The 2010-11 floods in Queensland disrupted
commodity exports for an extended period,
with a sizeable impact on gross state
product. The floods inundated coal mines
and rail lines and disrupted port operations,
reducing coal exports for the first six months
of the year. Queensland’s total exports fell
by 7.8% in 2010-11. The consequences of
the floods reduced Queensland’s overall
growth in Gross State Product in 2010-11 by
2.8% (Queensland Treasury 2011). Flooding
also prevented commercial shipping from
the Port of Brisbane during 11-16 January
(McEvoy et al. 2013).CHAPTER 02 18
MODELLING RESULTS
Without action and as extreme weather
events worsen, infrastructure companies are
increasingly exposed to climate liabilities.
The exposure of coastal assets to sea-level protecting assets along different areas of
rise associated with climate change is Australia’s coastline, what these will cost, and
widespread and will increase in the future. how these can be financed, though some
More than $226 billion (in 2008 dollars) in estimates exist for global coastal protection
commercial, industrial, road and rail, and costs (e.g. Hinkel et al. 2014). Between now
residential assets are exposed to flooding and 2100, population growth and poor urban
and erosion hazards at a sea-level rise of 1.1 planning could more than double the value of
m.3 Coastal assets at risk from the combined exposed assets and people at risk of impacts
impact of inundation and shoreline from shoreline erosion, storm surges and
recession include: between 5,800 and 8,600 permanent inundation. Winds and intense
commercial buildings, with a value ranging rainfall associated with storms and cyclones
from $58 to $81 billion (2008 replacement also pose independent and linked threats to
value); between 3,700 and 6,200 light coastal infrastructure.
industrial buildings, with a value of between
$4.2 and $6.7 billion (2008 replacement Banks, insurance companies and
value); and between 27,000 and 35,000 km superannuation companies are heavily
of roads and rail, with a value of between invested in properties and infrastructure
$51 and $67 billion (DCCEE 2011). Other in Australia, and these physical assets
national infrastructure within 200 meters of are increasingly exposed to the risks of
the coastline include: 120 ports, five power climate change. Infrastructure companies
stations, 258 police, fire and ambulance may also increasingly face liability risks
stations, 75 hospitals and health services and for contributing to risks related to climate
44 water and waste facilities (DCC 2009). change itself. In 2018 California’s largest
utility company, Pacific Gas & Electric Corp,
Some of these assets can be protected by filed for bankruptcy protection after faulty
coastal protection measures such as seawalls, power lines were blamed for starting dozens
but this will come at a cost. There is a lack of wildfires, including the Camp Fire – the
of detailed and comprehensive research most deadly and destructive in California’s
on what coastal protection measures are history. An insurance company also folded
the most cost-efficient and effective for under the claims it received.
3
This is considered to be a ‘high-end scenario’ for 2100 based on projections from the IPCC’s 2007 Fourth Assessment Report
(AR4). However, this ‘high end’ projection is still highly plausible.19 COMPOUND COSTS:
HOW CLIMATE CHANGE IS DAMAGING AUSTRALIA’S ECONOMY
3. Conclusion and
Recommendations
This report has provided a snapshot of It has highlighted the need for an in-
the serious economic risks to Australia depth study on this topic, to determine a
posed by unabated climate change. more comprehensive picture of the likely
economic costs of unabated climate change
with no adaptive interventions, and what
losses and damages can be avoided through a
reform agenda led by government involving
activities such as:
›› Reducing emissions to net zero by 2050
or earlier, through clear and coordinated
policy leadership.
›› Strengthening building codes to increase
the thermal efficiency and energy
efficiency of buildings as well as ensuring
building designs are fit-for-purpose to
cope with increasingly frequent and severe
climate-influenced hazards;
›› Adopting risk-appropriate national land-
use planning guidelines that prevent
new buildings and infrastructure being
constructed in areas that are, or will be,
highly exposed to climate change hazards,
and that help facilitate the reduction
of emissions across the transport and
buildings sectors;
›› Upgrading and constructing new
infrastructure (including infrastructure
specifically designed to mitigate disaster
risks), informed by a national assessment.CHAPTER 03 20
CONCLUSION AND RECOMMENDATIONS
Such a study should also incorporate A national risk index should be developed
consideration of losses and damages that to help compare the risk levels of different
are unlikely to be able to be substantially LGAs, as well as to track and evaluate risk
mitigated through adaptation. For example, over time. This will enhance understanding
agriculture is a particularly climate sensitive of the underlying causes of risk in specific
sector, and limits to adaptation are already areas, and help to inform locally appropriate
being confronted in this sector. Mitigation risk mitigation options. Incentives should be
of greenhouse gas emissions is crucial to devised to encourage coordination between
reduce impacts in this sector. public and private stakeholders to invest in
cost-efficient and effective risk mitigation
Given that buildings and infrastructure measures. Strategies that are common
have long anticipated lifetimes (sometimes to clusters of LGAs may be appropriately
more than 100 years), it is critical that such implemented at higher governance scales. In
assets are constructed not only to withstand many cases, broader co-benefits are likely to
future climate hazards, but to facilitate the arise from investments in resilience, such as
transition to a low-carbon economy. This is increased employment, increased business
also the case for land-use planning, which confidence and improved service reliability.
sets the direction for future investments
in infrastructure and buildings, and which
can substantially influence greenhouse gas
mitigation possibilities in sectors such as
transport.
The study above should be used to inform a
revised and strengthened national climate
and disaster resilience strategy and action
plan that significantly scales up efforts to
prevent hazards from turning into disasters,
and increases disaster response capacity.
Given that 90% of major disasters globally are
due to climate-influenced hazards, it makes
little sense to have separate strategies at the
Federal Government level for climate and
disaster resilience.21 COMPOUND COSTS:
HOW CLIMATE CHANGE IS DAMAGING AUSTRALIA’S ECONOMY
4. Annex A: Methods and
assumptions of the
agricultural and labour
productivity analysis
This study has built on previous work The potential damages from climate change
by Kompas et al. (2018) to ascertain in this computational platform are limited,
cumulative damages from climate principally to reduced agricultural and
change from 2017 to 2100 for 139 labour productivity, loss of arable land due
countries and more than 50 sectors or to sea level rise and some health impacts.
commodity groups (using the Global Reduced agricultural productivity arises
Trade Analysis Project Computable from a combination of variables, which are:
General Equilibrium Model). Results increasing average temperature, shifting
were obtained at various global precipitation patterns, rising atmospheric
temperature increases (2030, 2050 carbon concentrations and sea level rise
and 2100). (through reduced supply of arable land).
Reduced labour productivity arises from
increased heat stress, measured using a heat
stress index that takes both temperature and
humidity into consideration. Impacts on
labour productivity are modelled across three
sectors: agriculture, manufacturing and
services. Some additional health impacts are
included via the impacts of temperature on a
few disease types.CHAPTER 04 22
ANNEX A: METHODS AND ASSUMPTIONS OF THE AGRICULTURAL AND LABOUR PRODUCTIVITY ANALYSIS
The damage functions used in this study are The work focuses on a time path for local
very limited. Losses from floods, bushfires, temperatures that is consistent with a
storms and tropical cyclones, which are business-as-usual emissions trajectory (RCP
increasing in frequency and/or severity due 8.5) and draws baseline population and GDP
to climate change are not included. Other projections from a socioeconomic pathway
impacts of climate change on properties that assumes a doubling of global food
and infrastructure are also excluded, as demand, high level use of fossil fuels and a
are impacts on health via a range of other tripling of energy demand over the course of
pathways. Losses from these impacts could the century (SSP5). This is consistent with the
be substantial. Notably, the model does highest greenhouse gas emissions pathway.
not place any value on biodiversity and Damages are expressed in ‘real terms’ using
ecosystems, so these losses are not reflected a 5% discount rate to convert future losses
at any point in the costed damages (not even into current dollars. Values are expressed as
through contractions of some industries such the present values of cumulative damages
as nature-related tourism). Nevertheless, we up until each year (i.e. up until 2030, 2050
know these costs could be substantial. For and 2100). Annual damages are presented in
example, the Great Barrier Reef supports Figure 7 below.
64,000 jobs and contributes $6.4 billion to the
Australian economy per year (Deloitte 2017a).
Figure 7: Annual damages to the Australian economy from reduced labour productivity and agricultural productivity due to
climate change.
ANNUAL DAMAGES TO AUSTRALIA (AUD BILLIONS)
180
160
140
120
100
80
60
40
20
0
-20
80
20
68
86
89
98
44
50
26
29
62
92
38
83
56
59
65
95
23
32
35
47
53
74
77
41
17
71
20
20
20
20
20
20
20
20
20
20
20
20
20
20
20
20
20
20
20
20
20
20
20
20
20
20
20
2023 COMPOUND COSTS:
HOW CLIMATE CHANGE IS DAMAGING AUSTRALIA’S ECONOMY
5. Annex B: Methods
and assumptions
of the property
impacts analysis
To calculate the impact of climate The ability of the property to withstand
change on the property sector an an extreme event depends on the
assessment of all of the 15 million design, engineering and materials used
addresses in Australia was undertaken in construction and so a high and low
(PSMA 2019). Each property was tested vulnerability test have been executed. In
against six extreme weather hazards this study only the more conservative low
– flood, coastal inundation, bushfire, vulnerability results have been provided
wind storms, heat-waves and soil – which assumes homes are recently
subsidence (the sinking or settlement constructed and built to reasonably modern
of soil, which can occur as a result of design standards.
drought and other factors, and which
can affect building foundations). Looking forward, the number and type of
properties is assumed to remain stable – so
the possible effects of growth, planning
law and design standards are excluded. The
impacts of climate change have been based
on a number of atmospheric models based
on the IPCC RCP 8.5 scenario (e.g. MIROC3.2
and ECHAM5), which assumes greenhouse
gas emissions continue to increase at least
until mid-century. A sea level rise projection
of 1.6m by 2100 was used, which is above
the range in the IPCC’s fifth assessment
report (AR5), but about a metre lower than the
upper range put forward by the US National
Oceanic and Atmospheric Administration
(NOAA) – this is to accommodate recent
research regarding the greater significance
of melting ice sheets (NOAA 2017).CHAPTER 05 24
ANNEX B: METHODS AND ASSUMPTIONS OF THE PROPERTY IMPACTS ANALYSIS
To obtain more geographically accurate A property was classified as effectively
data we used Regional Climate Model uninsurable if the annual average loss
(RCM) downscaling from the University exceeded 1% of the property value (for
of New South Wales and the University of example an annual average loss more than
Queensland, as well as high-resolution flood $10,000 per year for a property worth $1
modelling data from Ambiental (UK) and million). The results were aggregated to show
laser elevation models from Geosciences the number of properties in this category in
Australia. Bushfire maps were drawn from each local government area. Property value
the rural fire services (or equivalent) in each corrections were based on recalculating the
state and subsidence risk was drawn from size of the mortgage that could be serviced
state and national soil classification maps – if the increased annual average loss was re-
climate impacts were computed by looking diverted to insurance premiums – based on
at the projected changes to the days of high current standard variable interest rates.
Forest Fire Danger Index (FFDI). Coastal
inundation data was based on national tide
gauges, CSIRO modelling of wave height
distributions and sea level rise projections
using standard joint probability mathematics.
The financial impacts computed were based
on the projected probability of damage
to each element of each property (e.g.
foundations, floors, electrical, rood etc.)
and their replacement costs, for each of the
hazards and for each year of the century.
These costs were summed to provide an
annual average loss for each property – the
basis of an insurance premium. The costs for
all properties was then aggregated at different
points in time.You can also read