Comprehensive Reliability Plan 2019-2028 - A Report from the New York Independent System Operator - NYISO
←
→
Page content transcription
If your browser does not render page correctly, please read the page content below
2019-2028
Comprehensive
Reliability Plan

                       A Report from the
                   New York Independent
                        System Operator

              Draft Report for April 12, 2019 ESPWG/TPAS
Table of Contents
EXECUTIVE SUMMARY ........................................................................................................................................................ 4
INTRODUCTION ................................................................................................................................................................... 7
RELIABILITY PLANNING PROCESS FINDINGS FOR 2019-2028 ................................................................................................ 8
              Finding One – Resource Adequacy .............................................................................................. 8

              Finding Two – Transmission Security ........................................................................................... 8

              Finding Three – Plan Risk Factors and Highlights of Potential Developments ......................... 8

PEAKER RULE SCENARIO .................................................................................................................................................... 14
              Con Edison Assessment............................................................................................................. 15

                         Year 2023 ...................................................................................................................................................... 16
                         Year 2025 ...................................................................................................................................................... 17
                         System Operations Impact ............................................................................................................................ 18
              PSEG Long Island Assessment .................................................................................................. 19

                         Year 2023 ...................................................................................................................................................... 19
                         Year 2025 ...................................................................................................................................................... 20
                         System Operations Impact ............................................................................................................................ 22
              Bulk Power Transmission Security ............................................................................................ 25

              Resource Adequacy .................................................................................................................... 25

              Peaker Rule Scenario Conclusions ........................................................................................... 28

2019-2028 CRP RECOMMENDED ACTIONS ........................................................................................................................ 30
              Monitor and Track Potential New Developments ..................................................................... 30

              Monitor and Track Transmission Owner Plans ......................................................................... 30

              Continue Coordination with the New York State Public Service Commission ........................ 30

              Monitor Changes That Could Impact Risk Factors ................................................................... 31

              Reliability Planning Process Conclusions ................................................................................. 31

APPENDIX A – RELIABILITY PLANNING PROCESS ................................................................................................................ 33
APPENDIX B – STATUS OF TRACKED MARKET-BASED SOLUTIONS & TOS’ PLANS ............................................................... 38
APPENDIX C – SUMMARY OF THE 2018-2019 RPP MAJOR ASSUMPTIONS ......................................................................... 39
APPENDIX D – SUMMARY OF PSEG LONG ISLAND PEAKER RULE SCENARIO ...................................................................... 45

DRAFT – FOR DISCUSSION PURPOSES ONLY                                                                                 NYISO 2019-2028 Comprehensive Reliability Plan | ii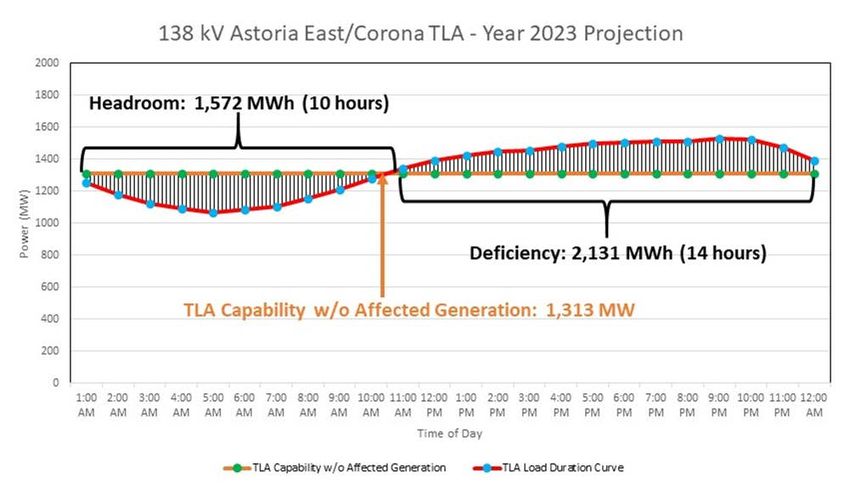
List of Figures
Figure 1: Aging Fossil Fuel Nameplate Capacity: Gas Turbines & Steam Turbines Nearing Retirement ................................... 11
Figure 2: Peaker Rule Scenario – Assumed Zonal MW Removal ............................................................................................... 14
Figure 3: Astoria East / Corona 138 kV TLA ............................................................................................................................... 15
Figure 4: Greenwood / Fox Hills 138 kV TLA .............................................................................................................................. 16
Figure 5: Astoria East/Corona TLA Load Duration Curve ........................................................................................................... 17
Figure 6: Greenwood/Fox Hills TLA Load Duration Curve ......................................................................................................... 18
Figure 7: PSEG Long Island Load Pockets and Interfaces........................................................................................................... 19
Figure 8: East End Load Pocket Load Duration Curve ................................................................................................................ 21
Figure 9: South Western Suffolk (East of Holbrook) Load Duration Curve ................................................................................ 21
Figure 10: Barrett Load Pocket Load Duration Curve ................................................................................................................ 22
Figure 11: Additional SENY Overloads ....................................................................................................................................... 25
Figure 12: NYCA LOLE Results (days/year)................................................................................................................................. 26
Figure 13: Peaker Scenario Zonal Compensatory MW .............................................................................................................. 27
Figure 14: Examples of Compensatory MW Combinations (between Zones J and K) ............................................................... 28
Figure 15: NYISO’s Comprehensive System Planning Process (CSPP) ....................................................................................... 36
Figure 16: NYISO Reliability Planning Process ........................................................................................................................... 37
Figure 17: Current Status of Tracked Market- Based Solutions & TOs’ Plans............................................................................ 38
Figure 18: Summary of Changes from the 2018 RNA Base Case to the CRP Base Case ............................................................ 39
Figure 19: NYCA Peak Load and Resource Ratios 2019 through 2028 in the CRP Base Case .................................................... 40
Figure 20: Generation Additions Included in the 2018 RNA and CRP Base Cases ..................................................................... 41
Figure 21: 2018 RNA Base Case - Generation Deactivations Assumptions ............................................................................... 42
Figure 22: Firm Transmission Plans Included in 2018 RNA Base Case (230 kV and above*) ..................................................... 43
Figure 23: Summary of Year 2023 PSEG Long Island Transmission Security Violations ............................................................ 45
Figure 24: Summary of Year 2025 PSEG Long Island Transmission Security Violations ............................................................ 46

DRAFT – FOR DISCUSSION PURPOSES ONLY                                                                         NYISO 2019-2028 Comprehensive Reliability Plan | iii
Executive Summary
         This Comprehensive Reliability Plan (CRP) concludes that the New York State Bulk Power
Transmission Facilities will meet all applicable Reliability Criteria over the 2019 through 2028 study
period. The CRP completes the 2018-2019 cycle of the NYISO Reliability Planning Process.

         The NYISO initiated the CRP after the NYISO Board approved the 2018 Reliability Needs Assessment
(RNA) in October 2018. The 2018 RNA assessed the resource adequacy and transmission security of the
New York State Bulk Power Transmission Facilities from 2019 through 2028. The final 2018 RNA
identified no Reliability Needs.

         While the NYISO concludes that long-term reliability needs have been satisfied in this cycle of the
Reliability Planning Process, the margin to maintain reliability could narrow or be eliminated over the ten-
year study period based upon changes in assumptions. Potential risk factors, such as generator
unavailability, generator deactivations, external control area capacity sales, delay in proposed resource
additions or transmission plans, or higher load levels, could potentially lead to transmission security or
resource adequacy violations.

         These risks are mitigated by the fact that the NYISO’s markets are designed to send appropriate price
signals for new market entry of resources that may assist in maintaining reliability. In addition, the
potential risks and resource needs identified in the scenario analyses in the 2018 RNA may be resolved by
new capacity resources coming into service, construction of additional transmission facilities, and/or
increased energy efficiency, distributed energy resources, and demand response.

         Importantly, a number of recent state policies and initiatives, along with various Department of
Environmental Conservation (DEC) rulemakings are underway that have the potential to significantly
change the generation resource mix in the New York Control Area. These include the Clean Energy
Standard, the Offshore Wind Master Plan, the Large-Scale Renewable Program and the Zero Emission
Credits Program for the James A. FitzPatrick, R.E Ginna and Nine Mile Point nuclear power plants. The
NYISO will continue to monitor these and other developments to determine whether changing system
resources and conditions could impact the reliability of the New York bulk electric grid.

         This CRP includes, for information, an assessment of the impacts to system reliability from the
potential deactivation of all generators impacted by the DEC’s proposed rulemaking to control oxides of
nitrogen (NO X ) emissions from simple cycle and regenerative combustion turbines (Peaker Rule 1).

1   The rulemaking is still in progress at this time; therefore, the scenario is based on assumptions, and it is for information only.

DRAFT – FOR DISCUSSION PURPOSES ONLY                                                                NYISO 2019-2028 Comprehensive Reliability Plan | 4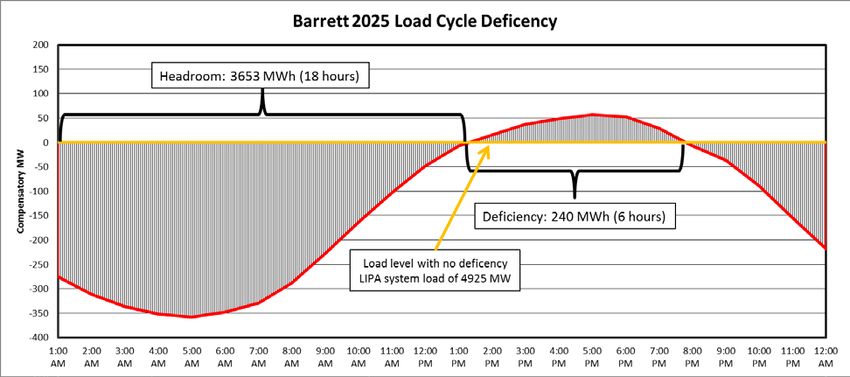
The rule may impact approximately 3,300 MW (nameplate) of simple cycle combustion turbines, mostly
located in New York City (Zone J) and Long Island (Zone K). 2 The first implementation phase in 2023
would affect approximately 2,200 MW, with an additional 1,100 MW of units affected in 2025. For this
scenario, the remaining coal plants in New York State are assumed to be retired based upon the DEC’s rule
setting carbon dioxide emission requirements for existing fossil-fueled generators. This assessment is
provided to assist market participants and policy makers to understand the potential reliability impacts if
the affected generators deactivate. The NYISO will continue to monitor the DEC rulemaking processes and
will further consider any implications to system reliability in the 2020 Reliability Needs Assessment. The
results, as prepared in collaboration with Con Edison and PSEG Long Island, identify potential system
deficiencies as detailed in the body of this report; key observations are summarized below.

        If all of the generators affected by the peaker rule were to deactivate without the addition of
replacement resources or system reinforcements, the transmission system would be unable to reliably
serve the forecasted load within specific pockets in New York City and Long Island, as well as across
Southeast New York. Starting in 2023 with the first implementation phase of the rule, pockets in New York
City would be deficient of supply for up to 14 hours in a given day at a peak amount of 240 MW. Pockets in
Long Island would be deficient by 320 MW for up to 15 hours in a given day. With full implementation of
the peaker rule assumed in 2025, the New York system as a whole would significantly exceed the threshold
of one loss of load event in ten years due to a supply deficiency of at least 700 MW in Southeast New York.
At the same time, the Con Edison and Long Island local system deficiencies would increase to a total of 660
MW in New York City and 620 MW in Long Island.

        Additionally, system operations reliability issues would arise related to the potential deactivation of
the affected peaking generators. These include limited black start and system restoration capability,
difficulty scheduling maintenance outages, degraded system voltage performance, and a greater level of
resource commitment and dispatch within the New York City and Long Island load pockets.

        The deficiencies could potentially be met by a number of combinations of solutions including
generation, transmission, and demand-side (e.g., energy efficiency, demand response) measures. However,
due to the loss of load events projected in Southeast New York, local transmission upgrades within New
York City and Long Island alone would not fully address the deficiencies. Replacement resources would be
required to resolve the identified reliability deficiencies. At the same time, any solutions located solely
outside the load pockets identified by Con Edison and PSEG Long Island would not fully resolve the needs
on their own, as the local deficiencies would not be addressed. Solutions would need to resolve the

2 As   compared with the CRP base case assumptions.

DRAFT – FOR DISCUSSION PURPOSES ONLY                                    NYISO 2019-2028 Comprehensive Reliability Plan | 5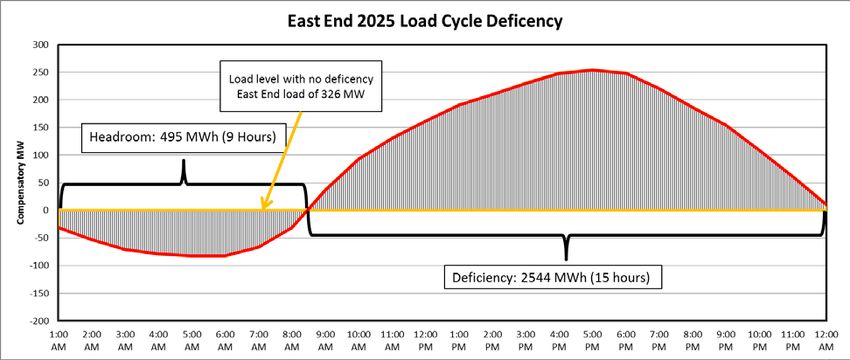
identified deficiencies for both the peak amounts and for the durations specified.

     Finally, it is important to note that the NYISO continuously plans its system to address potential
reliability needs. In the event that there is a potential loss of resources due to a proposed generator
retirement or mothballing, the NYISO will administer its Generator Deactivation Process for Generator
Deactivation Notices that it receives. If necessary, the NYISO will seek solutions to address any Reliability
Needs identified through that process. For generators affected by the peaker rule, the NYISO could enter
into Reliability Must Run agreements with specific generators to continue to operate for a two-year period,
with a possible two-year extension, until market-based or permanent transmission solutions are built.
Moreover, the NYISO continuously monitors all planned projects and any changes to the New York State
transmission system, and may request solutions outside of its normal planning cycle if there appears to be
an imminent threat to the reliability of the bulk power transmission system arising from causes other than
deactivating generation.

     The next cycle of the Reliability Planning Process will begin in 2020, for which preparation will begin
in late 2019. The 2020 RNA will provide a new ten-year reliability assessment of the New York Bulk Power
Transmission Facilities based on updated assumptions, and will review the status of the risk factors
discussed in this CRP, together with other reliability issues.

DRAFT – FOR DISCUSSION PURPOSES ONLY                                 NYISO 2019-2028 Comprehensive Reliability Plan | 6
Introduction
The 2018 Reliability Needs Assessment (RNA) is the first step of the NYISO’s 2018-2019 Reliability
Planning Process (RPP). This Comprehensive Reliability Plan (CRP) follows the 2018 RNA and completes
the 2018-2019 cycle of the Reliability Planning Process. The 2018 RNA was approved by the NYISO Board
of Directors in October 2018.
Using the 2018 RNA Base Case developed in accordance with the NYISO’s procedures, the RNA
assessed both the resource adequacy and transmission security of the New York State Bulk Power
Transmission Facilities (BPTF) from year 2019 through 2028, the “Study Period” of this 2018 Reliability
Planning Process.
This report summarizes the findings of the Reliability Planning Process and sets forth the NYISO’s
2019-2028 Comprehensive Reliability Plan.
DRAFT – FOR DISCUSSION PURPOSES ONLY NYISO 2019-2028 Comprehensive Reliability Plan | 7Reliability Planning Process Findings for 2019-2028
The Reliability Planning Process (i.e., collectively the RNA and the CRP) findings and risk factors for
2019-2028 are summarized below.
Finding One – Resource Adequacy
There are sufficient resources in the RNA and CRP 3 base cases to meet the resource adequacy criterion
for the entire ten-year Study Period. The needs will be revisited in subsequent cycles of the Reliability
Planning Process.
The CRP base cases were updated to capture status changes since the RNA Base Case (captured in
Figure 18).
Finding Two – Transmission Security
There are no Reliability Needs identified in the RNA or CRP base cases as result of this assessment.
As an initial step to the 2018 RNA, the NYISO provided preliminary results to stakeholders and sought
any material updates that could address the preliminary Reliability Needs. Preliminary evaluations
identified a transmission security Reliability Need on a BPTF facility in eastern Long Island (i.e., the
Brookhaven to Edwards Ave. 138 kV line). PSEG Long Island subsequently proposed terminal upgrades at
the Brookhaven 138 kV Substation, (to be in-service by June 2019), which resolved the overload.
Additionally, thermal overloads were identified for 2019 in National Grid and Orange & Rockland service
territories. These transmission owners will address the overloads with local transmission upgrades that
were previously identified in the 2018 Gold Book (also listed in Figure 17), and will use interim operating
procedures to maintain the security of the system until the local transmission upgrades are placed in-
service. Details of these 2019 thermal overloads and the associated local transmission upgrades are
provided in the 2018 RNA. Therefore, no Reliability Needs were ultimately identified in the 2018 RNA.
The status of the local transmission owner plans will continue to be monitored by the NYISO.
Finding Three – Plan Risk Factors and Highlights of Potential Developments
Findings One and Two reflect the base case assumptions, which were set in accordance with NYISO’s
procedures. There are, however, risk factors that could adversely affect the implementation of the plan and
hence system reliability over the ten-year planning horizon. If any of these factors materialize, the NYISO
will assess the potential impacts and, if necessary, perform an evaluation to determine whether the NYISO
should solicit solutions under the Generation Deactivation Process or Gap Solution process, as required.
3 Updates from the RNA to the CRP cases are in Figure 18
DRAFT – FOR DISCUSSION PURPOSES ONLY NYISO 2019-2028 Comprehensive Reliability Plan | 8The risk factors include:
1. Changes to System Resources
Substantial uncertainties exist in the next ten years that will impact the system resources. These
uncertainties include, but are not limited to:
a) The base cases include approximately 1,600 MW of assumed generation additions in various
planning stages, and approximately 1,150 MW of assumed deactivations (see Appendix C for
details). If expected capacity resources do not materialize, the New York resource adequacy margin
(as measured by comparison with the loss of load expectation criterion of 0.1 days per year) will
decrease.
b) If additional generating units become unavailable or deactivate beyond those units already
contemplated in the 2018 RNA (listed in the Appendix C of this report), the reliability of the New
York Control Area (NYCA) could be adversely affected. The NYISO recognizes that there are
numerous risk factors related to the continued financial viability, compliance with emissions
requirements, and operation of aging generating units. Depending on the units affected, the NYISO
may need to take actions through its Generation Deactivation Process to maintain reliability. The
scenarios performed as part of the RNA indicated that the deactivation of generators could lead to
reliability needs.
To further inform stakeholders of such potential future reliability needs, the NYISO evaluated the
reliability impacts of a proposed DEC rule to limit emissions from approximately 3,300 MW
(nameplate) of peaking units, which are mostly located in New York City and Long Island. The
findings are described in detail in the “Peaker Rule Scenario” section.
c) Capacity resources could decide to offer into markets in other regions and, therefore, some of the
capability of those resources may not be available to the NYCA. Accordingly, the NYISO will
continue to monitor imports, exports, generation and other infrastructure.
d) There are a number of public policy transmission developments in progress, which if they
materialize, will increase the system capability to transport power:
■ The Western NY Public Policy Transmission Project (the Empire State Line Proposal 1), to be
developed by NextEra Energy Transmission New York, Inc., was selected by the NYISO Board
in October 2017 and is included in the 2018 RNA Base Case. This project includes a new 345
kV circuit and phase angle regulator (PAR) that will alleviate constraints in the Niagara area.
The planned in-service date for this project is Summer 2022.
DRAFT – FOR DISCUSSION PURPOSES ONLY NYISO 2019-2028 Comprehensive Reliability Plan | 9■ The solutions to the AC Transmission Public Policy Transmission Needs were not reflected in
the 2018 RNA base case, as the Public Policy Transmission Planning Process evaluation was
still ongoing. As defined by the New York Public Service Commission (PSC), the solutions will
significantly increase the transfer capability over key transmission paths (i.e., from central New
York through the Capital Region increasing the Central East interface by at least 350 MW and
from upstate New York to the lower Hudson Valley increasing the UPNY-SENY interface by at
least 900 MW). Selection of the more efficient or cost effective solutions to these needs are
currently under consideration by the NYISO’s Board of Directors and stakeholders
(Placeholder; to be updated following Board decision).
■ The NYISO initiated the 2018-2019 Public Policy Transmission Planning Process cycle on
August 1, 2018 by issuing a solicitation for proposed transmission needs driven by Public
Policy Requirements. Following the NYISO’s submittal of the proposals to the PSC, the NYISO
filed comments, stating that additional transmission will be needed in order to achieve the
various goals of the State’s Clean Energy Standard. If the PSC determines that there is a need
for transmission, the NYISO will solicit projects from developers to fulfill that need.
2. Completion of Local Transmission Owner Plans
The local transmission owner plans (LTPs) are an important part of the overall Comprehensive System
Planning Process and the findings of this CRP. The NYISO will continue to track the timely entry into
service of projects that have been identified to relieve reliability violations (e.g., Clay-Pannell 345 kV
upgrades, Oakdale 345 kV transformer and substation upgrades, Lovett 345kV/138kV station, Clay‐Teall
115 kV and Clay‐Dewitt 115 kV lines reconductoring).
3. Changes to System Performance
As generators age and experience more frequent and longer duration outages, the costs to maintain
the asset increase. This may drive aging generation into retirement. A growing amount of New York’s gas-
turbine and fossil fuel-fired steam-turbine capacity is reaching an age at which, nationally, a vast majority
of similar capacity has been deactivated. As shown in Figure 1, by 2028 more than 8,300 MW of gas-
turbine and steam-turbine based capacity in New York will reach an age beyond which 95% of these types
of capacity have deactivated.
DRAFT – FOR DISCUSSION PURPOSES ONLY NYISO 2019-2028 Comprehensive Reliability Plan | 10Figure 1: Aging Fossil Fuel Nameplate Capacity: Gas Turbines & Steam Turbines Nearing Retirement
Steam Turbine capacity in operation for 62.5 years or more Gas Turbine capacity in operation for 46 years or more
9,000
8,000
7,000
3,403
6,000
3,403 3,403
5,000
3,403
4,000 3,403 3,403 3,403
3,000 3,119
2,818 2,836 4,898
2,000 2,356 3,871 3,871
2,496 2,883
1,000 2,308 2,308
1,597
866 866 1,054
0
2018 2019 2020 2021 2022 2023 2024 2025 2026 2027 2028
Source: 2018 Power Trends -
4. Changes to System Load Level
In conducting a scenario with a topline load forecast approximately 3,100 MW higher than the baseline
forecast, the NYISO found that the loss of load expectation (LOLE) would be at or above 0.1 days per year
starting in 2025. As a result, a higher-than-forecasted load level could expose the system to potential
reliability issues, necessitating interim operating procedures up to and including measures such as load
shedding in some localized areas of the state. However, based upon the 2018 forecast, the peak demand
trends in New York are forecasted to experience the lowest rate of annual growth in the history of the
NYISO. The NYISO also forecasts that, as forecast in 2018, statewide energy use — reflecting the effects
from increased energy efficiency and customer-based distributed energy resources (DERs) — will decrease
from current levels over the ten-year planning horizon.
In the past decade, energy provided by the bulk grid has decreased, while energy production from
DERs, such as solar, has increased. These DERs are beginning to displace energy that was traditionally
supplied by conventional generation through the regional electricity grid, and the energy provided by many
DERs is not continuous, but intermittent, and less visible to the NYISO markets and operations. Also,
included in the NYISO’s 2018 data is a forecast of the cumulative impacts of electric vehicles on energy
usage and peak demand. Electric vehicles are forecasted to increase peak demand on the system absent
incentives for consumers to charge vehicles off-peak.
The NYISO will continue to report on energy usage and peak demand trends in its annual Load and
DRAFT – FOR DISCUSSION PURPOSES ONLY NYISO 2019-2028 Comprehensive Reliability Plan | 11Capacity Data Report (“Gold Book”).
5. Natural Gas Coordination
New York’s reliance on natural gas as the primary fuel for electric generation justifies continued
vigilance regarding the status of the natural gas system. The NYISO is actively involved in natural
gas/electric coordination efforts with New York State and federal regulators, pipeline owners, generator
owners, local distribution companies, and neighboring ISOs and Regional Transmission Operators (RTOs).
The NYISO’s efforts with respect to gas supply assurance focus on: (i) improving communication and
coordination between the gas and electric sectors; (ii) annual, weekly and, when conditions warrant, ad hoc
generator surveys of fuel supplies to enhance awareness in the control room and provide electric system
reliability benefits; and (iii) addressing the electric system reliability impact of the sudden catastrophic loss
of gas.
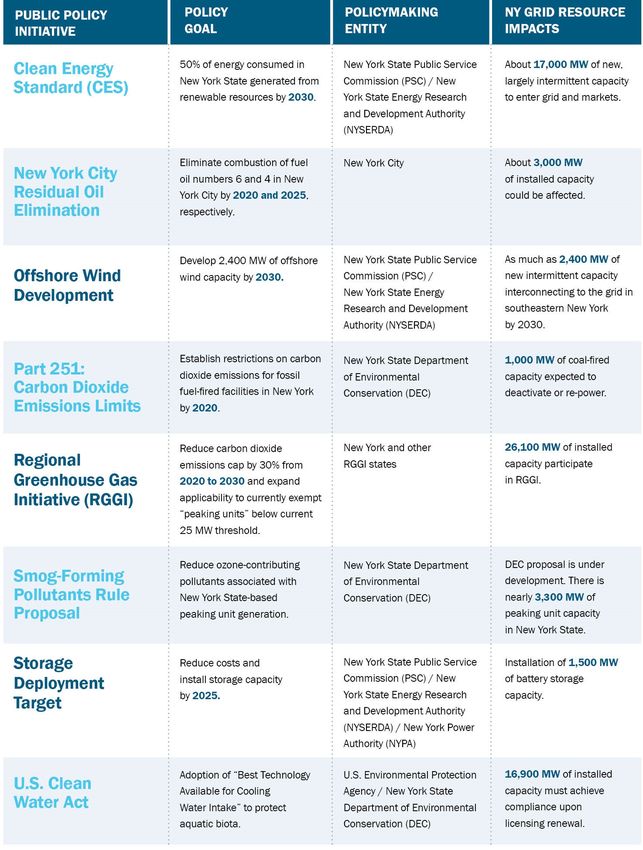
6. Federal, State, and Local Environmental Regulations
Federal, state and local government regulatory programs may impact the operation and reliability of
the New York bulk electric grid. Compliance with regulatory initiatives and permitting requirements may
require investment by the owners of New York’s existing thermal power plants. If the owners of those
plants have to make considerable investments, the cost of these investments could impact whether they
remain available in the NYISO’s markets and therefore potentially affect the reliability of the bulk system.
The purpose of this section is to review the status of regulatory programs and their potential grid impacts.
The impactful regulatory programs — each at various points in the development and implementation —
are summarized on the next page.
DRAFT – FOR DISCUSSION PURPOSES ONLY NYISO 2019-2028 Comprehensive Reliability Plan | 12DRAFT – FOR DISCUSSION PURPOSES ONLY NYISO 2019-2028 Comprehensive Reliability Plan | 13
Peaker Rule Scenario
     The New York State Department of Environmental Conservation (DEC) has initiated a process to
develop a regulation to limit nitrogen oxide (NO X ) emissions from simple cycle and regenerative
combustion turbines (“peaking units”). In June 2018, the DEC posted a “Stakeholder Draft” outlining a
proposed rule prior to initiating formal rulemaking (the “Peaker Rule 4”). On February 27, 2019 the DEC
formally issued the proposed rule for comment. The proposed rule would establish new emission limits
that would become effective May 1, 2025, while beginning May 1, 2023 units must meet a NO X emission
rate of 100 ppm during the ozone season for applicable units which test above 100 ppm.

     Based on available emission data, these limits would affect approximately 3,300 MW (nameplate) of
peaking units, almost entirely located in New York City and Long Island. The first implementation phase in
2023 would affect approximately 2,200 MW, with an additional 1,100 MW of units affected in 2025. In
anticipation of DEC’s formal rulemaking, the NYISO initiated a study in coordination with Con Edison and
PSEG Long Island to assess potential reliability impacts of such a rule. The objective of this scenario is to
identify potential reliability issues that may result if all affected generators were to deactivate without
replacement, and to describe the nature of those reliability issues as guidance for market participants to
proactively consider possible market-based solutions. As part of this scenario the remaining coal plants in
New York State are also assumed to be retired based upon the DEC’s rule setting carbon dioxide emission
requirements for existing fossil-fueled generators. 5

     Figure 2 below summarizes the amount of generation removed as part of this scenario relative to the
base case.

                                  Figure 2: Peaker Rule Scenario – Assumed Zonal MW Removal

                                       Rem oved in 2023 & 2024          Additional M W rem oved starting            Total Rem oved by 2025
                                         (starting 2021 for coal)       2025 (throughout the study period)

                                    N am e Plate     IC AP     DM N C   N am e Plate    IC AP      DM N C       N am e Plate   IC AP   DM N C

      C oal          Zone A & C          810         840          840        0            0           0             810        840      840
  Peak ing Units      Zones A-I          132         107          107        0            0           0             132        107      107
                        Zone J          1,066        841          846       692          582         585           1,758       1,423   1,431
                       Zone K           1,039        960          968       406          389         389           1,445       1,349   1,357
                                                                                       Total (including Coal)      4,145       3,719   3,735
                                                                                  Total Peak ing Units Only        3,335       2,879   2,895

          4   https://www.dec.ny.gov/docs/air_pdf/scctdraft.pdf
          5   https://www.dec.ny.gov/regulations/113501.html

DRAFT – FOR DISCUSSION PURPOSES ONLY                                                     NYISO 2019-2028 Comprehensive Reliability Plan | 14
The NYISO, Con Edison, and PSEG Long Island collaborated in evaluating the potential reliability
impacts of this scenario. As described in the following sections, Con Edison and PSEG Long Island each
evaluated the transmission security and operational impacts in their service territory, and NYISO evaluated
the transmission security and resource adequacy of the bulk system, utilizing the Con Edison and PSEG
Long Island findings as input. For the NYISO assessments, statewide coincident peak load values are used.
For the Con Edison and PSEG Long Island assessments, non-coincident peak loads are used, as determined
by Con Edison and PSEG Long Island for each load pocket/transmission load area (TLA).
Con Edison Assessment
The transmission security criteria violations observed in the Con Edison service territory are primarily
due to deficiencies that are observed in the Astoria East/Corona 138 kV TLA and the Greenwood/Fox Hills
138 kV TLA.
Figure 3 shows the high-level topology of the Astoria East/Corona 138 kV TLA. The boundary feeders
for this TLA include the feeders from the Hell Gate, Astoria Annex, Rainey, and Jamaica substations.
Figure 3: Astoria East / Corona 138 kV TLA
Figure 4 shows the high-level topology for the Greenwood/Fox Hills 138 kV TLA. The boundary
feeders for this TLA include the feeders from the Vernon, Gowanus, and Fresh Kills substations.
DRAFT – FOR DISCUSSION PURPOSES ONLY NYISO 2019-2028 Comprehensive Reliability Plan | 15Figure 4: Greenwood / Fox Hills 138 kV TLA
Year 2023
In 2023, thermal overloads are observed on the Astoria East/Corona 138 kV TLA boundary feeders,
which are designed to a second contingency (N-1-1-0) based on the applicable Con Edison local design
criteria.
As shown in Figure 5, the Astoria East/Corona 138 kV TLA does not peak with the coincident system
peak 6. The maximum observed deficiency (i.e., compensatory MW) within this TLA is approximately 220
MW considering utilization of all available phase angle regulator (PAR) controls. Based on the load
duration curve (which is derived based upon historical data) and the capability of the TLA, the TLA may be
deficient by 2,131 MWh over a period of 14 hours on a given day.
In 2023, the East 75th area station is also observed to have a deficiency of about 20 MW under
contingency conditions on the distribution system.
6 The Gold Book assumes that the NYCA summer peak occurs from 4 p.m. to 5 p.m.
DRAFT – FOR DISCUSSION PURPOSES ONLY NYISO 2019-2028 Comprehensive Reliability Plan | 16Figure 5: Astoria East/Corona TLA Load Duration Curve
Year 2025
In 2025, no additional generation is removed from the Astoria East/Corona 138 kV TLA or East 75th
area station; therefore, the deficiency of about 220 MW for the Astoria East/Corona 138 kV TLA continues
to be observed as well as the East 75th area station deficiency of about 20 MW. Due to the magnitude of the
generation removed within the Greenwood/Fox Hills TLA, this TLA is observed to have a deficiency of
about 160 MW under normal conditions (N-0). Under contingency conditions (N-1 and N-1-1), BPTF
elements (including the Goethals – Gowanus 345 kV feeders 25 and 26 and Fresh Kills 345/138 kV
transformers TA1 and TB1) that are upstream of the TLA are also observed to be overloaded. The resulting
total deficiency for the Greenwood/Fox Hills TLA is approximately 420 MW.
As shown in Figure 6, the Greenwood/Fox Hills TLA peaks near the coincident system peak. The
maximum observed deficiency within this TLA is approximately 420 MW considering utilization of all
available PAR controls. Based on the load duration curve and the capability of the TLA, the TLA may be
deficient by 4,627 MWh over a period of 15 hours on a given day.
DRAFT – FOR DISCUSSION PURPOSES ONLY NYISO 2019-2028 Comprehensive Reliability Plan | 17Figure 6: Greenwood/Fox Hills TLA Load Duration Curve
System Operations Impact
Sufficient 10-minute reserve is essential for Con Edison to meet the applicable operations criteria. The
current reliability rules allow for the Con Edison underground transmission system circuits to be operated
for Normal Transfers (i.e., day-to-day operation) to their Short Term Emergency (STE) ratings. This
capability is dependent on being able to reduce the loading on a circuit to its Long Term Emergency (LTE)
rating within 15 minutes through the use of operating reserve and PAR adjustments, and not cause any
other facility to be loaded beyond its LTE rating.
As such, if resources that replace the affected units are not capable of providing 10-minute operating
reserve, there is an increased likelihood that the underground transmission system circuits would need to
be secured pre-contingency to LTE ratings rather than to STE. A result of operating to LTE ratings would
be a greater level of resource commitment and dispatch within the load pocket for a significant amount of
hours through the year. In addition, the ability to grant multiple maintenance outages of transmission
facilities and/or generation resources during off-peak periods would become more challenging.
Regarding the thunderstorm watch procedure, to the extent the resources are not replaced with
resources capable of providing 10 or 30-minute operating reserves, it will be more challenging to
redispatch the system in real-time to meet the more restrictive reliability criteria applied during
thunderstorms. This criteria requires that Con Edison operate its system as if the first contingency has
DRAFT – FOR DISCUSSION PURPOSES ONLY NYISO 2019-2028 Comprehensive Reliability Plan | 18already occurred on its northern transmission system when thunderstorms are within one hour of the
system or are actually being experienced. A greater level of commitment may be required to ensure
sufficient resources within the Con Edison system can respond in real-time for the duration of the storms.
The Thunderstorm Watch procedure would be unaffected by the deactivations under all in-service
scenario.
The deactivations would not have a consequential impact on the Con Edison system restoration plan
and loss of gas/minimum oil burn (LOG/MOB) program.
PSEG Long Island Assessment
Figure 7 provides a high level view of the Long Island load pockets. Units affected by the Peaker Rule
are located throughout the Long Island system ranging from Western Nassau to the East End of Long
Island.
Figure 7: PSEG Long Island Load Pockets and Interfaces
Newbridge Interface Holbrook Interface
Year 2023
In 2023, the most severe thermal overloads observed occur when the South Western Suffolk and East
End load pockets are at non-coincident peak load.
Figure 23 in Appendix D summarizes the 2023 thermal overloads observed in Long Island.
The highest observed loadings mostly occur when the East End load pocket is at its non-coincident
peak load. This impact results from the decrease in generation east of Holbrook forcing power transfer
from the west into the eastern part of the system. Because of this large transfer, the highest overload
DRAFT – FOR DISCUSSION PURPOSES ONLY NYISO 2019-2028 Comprehensive Reliability Plan | 19observed occurs when the system loses a large amount of capacity feeding the east (e.g., double circuit
contingencies).
In 2023, the total compensatory MW needed to resolve the Long Island system deficiency during peak
conditions is approximately 320 MW. For this assessment, the assumed compensatory MW resources have
a power factor of 0.95 leading and lagging. With the assumed reactive power injection from these sources,
no voltage criteria violations are observed.
Year 2025
In 2025, the most severe thermal transmission security violations are observed when the South
Western Suffolk, East End, and Barrett load pockets are at non-coincident peak load.
Figure 24 in Appendix D provides a summary of the 2025 thermal overloads observed in Long Island.
The transmission security results indicate additional thermal overloads on several BPTF transmission
circuits associated with the Y49 and Y50 ties due to the lack of on-island generation in the LIPA
transmission system. With a loss of either Y49 or Y50 as the first level contingency, the system will
experience a thermal rating violation on the remaining line (or other elements in series with these lines)
due to the lack of on-island generation in LIPA.
In 2025, the total compensatory MW needed to resolve all observed thermal overloads under peak
conditions in Long Island is approximately 620 MW. For this assessment, the assumed compensatory MW
sources have a power factor of 0.95 leading and lagging. With the assumed reactive power injection from
these sources, no voltage criteria violations are observed.
The deficiencies across the island can be broken up into three separate areas based off of the N-1 and
N-1-1 compensatory MW needs: East End, East of Holbrook and Barrett. The East End, Southwest Suffolk,
and Barrett load pockets required the most compensatory MW to resolve the observed transmission
security violations. The load curves shown below identify the headroom and deficiency capability for Long
Island. The load curves depict the overloads observed in the 2025 analysis and the compensatory MW
sources used to quantify the deficiency.
The East End load curve is based on the 2018 actual pocket load broken down by hour and scaled up to
the forecasted 2025 pocket non-coincident load. To find the load level with no deficiency in the East End
non-coincident base case, the LIPA load is reduced until there are no violations and the East End pocket
load level is recorded. The East End is unique in that it peaks at a different time than the rest of the system.
Because of this, the East End has its own load curve based on pocket load while the rest of the Long Island
system can use the system load curve. As a result, the East End compensatory MW would be required for
about 15 hours and supply 2,544 MWh of energy, with a peak deficiency of 250 MW. The East End load
DRAFT – FOR DISCUSSION PURPOSES ONLY NYISO 2019-2028 Comprehensive Reliability Plan | 20pocket load duration curve is shown in Figure 8.
Figure 8: East End Load Pocket Load Duration Curve
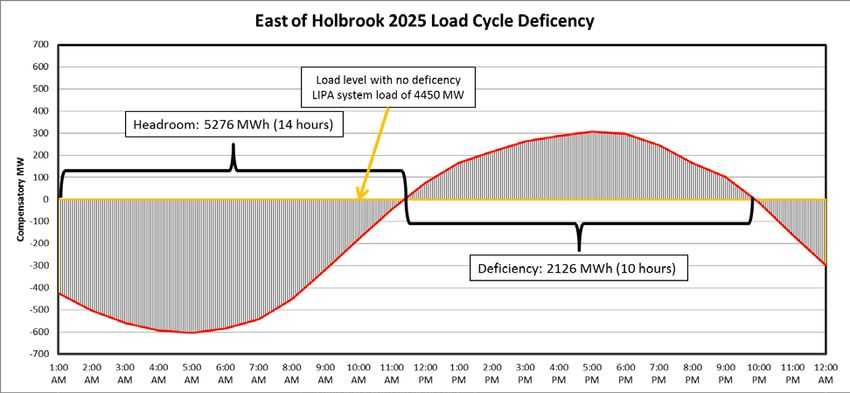
The East of Holbrook load curve was developed in a manner similar to the East End load curve
discussed above. The observed deficiency east of the Holbrook Interface (excluding the deficiency for the
East End load pocket discussed above), shown in Figure 9, requires compensatory MW for about 10 hours
and supply 2,126 MWh of energy. The peak deficiency observed for East of Holbrook is 310 MW.
Figure 9: South Western Suffolk (East of Holbrook) Load Duration Curve
DRAFT – FOR DISCUSSION PURPOSES ONLY NYISO 2019-2028 Comprehensive Reliability Plan | 21The deficiency in Barrett is local to the Barrett load pocket. As shown in Figure 10, the Barrett
compensatory MW would be required for about 6 hours and supply 240 MWh of energy, with a peak
deficiency of 60 MW.
Figure 10: Barrett Load Pocket Load Duration Curve
System Operations Impact
System Restoration Plan Impact
Peaking units are an integral part of the LIPA system restoration plan. The potential impacts of
deactivating these units include:
1. Loss of all black start units identified in the LIPA System Restoration plan reviewed by NYISO.
2. Loss of auxiliary power generators (APG)
3. Loss of emergency units for National Grid liquefied natural gas plant.
4. Loss of all dead bus capable units, used for local load pick-up. These are units capable of being
started and closing into a dead bus via onsite operator actions.
5. The near-complete loss of 10-minute and 30-minute quick start resources would delay the
restoration of customer load on Long Island. This is true whether or not another local black
start unit is identified.
6. The approximately 1,400 MW of 10 and 30-minute combustion turbines provides the majority
of the capacity to pick-up customer load within the first hours of a black out. Without these
DRAFT – FOR DISCUSSION PURPOSES ONLY NYISO 2019-2028 Comprehensive Reliability Plan | 22resources, PSEG Long Island would have limited load pick up capability until the return
of base load steam or combined cycle units or the NYCA restoration plan reaching the LIPA
control area.
Operational Flexibility
System operators work to secure the system before and after a fault. In order to do so, they rely on the
10 and 30-minute combustion turbines to provide dispatch flexibility. Potential impacts of the loss of these
resources without replacement include:
1. Reduced operational flexibility to secure for post-contingency LTE violations within 15 or 30
minutes.
2. Increase in commitment of units unable to respond within 10 or 30 minutes. These units will
need to be committed and dispatched for a significant amount of hours throughout the year to
secure pre-contingency to LTE ratings.
3. Increased constraints on allowing emergency maintenance outages of base-load generating
units during peak periods due to the need to have 10 and 30-minute reserves to address
possible deficiencies.
4. Loss of fuel diversity that combustion turbines provide during gas system events, including
locally-stored fuel and dual-fuel generators.
2025 Off-Peak Maintenance Outage Analysis
For the N-1-1 analysis of off-peak periods, the maintenance outage of a generator, transmission circuit,
or transformer followed by securing for single element and stuck breaker contingencies was evaluated.
This analysis monitored LIPA bulk electric system (BES) and non-BES elements. The analysis shows there
are 38 BES and 21 non-BES circuits simulated as first level maintenance outages that may cause an
overload on the LIPA non-BES system.
In the 2025 off-peak case, as a result of simulating a maintenance condition followed by an N-1 event,
there are no observed thermal overloads on BES elements but there are 22 non-BES thermal
overloads. Additionally, there are no observed BES voltage violations, however non-BES voltage violations
are observed.
Loss of Gas Impact
PSEG Long Island secures pre-contingency for loss of gas supply to the Northport Power Station to
prevent uncontrolled loss of load due to voltage collapse. The loss of gas supply will result in LTE and
Normal operating limit exceedances. The existing operating plan requires the dispatch of 10-minute
DRAFT – FOR DISCUSSION PURPOSES ONLY NYISO 2019-2028 Comprehensive Reliability Plan | 23combustion turbines to secure the LTE overloads. Should the Northport Power Station have a loss of gas
supply, the dynamic reactive support system (DRSS) voltage control devices respond to avoid voltage
collapse; however, additional generating units must be online within 20 minutes to provide additional
reactive power support to secure the system voltage. The dispatch of 30-minute units is necessary to
resolve the Normal rating overloads, in addition to correcting any net interchange increases due to the loss
of gas supply. Depending on the pre–contingency system load and generation dispatch, reductions to the
Con Edison wheel may also be necessary to secure Y50 from Normal rating overloads.
The deactivation of the affected simple-cycle units would render the system unable to secure for these
thermal violations post-contingency and recover system voltage to pre-contingency limits, and would
require additional use of oil at the Northport site to secure pre-contingency.
TVR Impact
Transient voltage recovery (TVR) is broken into two separate sections on the LIPA system, East of
Holbrook and East End. In accordance with PSEG-LI planning criteria, bus voltages must recover to 0.9 per
unit of nominal voltage within one second of the clearing of any fault and remain continuously above 0.9
per unit of the nominal voltage, excluding reoccurrence of a fault within this one second period. The loss of
the reactive power capability of the affected simple-cycle units would have a detrimental impact on
securing the system for TVR criteria.
All of the East End units are required to be dispatched regardless of the status of DRSS and dynamic
reactive power compensation system devices located at Canal and East Hampton substations. Removal of
any units will increase the amount of time that under voltage load shedding (UVLS) schemes are armed to
ensure the system voltage will not collapse. East of Holbrook TVR dispatch can still be maintained with
affected units removed, but it relies on the East End TVR dispatch assuming all units are available. No
additional units would be available for dispatch to make up for the reduced East End TVR dispatch.
Other Potential Issues
Several generators affected by the Peaker Rule are located on the low side of a 69/13.8 kV transformer
in their respective substations, potentially impacting the distribution transformers. Retirement of these
generators may require upgrades in the substation to increase the capacity of the transformers feeding the
13.8 kV systems. This may consist of a new 69/13.8 kV step-down transformer or replacement of the
existing transformers.
DRAFT – FOR DISCUSSION PURPOSES ONLY NYISO 2019-2028 Comprehensive Reliability Plan | 24Retirement of a generation resource and the associated generator step-up transformers (GSUs) can
potentially:
Impact short circuit currents that ultimately impact protective relaying systems/relay settings
due to lower fault currents.
Impact short circuit current levels which can subsequently modify or increase the “coupling”
between other generators and nearby high voltage direct current (HVDC) transmission
facilities (sub-synchronous torsional interaction for example).
Impact system grounding such that the ratings of existing lightning arresters may be
inadequate).
It is not known if GSUs would be retired with the affected generators; this assessment did not assess
the impact of retirement of the associated GSUs or any of the associated issues identified above.
Bulk Power Transmission Security
With the assumed reduction in generation resources in the Con Edison and Long Island service
territories, the NYISO’s analysis identified additional thermal overloads on the BPTF in 2025 in Southeast
New York (i.e., SENY), as listed in Figure 11. The overloads listed below would be resolved with the
addition of the AC Transmission Public Policy projects.
Figure 11: Additional SENY Overloads
Circuit Thermal Criteria Violation Type
Buchanan 345/138 kV (TA5) N-1-1
Lovett 345/115 kV N-1-1
Lovett – Buchanan South (Y88) 345 kV N-1-1
Ladentown – Lovett (Y88) 345 kV N-1-1
Athens – Pleasant Valley (91) 345 kV N-1-1
Leeds – Pleasant Valley (92) 345 kV N-1-1
Resource Adequacy
The NYISO conducted this resource adequacy scenario analysis using the updated CRP Base Case
as the starting point (i.e., the 2018 RNA7 Base Cases updated to capture status changes, highlighted
7 https://www.nyiso.com/documents/20142/2248793/2018-Reliability-Needs-Assessment.pdf/c17f6a4a-6d22-26ee-9e28-4715af52d3c7
DRAFT – FOR DISCUSSION PURPOSES ONLY NYISO 2019-2028 Comprehensive Reliability Plan | 25in Figure 18 in Appendix C). Figure 2 shows the total amount of generation assumed to be affected by
the DEC Peaker Rule for the purpose of this scenario, along with the removal of the last coal plants.
The loss of load expectation (LOLE) results for various cases are summarized in the Figure 12.
Figure 12: NYCA LOLE Results (days/year)
Peaker Case +
NYCA Peaker Local
Coincident Peaker Scenario + AC Compensatory
Peak Load Study Year CRP Base Scenario Transmission MW
32,857 2019 0.01 0.01 0.01 0.01
32,629 2020 0.00 0.00 0.00 0.00
32,451 2021 0.01 0.01 0.01 0.01
32,339 2022 0.01 0.01 0.01 0.01
32,284 2023 0.01 0.09 0.09 0.04
32,276 2024 0.01 0.09 0.07 0.04
32,299 2025 0.01 0.33 0.21 0.04
32,343 2026 0.01 0.36 0.23 0.04
32,403 2027 0.01 0.36 0.24 0.04
32,469 2028 0.01 0.38 0.26 0.06
While the CRP base cases are well under the LOLE criterion of one event in ten years (0.1 days/year),
the Peaker Rule scenario cases are very close (less than 50 MW away) to the criterion in 2023 when the
initial stage of affected generators are removed. Once the additional affected generators are removed in
2025, the criterion is significantly exceeded. When modeling the effects of the AC Transmission Public
Policy projects (T027 and T019) scheduled to be in-service in December 2023, the NYCA LOLE decreases,
but remains well above the 0.1 days/year criterion starting in 2025.
The last column in Figure 12 reflects the NYCA LOLE results assuming the local deficiencies identified
by Con Edison and PSEG Long Island are addressed with replacement generation or additional load
reduction in the amount of 640 MW in Zone J and 620 MW in Zone K. The results show that the NYCA LOLE
is well below the criterion with such local solutions in place.
While not reflected in the table, an additional simulation was performed assuming that all
transmission interface constraints through Southeast New York into Zones J and K were alleviated. The
results demonstrate that alleviating the transmission constraints in these corridors would only marginally
bring the NYCA LOLE to the 0.1 criterion, and such transmission interface upgrades would not address the
local load pocket deficiencies identified in Zones J and K.
Compensatory megawatt (MW) analysis was performed to quantify the shortfall (or alternatively, the
margin) of power by year and by zone, or combination of zones. Compensatory MW amounts are
DRAFT – FOR DISCUSSION PURPOSES ONLY NYISO 2019-2028 Comprehensive Reliability Plan | 26determined by adding generic perfect-capacity8 resources to zones to address the shortfall; 50 MW block
additions were used for this exercise to estimate the amount of resources generally needed within a given
zone (or combination of zones) in order to bring the NYCA LOLE back just below the reliability criterion of
0.1 days/year. The compensatory MW additions are not intended to represent specific solutions, as the
impact of specific solutions can depend on the type of the solution and its location on the grid. Resource
needs could potentially be met by combinations of solutions including generation, transmission, load
reductions (e.g., energy efficiency, demand response management, etc.).
Figure 13 below shows the compensatory MW when added all in one zone at a time, under two cases:
1. The Peaker Rule scenario: Under this scenario, 1,100 compensatory MW in Zone J would
bring the LOLE just below its criterion in 2028, while no amount of compensatory MW in
any other single zone would lower the LOLE below its criterion.
2. The Peaker Rule scenario with the AC Transmission Public Policy projects: Under this
simulation, either 850 MW in Zone J or 950 MW in Zone K would bring the NYCA LOLE just
below 0.1 days/year by 2028, while no other single zone could address the LOLE deficiency.
Figure 13: Peaker Scenario Zonal Compensatory MW
Peak er Scenario
Study Y ear N Y C A LOLE Zone A Zone B Zone C Zone D Zone E Zone F Zone G Zone H Zone I Zone J Zone K
2023 0.09 -250 -250 -300 -300 -300 -300 -300 -50 -50 -50 -50
2024 0.09 -200 -200 -250 -250 -250 -250 -250 -50 -50 -50 -50
2025 0.33 ∞ ∞ ∞ ∞ ∞ ∞ ∞ 1,150 1,150 850 ∞
2026 0.36 ∞ ∞ ∞ ∞ ∞ ∞ ∞ 1,200 1,200 900 ∞
2027 0.36 ∞ ∞ ∞ ∞ ∞ ∞ ∞ 1,250 1,250 900 ∞
2028 0.38 ∞ ∞ ∞ ∞ ∞ ∞ ∞ ∞ ∞ 1,100 ∞
Peak er Scenario +
AC Transm ission
Study Y ear N Y C A LOLE Zone A Zone B Zone C Zone D Zone E Zone F Zone G Zone H Zone I Zone J Zone K
2023 0.09 -250 -250 -300 -300 -300 -300 -300 -50 -50 -50 -50
2024 0.07 -650 -650 -950 -950 -950 -950 -950 -350 -350 -300 -250
2025 0.21 ∞ ∞ ∞ ∞ ∞ ∞ ∞ 950 950 600 550
2026 0.23 ∞ ∞ ∞ ∞ ∞ ∞ ∞ 1,050 1,050 650 600
2027 0.24 ∞ ∞ ∞ ∞ ∞ ∞ ∞ 1,150 1,150 650 650
2028 0.26 ∞ ∞ ∞ ∞ ∞ ∞ ∞ ∞ ∞ 850 950
Figure 14 below shows different combinations of minimum compensatory MW between Zones J and K:
one for the Peaker Rule scenario, and one for that scenario with the AC Transmission Public Policy projects.
For example, when placing 50% of the compensatory MW in Zone J and 50% in Zone K, a total of 1,000 MW
8 Perfect capacity is capacity that is not derated (e.g., due to ambient temperature or unit unavailability), not subject to energy durations limitations,
and not tested for transmission security or interface impacts. Actual resources may need to be larger in order to achieve the same impact as perfect-
capacity resources.
DRAFT – FOR DISCUSSION PURPOSES ONLY NYISO 2019-2028 Comprehensive Reliability Plan | 27would be needed in 2028 to bring the NYCA LOLE just below its criterion; with the AC Transmission, a total
of 700 MW would have similar effects.
Figure 14: Examples of Compensatory MW Combinations (between Zones J and K)
Study Peak er Scenario
Y ear N Y C A LOLE 100% J 75% J 25% K Total 50% J 50% K Total 25% J 75% K Total 100% K
2025 0.33 850 600 200 800 400 400 800 250 650 900 ∞
2026 0.36 900 600 200 800 400 400 800 250 700 950 ∞
2027 0.36 900 600 200 800 400 400 800 250 700 950 ∞
2028 0.38 1,100 750 250 1,000 500 500 1,000 300 850 1,150 ∞
Peak er Scenario
+ AC
Study Transm ission
Y ear N Y C A LOLE 100% J 75% J 25% K Total 50% J 50% K Total 25% J 75% K Total 100% K
2025 0.21 600 400 150 550 250 250 500 150 400 550 550
2026 0.23 650 450 150 600 300 300 600 150 450 600 600
2027 0.24 650 450 150 600 300 300 600 150 450 600 650
2028 0.26 850 550 200 750 350 350 700 200 550 750 950
Peaker Rule Scenario Conclusions
If all the generators affected by the Peaker Rule were to deactivate without the addition of
replacement resources or system reinforcements, the transmission system would be unable to reliably
serve the forecasted load within specific pockets in New York City and Long Island, as well as across
Southeast New York. Starting in 2023 with the first implementation phase of the rule, pockets in New York
City would be deficient of supply for up to 14 hours in a given day at a peak amount of 240 MW, while
pockets in Long Island would be deficient 320 MW possibly for 15 hours in a given day. With full
implementation of the Peaker Rule assumed in 2025, the New York system as a whole would significantly
exceed the threshold of one loss of load event in ten years due to a supply deficiency of at least 700 MW in
Southeast New York. At the same time, the Con Edison and Long Island local system deficiencies increase
to a total of 660 MW in New York City and 620 MW in Long Island.
Additionally, system operations reliability issues would arise related to the potential deactivation of
the generators affected by the Peaker Rule. These include limited black start and system restoration
capability, difficulty scheduling maintenance outages, degraded system voltage performance, and a greater
level of resource commitment and dispatch within the New York City and Long Island load pockets. The
NYISO, Con Edison, and PSEG Long Island system operations departments worked collaboratively to
identify the aforementioned concerns.
DRAFT – FOR DISCUSSION PURPOSES ONLY NYISO 2019-2028 Comprehensive Reliability Plan | 28You can also read


