CONNECTING NEW ZEALAND - A summary of the government's policy direction for transport
←
→
Page content transcription
If your browser does not render page correctly, please read the page content below
CONNECTING
    NEW ZEALAND
A summary of the government’s policy direction for transport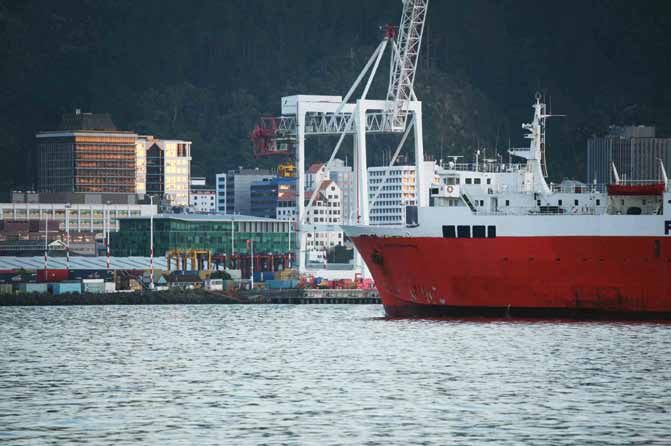
Major North Island transport network connections

                                               Rail to port connection

State highways (Vehicles per day)
                       More than 10,000
                        4,000 to 10,000
                         1,000 to 4,000
                              0 to 1,000
Ports (Imports & exports measured in tonnes)

                     More than 5 million

                                2–5 million

                      Less than 2 million
Major trade airport (International)

           More than 100,000 arrivals

             Less than 100,000 arrivals
Major South Island transport network connections

Rail to port connection

                                                       State highways (Vehicles per day)
                                                                              More than 10,000
                                                                               4,000 to 10,000
                                                                                1,000 to 4,000
                                                                                     0 to 1,000
                                                       Ports (Imports & exports measured in tonnes)

                                                                            More than 5 million

                                                                                       2–5 million

                                                                             Less than 2 million
                                                       Major trade airport (International)

                                                                  More than 100,000 arrivals

                                                                    Less than 100,000 arrivals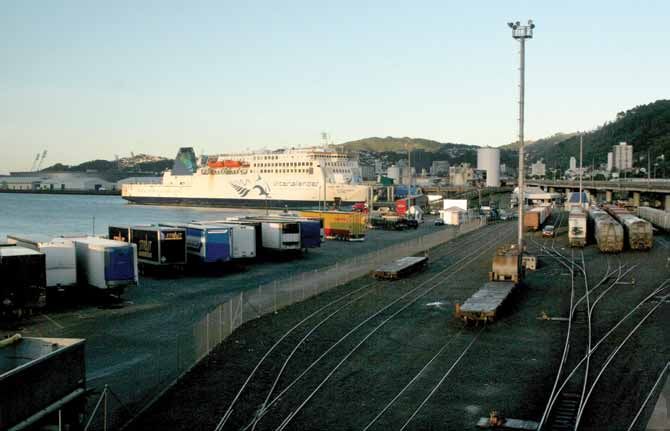
CONNECTING NEW ZEALAND

          CONTENTS
          Minister’s foreword                                            2

          Executive summary                                              3

          Purpose                                                        5

          New Zealand’s place in the world                               6

          State of our infrastructure                                    7

          Big issues for transport systems in the future                11

          Central and local governments’ role in the transport system   14

          The role of transport consumers                               16

          Key aspects of the government’s policy direction              18
             Economic growth and productivity                           18
             Value for money                                            19
             Road safety                                                19

          Mode by mode — the policy direction in practice               20
            Land transport infrastructure and services                  20
            Civil aviation                                              33
            Maritime transport                                          36
            Road safety                                                 40
          Photo credits 43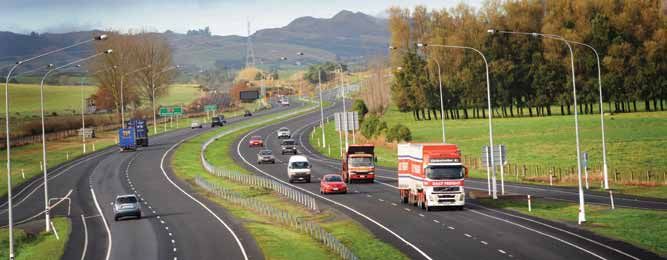
CONNECTING NEW ZEALAND /2

      Minister’s foreword
                                      Moving our freight and people as safely and efficiently as possible, with a
                                      minimum of hold ups, is vital to speeding up economic growth. Growing the
                                      economy is central to both:

                                      • the government’s overall goal for New Zealand — to grow the economy to
                                        deliver greater prosperity, security and opportunities for all New Zealanders
                                      • the government’s objective for transport — an effective, efficient, safe, secure,
                                        accessible and resilient transport system that supports the growth of our
                                        economy, in order to deliver greater prosperity, security and opportunities for
                                        all New Zealanders

      The transport system is an important enabler of economic             As a trading nation, we need to make sure that access to our
      growth and all that it can provide for all New Zealanders. The       key rail hubs, air and sea ports remain free moving. These are
      government has been working hard over the last 2 or so years to      the lifeline of our exporting businesses and we need efficient
      ensure that transport agencies are focused on our three priorities   aviation and maritime sectors that can meet the changing needs
      for transport: economic growth and productivity; value for           of our businesses.
      money and road safety. These are the areas that we need to see
      the greatest improvement from in the transport system over the       For our urban centres, public transport is important in
      next decade.                                                         reducing congestion and providing access and mobility to our
                                                                           communities. We want to grow public transport patronage but
      Connecting New Zealand is intended to help transport                 reduce its reliance on government subsidies. We also recognise
      stakeholders to better understand what the government is             the role that walking and cycling play for many New Zealanders.
      seeking from the transport system. It does that by drawing
      together the government’s transport policy direction as set out      Each of the transport modes needs to operate efficiently to meet
      in a number of guidance documents, including the National            the needs of its users. More than that we need an integrated
      Infrastructure Plan, Government Policy Statement on Land             transport system whose total contribution to our country is more
      Transport Funding 2012/13–2021/22 and Safer Journeys: New            than the sum of its individual parts. To help achieve this, the
      Zealand’s Road Safety Strategy 2010–2020. Together these             government will work in partnership with local government and
      documents outline the government’s strategic direction and           the transport sector to make that a reality.
      priorities for transport.
                                                                           The government is committed to delivering New Zealanders
      The roading network is the backbone of the transport system.         the transport system they need. We have identified our policy
      It is responsible for moving 70 percent of our freight tonne-        direction for transport and the investment we need to make
      kilometres. Eighty-four percent of the trips that we make as         in the transport system. But we need all participants in the
      individuals are by motor vehicle. The government will invest         transport system — be they infrastructure or service providers,
      more than $36 billion in the land transport system over the next     or transport consumers — to play their part.
      decade via the National Land Transport Fund. However, with
                                                                           Looking to the decade ahead, there are some exciting
      the freight task expected to double over the next 3 decades,
                                                                           opportunities before us. We need to make the most of them if we
      significant population growth in the top half of the North Island,
                                                                           are to realise the greater prosperity, security and opportunities
      and an ageing population, we need the whole of the transport
                                                                           we all seek.
      system to lift its game and deliver greater value for money.

                                                                           Hon Steven Joyce
                                                                           Minister of Transport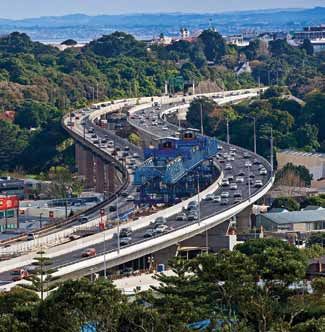
3

Executive summary
Purpose of Connecting New Zealand                                    Government’s three key areas of focus for
The purpose of Connecting New Zealand is to summarise for            transport
stakeholders the government’s broad policy direction for the         To deliver on its transport objective, the government is focusing
transport sector over the next decade. It will assist stakeholders   on three key areas.
to better understand how the government sees the transport
system developing over that period. Connecting New Zealand           Economic growth and productivity — transport has an
draws together the policy direction set out in a number of other     important role to play in enabling the government’s overall
guidance documents, including the National Infrastructure            goal to grow the New Zealand economy to deliver greater
Plan and the Government Policy Statement on Land Transport           prosperity, security and opportunities for all New Zealanders.
Funding 2012/13–2021/22 (GPS 2012).                                  The transport system provides connections — both domestically
                                                                     and internationally — for our communities and businesses, and
                                                                     meets the travel needs of our international tourists.
Government’s overall objective for transport
The government is seeking an effective, efficient, safe, secure,     Value for money — improving the performance of the
accessible and resilient transport system that supports the          transport system is critical. The government needs to be
growth of our country’s economy, in order to deliver greater         confident that the transport sector (central and local government
prosperity, security and opportunities for all New Zealanders.       in particular) is delivering the right infrastructure and services to
                                                                     the right level, and for the best possible price.

Challenges for transport in New Zealand                              Road safety — implementing the Safer Journeys road safety
New Zealand is a trading nation, but geographically we are           strategy and its new Safe System approach, so we have a
further away from the economic centres of the world than any         sustained reduction in deaths and serious injuries on our roads
other developed country. To be internationally competitive, we       over time.
need to improve the efficiency of our transport networks. We
need to achieve this at a time when:
   • our population is ageing
   • people are changing where they live in New Zealand
   • fuel prices are expected to remain volatile while generally
      increasing
   • the freight task is predicted to double in the next 30 years
   • international responses to issues such as greenhouse gas
      emissions and transport security can impose additional
      transport costs on our exporters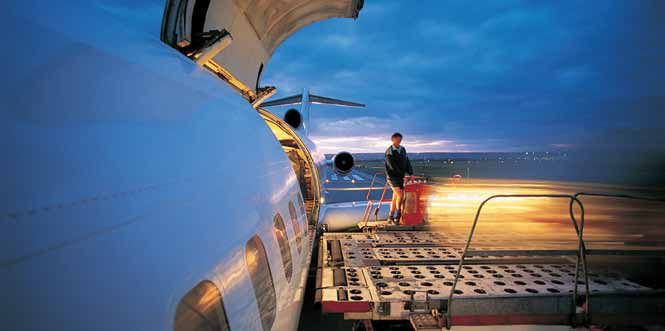
CONNECTING NEW ZEALAND /4

         Key government actions
         The key government actions set out in Connecting New Zealand for the next decade are detailed below.

         Road                                                              Maritime

          • Invest $36 billion in land transport over the next decade      • Focus on port productivity.
            via the National Land Transport Fund. This includes            • Drive greater performance and value for money from
            $19.5 billion in State highways and $12.5 billion in             Maritime New Zealand.
            subsidies for regional and local roads and public transport.
                                                                           • Establish a sustainable funding basis for Maritime
          • Complete the first set of Roads of National Significance         New Zealand.
            (RoNS).
                                                                           • Improve maritime safety, by introducing a new seafarer
          • Drive greater performance and value for money from the           qualifications and operational limits framework, and a new
            NZ Transport Agency (NZTA).                                      maritime operator safety system.
          • Continued reduction in emissions of carbon dioxide from        • Improve public information on the performance of
            land transport over time.                                        maritime and freight transport.

         Aviation                                                          Road safety

          • Negotiate air services agreements to provide more access       Implement the new Safe System approach, including:
            to key trade and tourist markets.                              • increasing the safety of young drivers
          • Improve safety regulation in key areas, including adventure    • reducing the impact of alcohol and drug-impaired drivers
            and agricultural aviation.
                                                                           • improving the safety of our roads and roadsides
          • Develop and promulgate a national airspace policy, and an
                                                                           • increasing the safety of motorcycling
            airspace and air navigation plan.
                                                                           • helping people drive to the conditions and encouraging
          • Drive greater performance and value for money from the
                                                                             them to comply with safe speed limits
            Civil Aviation Authority and the Aviation Security Service.
          • Review any market barriers to trade.

         Rail                                                              Public transport

          • Make progress on the implementation of the KiwiRail            • Improve efficiency in the operation of the public transport
            Turnaround Plan.                                                 system.
          • Complete $2.3 billion investment in metro rail                 • Grow public transport patronage with less reliance on
            infrastructure in Auckland and Wellington.                       subsidies.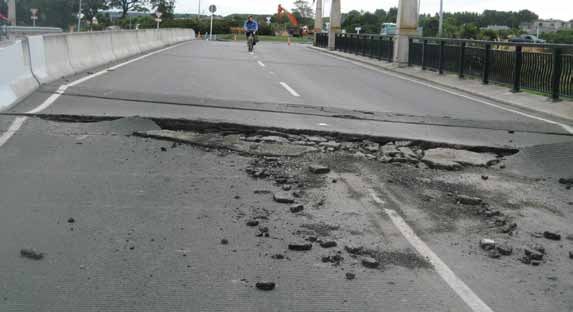
5

Purpose
Connecting New Zealand summarises the government’s broad policy direction for
transport over the next decade.

Connecting New Zealand sets out the government’s objective for an effective,
efficient, safe, secure, accessible and resilient transport system that supports the
growth of our country’s economy, in order to deliver greater prosperity, security
and opportunities for all New Zealanders.

The purpose of Connecting New Zealand is to summarise the        Transport not only enables economic activity by moving people
government’s broad policy direction for the transport sector     and goods around the country, but it also connects us as a
over the next decade. This will assist stakeholders to better    trading nation to our overseas markets. Growing the economy is
understand how the government wants the transport system to      central to lifting New Zealand’s standard of living and providing a
develop, and enable them to consider this when they make their   better future for New Zealanders.
own transport decisions.
                                                                 The government is seeking an effective, efficient, safe, secure,
Connecting New Zealand draws together the government’s           accessible and resilient transport system that supports the
policy direction that has been set out in a number of policy     growth of our country’s economy, in order to deliver greater
decisions and guidance documents over the last 2 years. These    prosperity, security and opportunities for all New Zealanders.
include the National Infrastructure Plan, the GPS 2012, the
KiwiRail Turnaround Plan and Safer Journeys: New Zealand’s
Road Safety Strategy 2010–2020. Each of these documents
provides detailed guidance on their particular areas of the
transport system.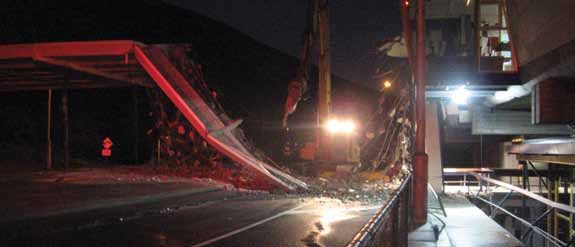
CONNECTING NEW ZEALAND /6

      New Zealand’s place in the world
     Most New Zealanders want to live in a country where rates of                                       other countries. To account for these issues, it is essential that
     employment are high and living standards are improving. We                                         our air and sea ports are well connected to our road and rail
     need to build a strong, growing competitive economy to achieve                                     networks.
     those aspirations. Vital to this is our connection with international
     markets and inbound tourism. Our domestic transport system is                                      With the global economy emerging from the recession, there
     part of the greater international supply chain, so we need to think                                is potential for new markets to open up in East Asia and South
     globally to deliver a transport system that helps our exporters to                                 America. It is essential that New Zealand is in the best possible
     compete.                                                                                           position to capitalise on these new opportunities.

     Geographically, New Zealand is further from the economic                                           As a country we have limited financial resources. It is critical that
     centres of the world than any other developed country. Our                                         we continue to invest wisely in our transport infrastructure
     trading partners have become much more diversified over the                                        to drive the lift in productivity and competitiveness that
     last few decades (Figure 1).                                                                       New Zealand needs.

     Transport costs are significant for our exporters. A survey of six                                 As a trading nation that is far away
     key exporters indicated that they consume almost five percent of
                                                                                                        from our international markets,
     total turnover (four percent is due to the international transport
     component). To reduce that cost, we need to be constantly                                          New Zealand, and our exporting
     searching for ways to achieve efficiencies across and between                                      businesses, need an efficient transport
     the transport modes. The shape of our country and the nature
                                                                                                        system.
     of our population means that our transport infrastructure is
     expensive to build, operate and maintain compared to many

                                                                                                    1
           Figure 1 – Where our exports go

                                                                                                                     United States
                                                                                                                                               North America
                                                                                                                                               (Canada & Mexico)

                                                                                                                                               2.07%
           UK
                                                            Russia/Central Asia
           3.65%
                      Europe                                1.44%
                      7.62%                                                                                                                               United States
                                                                                                                                                          8.74%
                                                                         China              Japan
                                          Middle East                   10.10%
                                          3.24%                                             7.55%                                                              Mexico

             Africa                                     South Asia
                                                        (India & Sri Lanka)
             3.23%                                      2.41%
                                                                                 South East Asia
                                                                                                                                     Pacific
                                                                                 18.07%                                              3.09%
                                                                                                                                                                          South America
                                                                                                                                                                           (includes Caribbean)

                                                                                                                                                                           2.13%
                                                                                        Australia
                                                                                       23.73%

                                                                                                           New Zealand

                               Largest single markets

                               Other exports                                                                              Based on New Zealand Trade Data 2010 from Statistics New Zealand
7
State of our infrastructure
New Zealand’s transport infrastructure is generally well transport modes and how they contribute to the movement of
developed, and compares favourably with other developed our goods (Figure 2).
countries. We have good road and rail networks that link well to
our air and sea ports. We have a transport network that includes: The growth in the level of freight that originates in, and is
• 11,000km of State highways attracted to, our regions will also vary, placing different demands
on the transport system in the future. Waikato, Canterbury,
• 80,000km of local roads
Northland and Auckland are projected to have the greatest
• 7 international airports growth in freight volumes (Figures 3 and 4).
• 28 regional airports with scheduled services
Graph Section 3 page 4
• 4,000km of rail track
• 14 exporting sea ports Figure 2 – Freight tonne-kilometres by mode 2006/07
The recent earthquakes in Canterbury have reinforced the need
to ensure that our transport infrastructure is resilient. Transport Air
0.4%
is a lifeline utility. Disruptions can have serious consequences for Coastal
businesses and communities. shipping*
14.9%
The concept of resilience is wider than natural disasters. It covers
the capacity of public, private and civic sectors to:
• withstand disruption Rail
14.6%
• absorb disturbance
Road
• act effectively in a crisis 70.1%
• adapt to changing conditions, including climate change
• grow over time
However, there are also congestion and pressure points within
* Not including Cook Strait traffic
our networks which we are working to address. Alongside that,
the freight task has been projected to double by 2040. Any level Source: National Freight Demands Study 2008
of significant growth in the freight task will have an impact on the
Figure 3 – Forecast growth in freight traffic generated in regions 2006–2007 to 2031
60.00
2006-2007 2031
50.00
40.00
Million tonnes
30.00
20.00
10.00
0.00
ty
e
y
st
o
u
ry
i
d
on
ak
o
Ba
rn
d
g
at
d
an
len
oa
gh
bu
at
lan
ta
lan
or /
an
gt
aw
o
lb n
hl
aik
tC
’s
O
ou
sb
er
fP
in
ar ma
r
ck
rth
ke
ut
an
Ta
W
nt
Gi
ell
es
yo
Au
So
w
M Tas
M
No
Ca
W
W
Ha
Ba
Source: National Freight Demands Study 2008
Our transport infrastructure is generally well developed. However, there are key
congestion and pressure points. The government is working to address historical
under-investment in transport infrastructure.CONNECTING NEW ZEALAND /8
Transport infrastructure is expensive to establish and maintain, government has made record levels of investment in land
and it is widely recognised that we have under invested in transport in recent times (Figure 5).
the transport network in recent decades. To address this, the
Figure 4 – Forecast growth in freight traffic attracted to regions 2006–2007 to 2031
70.00
2006-2007 2031
60.00
50.00
Million tonnes
40.00
30.00
20.00
10.00
0.00
i
o
d
gh
d
ak
ne
u
go
ty
on
y
or /
at
d
lan
st
ry
lan
at
Ba
lb an
len
an
an
ou
or
aik
ta
gt
oa
bu
aw
ck
rth
ar m
O
’s
sb
r
in
hl
fP
tC
W
Ta
er
an
ke
M as
Au
ell
ut
No
Gi
yo
nt
es
T
w
M
So
W
Ca
Ha
W
Ba
Source: National Freight Demands Study 2008
Figure 5 – Total government transport expenditure as a percentage of gross domestic product
1.8%
Transport expenditure (% GDP)
1.6%
1.4%
1.2%
1.0%
0.8%
0.6%
1975 1980 1985 1990 1995 2000 2005 2010
Note: Includes National Land Transport Fund, SuperGold card, KiwiRail Turnaround Plan expenditure, metro rail expenditure and other
non-National Land Transport Fund expenditure. Excludes costs associated with the purchase of KiwiRail.
Source: Ministry of Transport, NZ Transport Agency, Statistics New Zealand9
Why roading is important
The roading network is, in many ways, the backbone of the The roading system also supports the 100 million bus trips that
domestic transport system. It is the means by which most New Zealanders take each year. The government has invested
New Zealanders get about by car, bus or bicycle and connect significant funding in recent years to improve the quality of
with family, friends and employment. Eighty-four percent of our public transport infrastructure. This includes bus and rail
personal daily journeys are by road. The roading network is also terminals and other infrastructure, and establishing new services
responsible for moving 70 percent of freight tonne-kilometres such as the Northern Busway in Auckland.
within New Zealand (Figure 6).
The government invests approximately $1.6 billion a year on
Together, our local roads and State highways provide access to the constructing, maintaining and renewing of State highways,
and from our air and sea ports for the majority of our exports and including provision for walking and cycling.
imports. They also service the needs of our international tourists.
Our State highways account for just 12 percent of all roads, but In partnership with local authorities, the government provides
they carry 50 percent of all motor vehicle kilometres. A number subsidies of $600 million towards the constructing, maintaining
of our highways are affected by congestion, unreliable journey and renewing of our local roading networks that link into our
times or have a poor safety record. The new State Highway highways, including provision for walking and cycling. Local
Classification System identifies our highways as either ‘national authorities invest a similar amount.
strategic’, ‘regional strategic’, ‘connector’, or ‘distributor’, by
The government also provides subsidies of $275 million for
taking in a range of factors including freight volumes, daily traffic
public transport, again with local authorities investing a similar
volumes, centres of population, ports, airports, and international
amount.
tourism. This classification will enable the NZTA to set an
appropriate and consistent level of service for each category and,
over time, help drivers understand what to expect and how to Roads are the backbone of the
behave on different categories of road.
transport system. They carry
New Zealand’s ‘high-volume highways’ total just over 700 70 percent of freight tonne-kilometres
kilometres of road. They are just 6.5 percent of the State
and more than 100 million bus trips
Mode share ofhighway
journeysnetwork
to work and are less than 1 percent of the total road
network. However, they carry:
Full-time workers’ travel to work 6am-9.30am each year. Eighty-four percent of all
• 35 percent of the total vehicle kilometres on highways trips made by individuals are by motor
• 17 percent of the total vehicle kilometres travelled on the vehicles.
whole New Zealand roading network
• 19 percent of the freight volume kilometres on the whole
New Zealand network
Figure 6 – Mode share of journeys to work: full-time workers’ travel 6am–9.30am
July 2008–June 2010
July 2006–June 2008 Motor vehicle*
Public transport**
Walk
July 2004–June 2006 Cycle
0% 10% 20% 30% 40% 50% 60% 70% 80% 90% 100%
Percentage of journeys to work 6am–9.30am
* Includes motorcycles, private vehicles and passengers in private vehicles.
** Includes journeys which may involve driving, walking or cycling to and from public transport centres.
Note: Each period is a 2 year (July to June) annual average.
Source: New Zealand Household Travel Survey, Ministry of TransportCONNECTING NEW ZEALAND /10
Resurgence of rail freight Role of maritime and
When the government purchased the rail system in 2008, the aviation
business was in poor shape. After careful review, the incoming
Maritime and aviation connect New Zealand’s exporters and
government invested substantially in the rail network. Through
importers to international markets. Our sea ports are responsible
the KiwiRail Turnaround Plan, $4.6 billion will be invested in rail
for the movement of 99 percent of our exports by weight, worth
over 10 years to improve the quality of rail infrastructure and to
$36 billion per annum. Coastal shipping is well placed to be
support KiwiRail to become a commercially viable business.
able to move commodities, such as oil and cement, and can also
operate as a competitive alternative to road and rail in some
situations. The coastal shipping industry moves approximately
15 percent of New Zealand’s freight each year. Ferries also play
an important role in freight movements between the North and
South Islands, and in moving people. Ferry services operating in
Auckland and across Cook Strait carry over 5 million passengers
annually.
Rail currently moves 15 percent of the national freight task. With
projected growth in freight over the next 3 decades, an efficient
rail freight network will play an important and complementary
role to road freight to maintain access to our key ports. Rail is
well placed to move heavy products over longer distances.
The Turnaround Plan aims to improve rail’s overall capacity
and ability to efficiently and effectively meet the requirements The aviation sector moves $6 billion of time-sensitive exports
of freight shippers. A successful turnaround will enable rail to each year. The aviation sector is also critical to New Zealand’s
complement, as well as compete with, other modes. $5.6 billion tourism industry.
We need sea and air ports to be linked effectively to the overall
Our rail, maritime and aviation sectors transport network to support efficient nationwide movement
also have a critical role to play in our of passengers, domestic goods, and exports and imports.
supply chains and moving our people Alongside that they need to be able to respond to technological
changes and changing international safety and security
daily. We need to ensure the different standards. We also need to realise the safety, efficiency and
modes are fully integrated. environmental benefits that will be available from adopting new
technologies.
Integrated transport
For the transport system as a whole to operate efficiently and
effectively, we need more than the individual transport modes
operating well in their own right. Transport users need to be
able to access services across the modes to make optimal
decisions for their personal and business mobility, and to move
their goods to market efficiently and on time. To support this,
the infrastructure that underpins transport services needs to be
resilient.
Logistics operators have an important role in how we move our
goods. Transport operators in different modes need to be able
to both compete and operate in an integrated manner for the
benefit of transport users.11
Big issues for transport systems in
the future
A number of global trends and issues will drive changes and New technology — how transport systems can adapt quickly to
developments in new technologies; shifts in vehicle use, patterns take advantage of new technologies to address many of the key
of personal mobility, aviation use and shipping. Some of these issues facing the transport sector, including new fuel sources,
global trends and issues are outlined below. safety and security.
Population growth — the world’s population is expected to New Zealand will benefit from some of these global trends,
grow from seven billion in 2010 to nine billion in 2040, with 64 such as population growth leading to greater demand for our
percent of the world living in urban areas by that time. agricultural products. However, we will need to mitigate the
negative impacts that other trends, such as increased costs
Ageing population — the proportion of the world’s population driven by international emissions or security policy, could have
aged 60 and over is expected to double between 2007 and on our trade. To achieve these mitigations we need effective
2050. The number of 60-year-olds and over is expected to reach international relations. We need to work cooperatively with other
two billion by 2050. This has significant implications for future like-minded countries and have a strong voice in international
transport needs, safety and the transport workforce. transport forums, such as the International Maritime Organization
and the International Civil Aviation Organization, that set the
Global freight growth — global freight movements are
international rules for transport.
expected to grow by 350 percent by 2050.
Population growth, the ageing population, and increased
Fuel prices and volatility — fuel prices are expected to rise
demand for freight are already recognised as being significant
with continued volatility, and this will impact on demand for
issues in New Zealand (Figures 7 to 10).
transport and for new fuel technologies.
Transport emissions — the transport sector will likely need to The projected growth in both freight
respond to future demands to reduce transport greenhouse gas and population in Auckland, Hamilton
emissions.
and Tauranga over the coming decades
Security — how transport security can be enhanced to provide will drive changes, over time, in how
the optimum protection for an uncertain world, having regard to
cost and the threat environment.
and where the government invests in
the transport system.
Figure 7 – New Zealand population projections by age until 2031 (millions)
Source: Statistics New Zealand
6
5
65+
Total population (millions)
4
40-64
3
2
15-39
1
0-14
0
2006 2011 2016 2021 2026 2031CONNECTING NEW ZEALAND /12
Figure 8 – Projected population growth in New Zealand by 2031
Auckland
Waikato
Bay of Plenty
Wellington
Canterbury
Otago
Rest of New Zealand
0 100,000 200,000 300,000 400,000 500,000 600,000
Source: Statistics New Zealand
Figure 9 – Projected New Zealand population in 2031
Rest of
New Zealand
Auckland
19%
38%
Otago
4%
Canterbury
13%
Waikato
9%
Wellington
11%
Bay of Plenty
6%
Source: Statistics New Zealand13
Figure 10 – Freight tonne-kilometre projections
Actual Baseline scenario High growth scenario
35,000
Freight tonne-km (millions)
30,000
25,000
20,000
15,000
10,000
5,000
0
1992
1994
1996
1998
2000
2002
2004
2006
2008
2010
2012
2014
2016
2018
2020
2022
2024
2026
2028
2030
Source: Ministry of Transport
By 2021 New Zealand’s population is expected to grow by New Zealand’s response to these issues is likely to be through
300,000, and to a total population of 5.1 million in 2031. At a range of smaller, incremental changes over time rather
the same time the population will be getting older, with the than through disruptive major policy or service changes that
percentage of people over 65 years of age growing from 13 create economic loss. However, the cumulative effect of these
percent of the population in 2009 to 21 percent in 2031, totalling responses is likely to result in a significant evolution in where and
more than 1 million people at that time. how the government invests in the transport system.
Auckland is expected to have the strongest population growth Other developments are also likely to impact, over time, on some
(almost 600,000 by 2031), while some other parts of the country transport trips and the demands that we place on the transport
will have little or no growth (Figures 8 and 9). system. This includes the government’s investment in ultra-fast
broadband over the next decade which will enable much greater
Together, the Auckland, Hamilton, Tauranga golden triangle will social connectivity for rural and urban communities online.
likely be home to 53 percent of the population in 2031, while
Canterbury is predicted to have one of the oldest age profiles in The government will work with the transport sector over the
the country. The freight task will grow significantly in Auckland, next decade to support the transport system in adapting to
the Waikato and the Bay of Plenty (Figure 10). The extent to its changing environment and to meet the changing needs of
which the Canterbury earthquakes will impact on population transport users.
changes and the future freight task is unknown, and we are likely
to encounter other changes that we cannot foresee.CONNECTING NEW ZEALAND /14
Central and local governments’ role
in the transport system
Central government’s role In fulfilling its roles, the government has a range of issues that it:
Central government performs a number of important roles in the can control — including transport law through Parliament,
transport system, alongside local government, the private sector performance of its transport Crown entities and their transport
and individual transport consumers. infrastructure, and funding of land transport services
Central government’s roles include: can influence — including through its participation in
• setting the policy and regulatory framework for the international forums that set standards which impact on
transport system, including legislative frameworks, New Zealand’s transport system, by negotiating international
participating in international transport forums and agreements that enhance our international connectivity, and by
negotiating international transport agreements providing information that enables the market to make better
transport decisions
• ownership responsibility for transport Crown entities,
including the NZTA, KiwiRail, the Civil Aviation Authority, needs to respond to — these are issues that are beyond the
Maritime New Zealand, and the Transport Accident government’s direct control including the price of oil, an ageing
Investigation Commission population and the effects of climate change. The government
• key infrastructure provision (including for State highways, will continue to respond to these issues carefully and proactively
KiwiRail, Airways New Zealand), a majority shareholding
in Air New Zealand, joint venture owner of six airports and The government plays a number of
shareholder in four corporatised airports roles in the transport system and
• investing in transport infrastructure and services provided
works in partnership with local
by others including subsidising public transport services,
and transport infrastructure provided by local government government, including subsidising
local roads and public transport by, on
average, 50 percent.15
Local government’s role
Figure 11 – Likely National Land Transport
Much of the planning and development of the land transport
Fund expenditure
system is undertaken through a partnership between central
and local government. Local authorities have responsibility for (excludes direct government funding referred to below)
regional and local transport planning. They own the local roading
network, which provides access to the wider network from the Other
properties of ratepayers. Some local authorities also have an 12%
ownership interest in sea and air ports. State
highways
Public
56%
transport
Central and local government in partnership 11%
Central government owns the State highway network which links
individual towns and areas together. Each network carries about
50 percent of the country’s traffic.
Local
Central government pays for 100 percent of the costs of roads
developing and maintaining the highway network, and an 21%
average of 50 percent of the cost of the local roading network,
with the other 50 percent being paid by ratepayers. Central
government and local authorities are each expected to spend
Source: Government Policy Statement on Land Transport Funding 2012/13–2021/22
approximately $12.5 billion over the next decade on local roads
and public transport. The NZTA has responsibility for State
highway planning and development, and engages closely with
The government also invests separately from the National Land
individual local authorities.
Transport Fund (for example, rail). This investment covers rail
Central government agencies also influence the development infrastructure that is not paid for by road users. In addition to the
of communities and the demand for transport through their fund, the government is investing:
decisions on where to locate schools, hospitals, social housing
• $1.6 billion in the development of Auckland’s metro rail
and other infrastructure and services. Central government
system, which comprises:
transport investment decisions can also influence demand
for transport and local land use patterns, and have long-term - $600 million for Project Developing Auckland’s Rail
economic impacts. Transport (DART)
- $500 million for the infrastructure required to support
electrification
- $500 million loan funding for the purchase of electric trains
• $400 million for Wellington’s metro rail upgrade, which has
included double-tracking to Waikanae and the purchase of
48 new two-car Matangi trains
• a further $88.4 million for upgrades to the Wellington metro
rail network as part of a funding and ownership package with
the Greater Wellington Regional Council
• $750 million of funding for the first 3 years of KiwiRail’s
$4.6 billion 10 year Turnaround Plan. The government also
does not expect to receive shareholder returns for the period
of the plan, allowing KiwiRail to provide the rest of the $4.6
Most government funding for transport comes from the National billion investment from customer revenues
Land Transport Fund, most of which comprises fuel excise duty,
road user charges and motor vehicle registration and licensing
fees (Figure 11). Legislative changes in 2008 provided for
hypothecation of all revenue from these sources into the National
Land Transport Fund, to be used for land transport purposes
only under a permanent legislative authority. The principle that
revenue raised from road users should be spent on the roads
they use also allows funding of some related infrastructure and
services, such as road safety promotion and public transport
(which benefits road users by reducing traffic congestion).CONNECTING NEW ZEALAND /16
The role of transport consumers
Individuals, as transport consumers, have the pre-eminent Some transport providers (such as KiwiRail) are working closely
role in shaping the transport system through their use of it. It with key consumers of their services (for example, Fonterra) to
is important, therefore, that price signals are as transparent as develop transport solutions that improve productivity and reduce
possible and users are able to respond to the costs associated transport times. This can involve modifications to the existing
with their transport options. network.
Major New Zealand companies influence the efficiency of the Similarly, the decisions made by individuals and families as
transport system through their decisions on whether to transport to where they live and work, and where firms locate, shape
their goods by road, rail or coastal shipping, and through which New Zealand’s land use and transport needs. It is important to
ports they choose to export. Different types of freight can be acknowledge the powerful influences of price and consumer
more suitable for particular modes. Rail, for example, is suited to choice in determining the shape of the transport system,
the movement of heavy bulk goods such as coal that move from particularly within our urban communities.
point to point, while road can deliver goods to multiple points
and offers more flexibility around the timing of movements. The government wants the costs associated with transport
The decisions of our companies are also influenced by shipping choices to be as clear as possible, and for the price of using each
companies as they make decisions on which ports they will mode to match actual cost as much as possible. This will enable
service and when. businesses and individuals to make the transport decisions that
best meet their needs.17
The impact of higher fuel prices
New Zealand has experienced a period of unprecedented high
and volatile world oil prices, which has affected exporters,
businesses and households. This underpins the need to improve
the efficiency of the New Zealand supply chain, including the
efficiency of transport activities and fuel consumption. It also
Section 6 Graph 1
contributes to the reasons why New Zealand is investing in a
mixed portfolio of transport options. The government is investing
in metropolitan and rail freight to ensure the transport supply has
sufficient capacity and resilient alternatives as the economy and
the population grows (Figure 12).
Figure 12 – Dubai crude oil price and exchange rates
200 1
160 0.8
Dollars per barrel
Exchange rate
120 0.6
80 0.4
40 0.2
US$ per barrel NZ$ per barrel US$/NZ$
0 0
April 2004 April 2005 April 2006 April 2007 April 2008 April 2009 April 2010 April 2011
Data source: Ministry of Economic Development
The decisions of transport consumers, from both large businesses to individuals,
shape the transport system. It is important that the price for using a transport
mode should match actual cost as much as possible.CONNECTING NEW ZEALAND /18
Key aspects of the government’s
policy direction
The government seeks to invest wisely in the areas of the Transport infrastructure will become an increasingly influential
transport system that will bring the greatest benefits to New factor in urban areas as the population and urban density
Zealand. To drive the economy forward, the government has increases in New Zealand. But as our economy grows, so do
three key areas of focus across the transport system: freight tonne-kilometres, and at a faster rate (Figure 13).
• economic growth and productivity We need to make sure that the arteries of our cities do not
• value for money become clogged and that access to our key rail hubs, air and sea
ports remain free moving, and that the corridors along our key
• road safety
supply chains also remain protected from congestion. In some
cases, the government is taking a lead infrastructure approach
Economic growth and to land transport investments, leading improvements in capacity
ahead of them being required to encourage economic growth.
productivity In doing so, the government is being careful to respond to
predicted incremental changes in transport demand and trends,
Transport has an important role to play in achieving the
rather than seeking wholesale mode shift for non-economic
government’s overall goal for New Zealand. The transport
reasons. The latter would lead to a deadweight economic loss by
system connects us both domestically and internationally. It links
encouraging inefficient transport choices.
employees, employers and businesses together, and enables
individuals to access services. The government will focus on ensuring the price of using
different modes matches actual costs as much as possible
Transport is a critical part of the supply chain that delivers goods
to ensure that demand for different modes reflects the
to both domestic and international markets, and meets the travel
economically efficient choices of individual stakeholders. In the
needs of our international tourists. Better transport infrastructure
freight area, this means KiwiRail covering its own costs from its
and services can lower costs and increase accessibility for
freight customers, and roading developments being paid for by
businesses by expanding markets and improving access to
road users through the fuel excise and road user charges system,
suppliers. The quality of infrastructure, and how comprehensive
rather than from general taxation.
the transport network is, will influence the role transport plays
and its contribution to the functioning of a successful competitive However, maximising transport’s contribution to economic
economy1. growth and productivity requires more than just central
government investment in the transport system. Considered,
Figure 13 – Relative growth in tonne-kilometres and gross domestic product since 1992
125%
Tonne-km growth
GDP growth
100%
Growth since 1992
75%
50%
25%
0%
1992 1994 1996 1998 2000 2002 2004 2006 2008 2010
Source: Ministry of Transport and Statistics New Zealand
1
The Eddington Transport Study, Main report, Sir Rod Eddington December 2006, page 3.19
clearly-signalled funding, planning and land-use decisions from
central and local government will encourage the investment
Value for money
plans of private transport operators. This will support the
It is essential that we get the best possible value from the
integration of multiple modes, efficient supply chains, high-
$3 billion of taxpayers’ money that the government invests in
quality infrastructure, and a safe and effective transport sector.
the transport system each year through the National Land
The development of long-term plans, such as the Bay of Plenty Transport Fund — or around $36 billion over the next 10 years.
SmartGrowth strategy, which was developed by the regional This also applies to investments that the government makes
community, can be a good tool to send clear signals to the outside of that, for example, for metro rail infrastructure in
market. Auckland is currently developing its own spatial plan Auckland and Wellington.
which will set out a 30 year vision for the region and, through a
Improving performance and productivity right across the public
collaborative approach, address a range of issues including the
service is a high priority for the government, including the
existing and future land use pattern — residential, business, rural
transport sector. The government needs to be confident that
production, and industrial.
the transport sector (central and local government in particular)
is delivering the right infrastructure and services to the right
level and for the best possible price. This includes providing
CASE STUDY: Waikato Expressway integrated transport services that allow more seamless options
for transport consumers. Achieving this requires a greater focus
— not only on what infrastructure and services are provided —
but also on how activities and projects are delivered, how assets
are managed and the extent to which costs are minimised over
time.
Road safety
New Zealand has made substantial progress over the last 20
years, with the road toll having fallen from 729 in 1990 to 375
in 2010. The improvements since 1990 are even better than
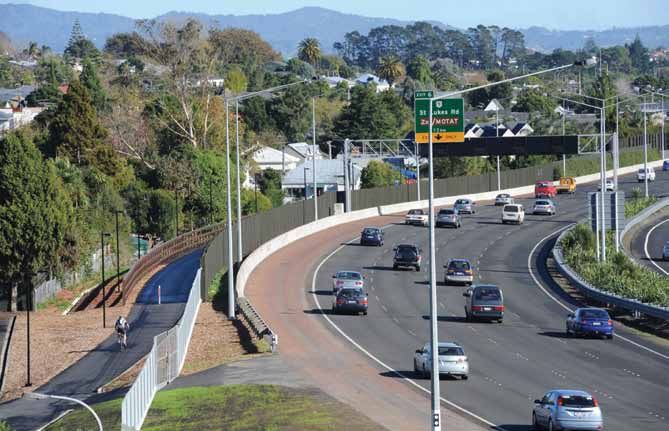
The Waikato Expressway provides productivity the bare numbers suggest, as they have been achieved over a
improvements for Auckland, Waikato and the Bay time when the number of vehicle kilometres driven each year
of Plenty and is an example of a Road of National has grown. However, our road toll remains too high, and our
Significance stimulating and enabling economic young people (15–17 years) have the highest road death rate in
growth. A conservative estimate, based on potential the Organisation for Economic Co-operation and Development
trip destinations, indicates that 18,000 vehicles will (OECD).
save 15 minutes per day. The cost of travel time is $25/
Road crashes carry a high cost — in terms of loss of life, serious
hour across all time periods and road user types, so the
injuries sustained, and impacts on families. Road crashes also
conservative direct yearly benefit is around $40 million.
have an economic impact. The total social cost of road crashes
The Te Rapa Section of the Waikato Expressway is estimated to be $3.7 billion per annum. Reducing the cost of
helps develop the Rotokauri growth cell, an area of road crashes is a key priority for the government.
approximately 1,000 hectares to the north and west of
Both the government and our communities are demanding a
Hamilton. The growth cell comprises approximately
safer road transport system. The government released the Safer
485 hectares of residential development and 270
Journeys road safety strategy in 2010 and adopted a vision of
hectares of industrial development with the balance
‘a safe road system that is increasingly free of serious injury and
comprising a suburban centre, major facilities, education
death’.
and 140 hectares of reserves. The Te Rapa Section also
supports the Horotiu Industrial Park within Waikato The safety of the road system is also important to our
District to the north which is planned to provide productivity and the daily operation of our businesses, through
approximately 150 hectares of industrial land that will its impact on the movement of goods, and people, to and from as
benefit from the Waikato Expressway and improved part of their employment.
connectivity.
The Hamilton Section of the Waikato Expressway, to
The government will drive improved
the east of the city, will enable a step-change in the performance across the transport
region’s economic performance through improved system by focusing on three areas:
freight movement, benefiting the movement of goods
originating in the region and also those transiting to or
economic growth and productivity,
from the major ports. value for money, and road safety.CONNECTING NEW ZEALAND /20
Mode by mode — the policy
direction in practice
Land transport infrastructure Over the next 10 years, the government will continue to invest
in the land transport system throughout the country, from rural
and services New Zealand to our metropolitan centres. Through the National
Land Transport Programme, the government expects to spend
approximately $36 billion, including:
Summary of the government’s key • $19.5 billion on State highway development, renewals and
actions maintenance
The government’s key land transport actions include: • $8.5 billion on local road subsidies
• investing $36 billion in land transport over the next • $4 billion on public transport subsidies (bus, ferry and
decade, including $19.5 billion in State highways commuter rail)
and $12.5 billion in subsidies for regional and local • $3 billion on road policing
roads, and public transport
• completing the first set of RoNS In addition to the National Land Transport Fund,
$7 billion is being directly invested in rail. This includes
• growing public transport patronage with less
$2.3 billion for the commuter rail networks in Auckland and
reliance on subsidies
Wellington for new rolling stock, traction systems and signal
• driving greater performance and value for money systems, and $4.6 billion of capital investment in KiwiRail to
from the NZTA implement the company’s Turnaround Plan. The government is
• continued reduction in emissions in carbon dioxide providing $750 million of initial capital for the Turnaround Plan
from land transport over time but the majority of this funding will be reinvested revenue from
the freight business.
Land transport is a critical area of focus for government given the
level of government investment, land transport’s important role
in our supply chains, tourism, and the various ways in which it
connects individuals and communities. Government investment
in land transport has increased significantly in recent years
(Figure 14).21
Graph Section 8 Graph 1
Figure 14 – National Land Transport Programme expenditure
Actual expenditure Planned expenditure
4,500
4,000
3,500
NLTP expenditure ($ millions)
3,000
2,500
2,000
1,500
1,000
500
0
/14
/01
/02
/03
/04
/06
/07
/08
/09
/10
/11
/12
/13
/22
/15
/16
/17
/18
/19
/20
/21
/05
13
00
01
02
03
05
06
07
08
09
10
11
12
21
14
15
16
17
18
19
20
04
20
20
20
20
20
20
20
20
20
20
20
20
20
20
20
20
20
20
20
20
20
20
Source: Ministry of Transport
The government is investing record amounts in the transport system, and will
invest more than $36 billion through the National Land Transport Fund over
the next decade, including: $19.5 billion on State highways, $8.5 billion on local
roads, and $4 billion on public transport.CONNECTING NEW ZEALAND /22
Christchurch re-build
The Christchurch earthquake on 22 February 2011 and particularly in the Selwyn and Waimakariri districts in recent
subsequent aftershocks have been catastrophic for the city and years has placed significant demand on the State highways to the
the Canterbury region, and will have a significant impact on north and south of the city, and around its western edge. This
New Zealand’s economy for some years to come. has restricted efficient access to both the airport and Lyttelton
sea port. To ensure that Christchurch continues to be a great
Initial estimates are that the transport rebuild may cost the place to live and do business, the government initiated a
government around $400 to $500 million, but the final cost $600 million highway construction programme as one of the
will become clearer over time. The government’s commitment RoNS.
to rebuilding Christchurch may require some reprioritisation
of previously planned transport expenditure for the next few Over the next decade this investment will increase the capacity
years. The rebuild may also require reordering planned transport of roads to handle higher freight levels, as well as improving
projects in and around Christchurch city to respond to any safety for all road users. As Christchurch rebuilds following the
changes in land-use patterns. earthquakes, it is likely that the city will spread westwards and
that the need for this highway construction programme will
The government is also investing in the Christchurch motorway become more acute.
network through the RoNS programme. Rapid growth,
Quake damage to the ANZAC Drive Bridge.
The Lyttelton Tunnel canopy destroyed by the quake.Source: NZ Transport Agency
Estimates of changes of land use as at April 2011
Volume increase
Volume decrease
• Belfast
• Bishopdale
• Burwood
• New Brighton
• St Albans
• Avonhead
• Christchurch Central
Daily traffic volume difference after Christchurch earthquake as at April 2011
• Riccarton
• Hornby
• Ferrymead
• Sumner
• Cashmere
• Prebbleton
23
• HalswellCONNECTING NEW ZEALAND /24
Auckland transport
Major recently completed and current Auckland projects, at the
time of publication, include:
• State Highway 1
- Victoria Park Tunnel (current)
- Newmarket Viaduct (current)
- Auckland Harbour Bridge structural upgrade
(completed)
- additional lane State Highway 1 Newmarket to
Greenlane (completed)
- additional lane State Highway 1 Manukau and
Constellation Drive to Greville Rd (planned)
• Western Ring Route (State Highways 20,16 and 18)
- Manukau Harbour Crossing (completed 2010)
- Manukau Extension (completed 2010)
- Waterview connection (current)
- Hobsonville deviation (completed 2011)
- State Highway 16 widening from Western Springs to
Westgate (current)
• advanced traffic management systems (ramp
New Zealand’s future success is tied to Auckland as our largest signalling programme)
city and biggest local economy. Home to 1.4 million people - continued roll-out across the whole motorway network
(a third of the population), Auckland’s population is projected
to grow to 2 million by 2030–2035, accounting for 60 percent of • Public transport
New Zealand’s population growth. Getting Auckland transport
Rail:
working well is crucial to improving the contribution the city can
- upgrade and extension of the existing metropolitan rail
make to national economic growth.
network) (current)
The government is investing over $1 billion a year in the - Auckland Electrification Project (electrification of the
Auckland transport system with the aim of enabling efficient network) (current)
and effective use of the transport network. Including Crown - Electric Multiple Unit procurement (current)
commitments to rail investment, Auckland currently receives - investment in new and upgraded rail stations, including
46 percent of government transport funding. Newmarket, New Lynn, Grafton (completed 2010)
- reopening the Onehunga branch line (completed 2010)
The government’s current and planned record levels of - building the Manukau rail line (current)
investment in major capital improvements to Auckland’s State
highway and commuter rail networks will help the city to lift its Other public transport:
economic performance. Once the current projects are completed
- integrated ticketing, real time passenger information
(around 2015/16), a step-change in transport performance in
systems, and multi-modal passenger information systems
Auckland is expected.
Attention is now turning to which major projects and
The government is investing more developments will need to be prioritised after these current
than $1 billion a year in Auckland. projects are completed. This includes consideration of a third
Including Crown commitments to rail, harbour crossing, improved central business district access
including a possible city centre rail link, and further infrastructure
Auckland currently receives 46 percent to support ferries and bus transport. Careful prioritisation will
of government transport funding. be needed to provide the right solutions at the right time, and to
ensure that we are maximising the efficient and effective use of
The government’s investment in existing networks.
Auckland will improve our supply
chains and help us to improve our
economic growth and productivity.25
Major recently completed and current Auckland projects (at the time of publication)
SH
Browns
Browns Bay
Bay
17
Greville Road
Greville Road to
to
Constellation Drive
Constellation Drive
Sunnynook
Sunnynook
18
SH
SH
1
Takapuna
Takapuna
Hobsonville
Hobsonville
Deviation
Deviation
Harbour Bridge
Harbour Bridge
structural upgrade
structural upgrade Cheltenham
Cheltenham
SH 16
SH 16 Widening
Widening Victoria
Victoria
SH Park Tunnel
Park Tunnel
16 Westmere
Westmere Glendowie
Glendowie
Mission
Mission Bay
Bay
Newmarket
Newmarket
Viaduct
Viaduct
Henderson
Henderson Waterview
Waterview Newmarket to
Newmarket to
Connection
Connection Greenlane
Greenlane
Ellerslie
Ellerslie
Avondale
Avondale One
One Tree
Tree Hill
Hill Howick
Howick
SH
Glen
Glen Eden
Eden 20 Pakuranga
Pakuranga
Blockhouse Bay
Bay Onehunga
Onehunga
Blockhouse
SH 1
Manukau Harbour
Manukau Harbour
Titirangi
Titirangi Crossing
Crossing
Otara
Otara
SH
0A
20
2
SH
Manukau Extension
Manukau Extension
Mangere
Mangere
Auckland
Auckland Airport
Airport
Wiri
Wiri Manukau to
Manukau to
Papakura
Papakura
Manurewa
Manurewa
SH
SH 1
1
Other State highway
Projects Papakura
Papakura
Routes are indicative only
Completed
Current
Planned
Western Ring Route completed
Western Ring Route currentYou can also read