Connectivity Broadband market developments in the EU - Digital Economy and Society Index Report 2019 - Cyberpolicy NASK
←
→
Page content transcription
If your browser does not render page correctly, please read the page content below
Connectivity
Broadband market developments in the EU

         Digital Economy and Society Index Report 2019
                          Connectivity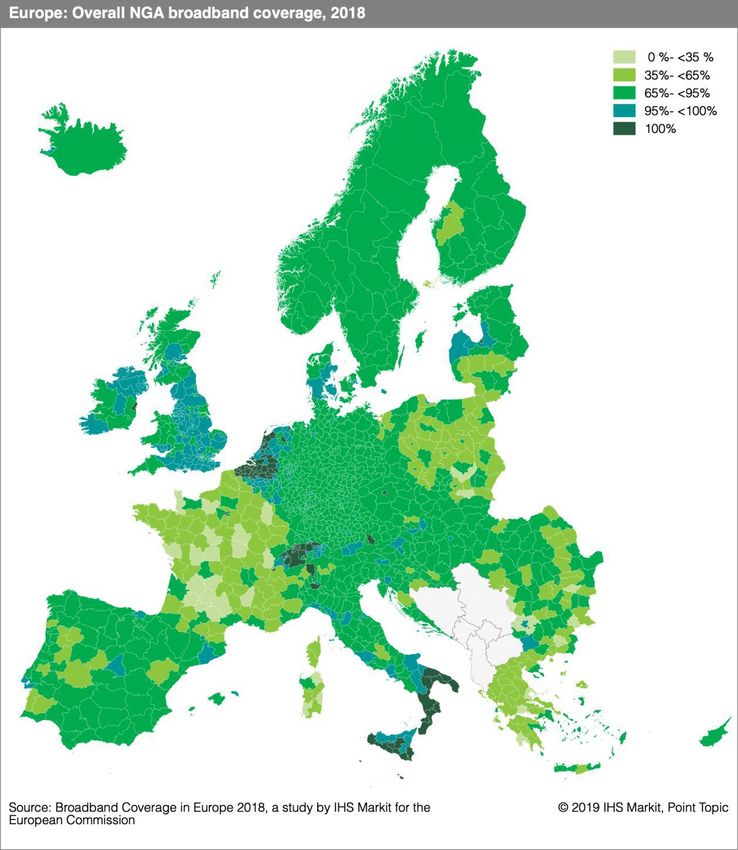
The Digital Economy and Society Index (DESI) is a composite index that summarises relevant
indicators on Europe’s digital performance and tracks the progress of EU Member States in
digital competitiveness.

                                                                               The five dimensions of the DESI
                                                                               1 Connectivity       Fixed broadband, mobile broadband, fast and ultrafast
                                                                                                    broadband and prices
Finland, Sweden, the Netherlands and Denmark, have the most
                                                                               2 Human capital      Internet user skills and advanced skills
advanced digital economies in the EU followed by the UK,
Luxembourg, Ireland and Estonia.                                               3 Use of internet    Citizens' use of internet services and online transactions
Bulgaria, Romania, Greece and Poland have the lowest scores
on the index.                                                                  4 Integration of   Business digitisation and e-commerce
                                                                               digital technology
                                                                               5 Digital public   e-Government and e-health
                                                                               services

                                                     Digital Economy and Society Index (DESI) 2019
80
                1 Connectivity    2 Human capital      3 Use of internet services     4 Integration of digital technology     5 Digital public services
70

60

50

40

30

20

10

 0
      FI   SE   NL   DK    UK    LU   IE   EE   BE   MT   ES   DE    AT   EU    LT   FR    SI      LV   CZ   PT   HR    SK   CY    HU    IT   PL    EL    RO     BG
Source: DESI 2019, European Commission
     DESI Report 2019 – Connectivity                                                                                2
In Connectivity, Denmark had the highest score, followed by Luxembourg, the Netherlands,
 Sweden and Finland. Greece, Croatia and Lithuania had the weakest performance in this
 dimension of the DESI.                       Connectivity indicators in DESI 2019 EU
 The connectivity dimension looks at both the demand and the supply side of             1a1 Fixed broadband coverage                                                     97%
 fixed and mobile broadband. Under fixed broadband, it assesses the                     % households                                                                      2018
                                                                                        1a2 Fixed broadband take-up                                                      77%
 availability as well as the take-up of basic, fast (Next Generation Access –           % households                                                                      2018
 NGA providing of at least 30 Mbps ) and ultrafast broadband (at least 100              1b1 4G coverage                                                                  94%
 Mbps) and also considers the prices of retail offers. Mobile broadband                 % households (average of operators)                                               2018
                                                                                        1b2 Mobile broadband take-up                                                      96
 includes the availability of 4G, the take-up of mobile broadband and a new             Subscriptions per 100 people                                                      2018
 indicator on 5G readiness. Digital connectivity is considered a social right in        1b3 5G readiness                                                                 14%
 the EU.*                                                                               Assigned spectrum as a % of total harmonised 5G spectrum                          2018
                                                                                        1c1 Fast broadband (NGA) coverage                                                83%
 A comparative assessment of fixed broadband (basic, fast and ultrafast)                % households                                                                      2018

 shows the Netherlands and Luxembourg as the best performers. In contrast,              1c2 Fast broadband take-up                                                       41%
                                                                                        % households                                                                      2018
 Greece, Poland and Croatia are shown to be among the worst performers.                 1d1 Ultrafast broadband coverage                                                 60%
 As for mobile broadband, Finland, Denmark, Latvia and Italy lead Europe,               % households                                                                      2018
                                                                                        1d2 Ultrafast broadband take-up                                                  20%
 while Romania and Hungary registered the lowest scores. https://composite-             % households                                                                      2017
 indicators.jrc.ec.europa.eu/social-scoreboard/                                         1e1 Broadband price index                                                         87
                                                                                        Score (0 to 100)                                                                  2017
 * https://composite-indicators.jrc.ec.europa.eu/social-scoreboard/
                                                     Digital Economy and Society Index (DESI) 2019, Connectivity
80
                1a Fixed broadband            1b Mobile broadband           1c Fast broadband          1d Ultrafast broadband                      1e Broadband price index
70

60

50

40

30

20

10

 0
     DK    LU    NL    SE     FI   BE    MT     LV     ES   UK    DE   IE     EE   HU EU28 CZ          AT     SI       PT     IT     FR       CY     RO   SK   PL   BG   LT      HR   EL
 Source: DESI 2019, European Commission
     DESI Report 2019 – Connectivity                                                                                                      3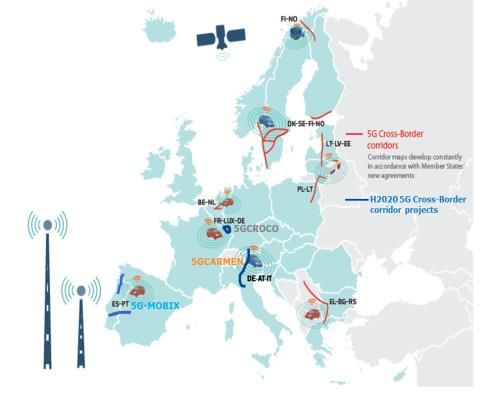
Total telecoms services revenues have stagnated in Europe since 2015. Mobile and fixed voice
revenues have fallen by 16 % since 2014. An increase in mobile data and internet services was
accompanied by a decline in voice services (fixed and mobile).
                                                                                          Total Telecommunication revenues per region, billion EUR, 2015-2019 (forecast)
                                                                                           350
 Telecoms operators in Europe generated less revenue than the
 US operators. Revenues fell from EUR 213.8 billion in 2015 to                             300          286                289
                                                                                                                                            292         293
                                                                                                                                                                           294
 EUR 213.4 billion in 2018 in Europe. At the same time, the US                             250
 revenues increased by 2.7 % from EUR 286 billion to EUR 293                                                              211.9                        213.4
                                                                                                                                                                           214.8
 billion, despite its smaller population.                                                  200             213.8                           212.1
                                                                                                                                                                           189
                                                                                                                           166             173          182
 China saw its revenues increased by 16 %, rising from EUR                                 150             156

 156 billion in 2015 to EUR 182 billion in 2018.                                           100             91              91              91               91            90

                                                                                            50             44
 Note: This analysis is based on detailed figures from 26 EU Member                                                       43               42               41             41
 States, which covered around 98% of the total EU market (total telecom                      0
 carrier services). Data is not available for Malta and Cyprus.                                     2015               2016            2017          2018          Forecast 2019
                                                                                                                EU26       JAPAN         CHINA       US          Brazil

The analysis of telecoms revenues (carrier services) by segment
shows a decline in voice services (both fixed and mobile) revenues.                       Telecoms services revenues by segment, % of total, 2015 - 2019 (forecast)
Fixed voice service revenues have fallen by 11.4 % since 2015,                            100%
                                                                                           90%
compared to 11.6 % for mobile services over the same period (2015                          80%
– 2018). Together, fixed and mobile voice services represented 43 %                        70%
                                                                                                      48%               48%              48%           48%                49%
of total telecoms revenues in 2018, compared with 49 % in 2015.                            60%
Mobile data services represented 28 % of total revenues in 2018, up                        50%
                                                                                           40%
from 25 % in 2015. The growth in mobile data services was
                                                                                           30%        44%               45%              45%           44%                44%
accompanied by a decline in voice services.                                                20%
*Note: This analysis is based on detailed figures from 26 EU Member States, which
                                                                                           10%
                                                                                                      7%                 7%               7%            7%                 7%
covered around 98% of the total EU market (total telecom carrier services). Data is not     0%
available for Malta and Cyprus.                                                                      2015               2016             2017          2018          Forecast 2019
Source: 2019 European IT Observatory (EITO) in collaboration with IDC.                              Mobile services            Fixed line services    Business data services

    DESI Report 2019 – Connectivity                                                                                               4
Broadband coverage: Fast broadband (Next generation access - NGA) covers 83 % of homes, up
from 79 % a year ago, while Ultrafast broadband (Fibre to the Premises and Docsis 3.0 cable) is
available in 60 %, up from 57 % a year ago. 4G mobile is almost universal at 99 %. Rural coverage
improved substantially in 4G, VDSL and FTTP.
Basic broadband is available to all homes in the EU, when 30 % of homes already benefit from very high capacity broadband
considering all major technologies (xDSL, cable, fibre to the with gigabit connectivity on FTTP networks.
premises - FTTP, WiMax, HSPA, LTE and satellite). Fixed and fixed- Rural areas remain challenging, as 13 % of homes are not covered
wireless technologies cover 97 % of EU homes. by any fixed network and 48 % by any NGA technology. Rural fixed
coverage is stable at 87%. Mobile broadband availability went up
Coverage of NGA technologies (VDSL, cable Docsis 3.0 and FTTP) slightly last year, although mobile is still mainly used as a
capable of delivering download speeds of at least 30 Mbps reached complementary technology rather than a substite to fixed
83 %, thanks to an increase of 3 percentage points in VDSL and technologies.
FTTP last year.
DSL coverage has somewhat declined, as DSL is being replaced by Note: Substantial revisions have been made in the dataset concerning in particular the
FTTP or mobile. rural indicators.
Total coverage by technology at EU level (% of homes), Rural coverage by technology at EU level (% of homes),
2017-2018 2017 - 2018
100% 100%
2017 2018 2017 2018
80% 80%
60% 60%
40% 40%
20% 20%
0% 0%
Fixed &
Fixed
NGA
FTTP & Docsis
DSL
VDSL
FTTP
WiMAX
Standard
Docsis 3.0
HSPA
4G
Satellite
Fixed &
Fixed
NGA
FTTP & Docsis
DSL
VDSL
FTTP
WiMAX
Standard
Docsis 3.0
HSPA
4G
Satellite
mobile
mobile
cable
cable
cable
cable
3.0
3.0
Source: IHS and Point Topic Source: IHS and Point Topic
5
DESI Report 2019 – ConnectivityFixed broadband coverage remained at 97 %. In 10 Member States more than 99 % of homes are
covered. Poland, Lithuania, Romania and Slovakia are lagging behind with less than 90 % of
homes covered.
Primary internet access at home is provided mainly by fixed Fixed broadband coverage in the EU (% of homes),
2011 - 2018
technologies. Among these technologies, xDSL has the largest 100%
footprint (92 %) followed by cable (45 %) and WiMAX (17 %). 90%
Fixed coverage is the highest in the Member States with well-
developed DSL infrastructures. 80%
Overall coverage of fixed broadband has only marginally
70%
increased since 2011. Rural coverage improved from 80 % in Total Rural
2011 to 87 % in 2018. 60%
Source: IHS,VVA and Point Topic
50%
2011 2012 2013 2014 2015 2016 2017 2018
Fixed broadband coverage (% of homes), mid-2018
100%
Total Rural
90%
80%
70%
60%
50%
40%
30%
20%
10%
0%
MT NL CY LU UK FR BE HR IT DK AT SI IE CZ DE SE EU EL ES BG FI HU LV PT EE SK RO LT PL
Source: IHS and Point Topic
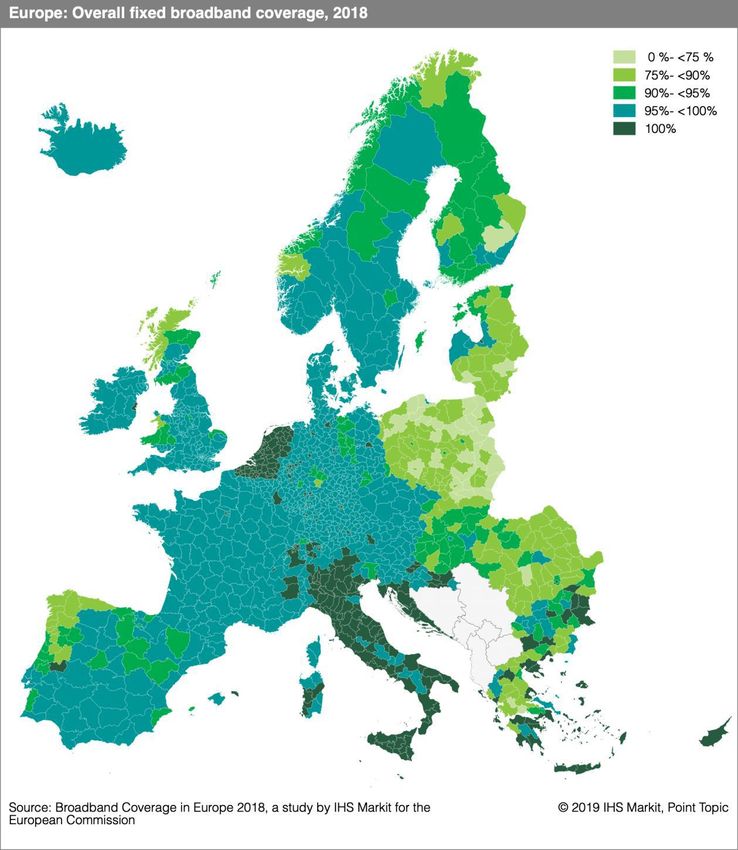
DESI Report 2019 – Connectivity 6Coverage of Next Generation Access (NGA) technologies continued to increase and reached 83 %.
NGA improved significantly in rural areas, from 45 % to 52 % of homes compared to last year.
Next Generation Access (NGA) broadband coverage in the
By mid-2018, VDSL had the largest NGA coverage at 57 %, EU (% of homes), 2011 - 2018
followed by cable (44 %) and FTTP (30 %). While cable 100%
Total Rural
coverage only marginally increased last year, VDSL and FTTP 80%
went up by 3 percentage points.
Malta, the Netherlands and Belgium are the leaders in NGA. In 60%
11 Member States fast broadband is available to at least 90 % 40%
of homes. On the other hand, in France, Lithuania, Greece and
Poland less than two thirds of homes can have access to such 20%
networks. Source: IHS,VVA and Point Topic
0%
2011 2012 2013 2014 2015 2016 2017 2018
NGA coverage (% of homes), mid-2018
100%
Total Rural
90%
80%
70%
60%
50%
40%
30%
20%
10%
0%
MT NL BE LU IE DK UK LV AT IT CY CZ ES DE HU SE SK SI EU EE HR RO PT BG FI PL EL LT FR
Source: IHS and Point Topic
DESI Report 2019 – Connectivity 7Ultrafast broadband (FTTP & Cable Docsis 3.0) is available in 60 % of European homes. In Malta,
the Netherlands, Belgium, Denmark and Luxembourg at least 90 % of homes have access, while
in Greece it is less than 1 %.
Ultrafast broadband capable of providing at least 100 Mbps The top three countries (Malta, the Netherlands and Belgium)
connectivity is currently measured as the combined coverage of provide ultrafast connectivity mainly through cable, while FTTP
cable Docsis 3.0 and FTTP networks. Cable covers 44 %, while is the more widespread ultrafast technology in Latvia and
FTTP covers 30 % of homes. Cable and FTTP networks Spain. At the bottom of the list, Greece has no cable and only a
overlap, and mainly cover urban areas. 60 % of homes in total marginal availability of FTTP, while Italy only has FTTP
have access to at least one of the ultrafast technologies, up available in some cities.
from 57 % a year ago.
The rural coverage of ultrafast technologies stands at 16 % of
homes.
Ultrafast coverage (FTTP and Docsis 3.0., % of homes), mid-2018
100%
Total Rural
90%
80%
70%
60%
50%
40%
30%
20%
10%
0%
MT NL BE DK LU LV ES SE EE HU SK SI PT RO BG DE CZ LT EU FI AT IE PL CY UK FR HR IT EL
Source: IHS and Point Topic
DESI Report 2019 – Connectivity 8Coverage of Fibre to the Premises (FTTP) grew from 10 % in 2011 to 30 % in 2018, although it
remains a primarily urban technology. Latvia, Spain, Sweden, Portugal and Slovakia are the
leaders in FTTP in Europe.
FTTP is catching up in Europe, as coverage of homes has Fibre to the Premises (FTTP) coverage in the EU (% of
homes), 2011 - 2018
tripled since 2011. However, the FTTP footprint is still 35%
significantly lower than that of cable Docsis 3.0 and VDSL. In 30% Total Rural
Latvia, Spain and Sweden more than 70 % of homes can 25%
already subscribe to FTTP services, while in Greece, Cyprus,
Belgium, the UK and Germany less than 10 % can do so. FTTP 20%
increased the most in Slovakia (13 percentage points) and in 15%
France (10 percentage points). FTTP services are available 10%
mainly in urban areas with the exception of Latvia and
Denmark, where more than 50 % of rural homes also have 5%
Source: IHS,VVA and Point Topic
access to it. 0%
2011 2012 2013 2014 2015 2016 2017 2018
FTTP coverage (% of homes), mid-2018
100%
Total Rural
90%
80%
70%
60%
50%
40%
30%
20%
10%
0%
LV ES SE PT SK DK LU RO SI LT EE CZ BG FR FI HU NL MT EU PL IT HR AT IE DE UK BE CY EL
Source: IHS and Point Topic
DESI Report 2019 – Connectivity 9Overall fixed broadband and NGA broadband coverage by region. DESI Report 2019 – Connectivity 10
4G coverage: 99 % of homes are covered by at least one operator in Europe (overall coverage).
Rural coverage went up from 38 % in 2014 to 96 % in 2018. Average 4G availability* is 94 %, up
from 85 % two years ago.
                                                                                                   4G mobile coverage in the EU (% of homes), 2011 - 2018
                                                                                       100%
 4G (LTE) is now almost as widely available as advanced 3G                                                 Total       Rural
 (HSPA) and fixed broadband. 4G expanded mainly in Croatia                               80%
 and Cyprus last year.
                                                                                         60%
 Average 4G availability (calculated as the average of each
 operator's coverage) is somewhat below the overall coverage                             40%
 and stands at 94 %.
                                                                                         20%
                                                                                                                                   Source: IHS,VVA and Point Topic
                                                                                          0%
                                                                                                    2011    2012     2013        2014    2015     2016   2017   2018

                                                                 4G coverage (% of homes), mid-2018
100%
  90%
  80%
  70%
  60%
  50%
  40%
  30%
  20%
  10%
   0%
        NL BE CZ FI DK                LU   EE    AT   LV    SI    UK   LT    IT   HU    SE     PT    IE    FR   HR   EU     CY    ES    PL   EL   DE SK MT BG RO
Source: IHS and Point Topic                                                                                                                         Average Overall
* This indicator measures the average of mobile telecom operators' coverage within each country.

    DESI Report 2019 – Connectivity                                                                                         11
77 % of EU homes had a fixed broadband subscription in 2018. The Netherlands, the UK,
Luxembourg and Germany registered the highest figures, while Bulgaria, Finland, Poland, Latvia
and Italy had the lowest take-up rates.
Households with a fixed broadband subscription (% of
Although fixed broadband is available to 97 % of EU homes, households), 2012-2018
23 % of homes do not have such a subscription. Growth in 78%
Source: Eurostat
take-up has been steady over the last 6 years, up from 67 % to 76%
74%
77 %.
72%
Take-up rates ranged from only 58 % in Finland and Bulgaria to 70%
97 % in the Netherlands. The relatively low take-up rates in 68%
Finland, Poland, Latvia and Italy may partly be due to fixed- 66%
mobile substitution. 64%
62%
60%
2012 2013 2014 2015 2016 2017 2018
Households with a fixed broadband subscription (% of households), 2018*
100%
Source: Eurostat
90%
80%
70%
60%
50%
40%
30%
20%
10%
0%
NL UK LU DE SI CY MT DK EE ES HU EU SE CZ EL PT IE FR HR SK AT RO LT IT LV PL FI BG
*The figures for Belgium were removed due to low data reliability.
DESI Report 2019 – Connectivity 1270 % of rural homes in the EU had a fixed broadband subscription in 2018. The Netherlands, the
UK and Luxembourg registered the highest figures, while in Bulgaria and Latvia, less than half of
rural homes subscribed.
EU households with a fixed broadband connection by
There is a substantial gap between rural and national degree of urbanisation (% of households), 2010-2018
penetration rates. However, this gap slightly decreased from 11 90
percentage points in 2010 to 7 percentage points in 2018. 80
Total Urban areas Intermediate areas Rural areas
In the Netherlands, the UK, Luxembourg, Germany, Denmark, 70
Belgium, Czechia and Austria, rural and national penetration 60
50
rates are identical or almost identical. 40
However, in Bulgaria, Latvia, Romania, Lithuania, Portugal, 30
Ireland, Greece, Slovakia and Spain, where fixed rural take-up 20
is relatively low (63 % and below), there are significant gaps of 10
0
11-17 percentage points between rural and national take-up. 2010 2011 2012 2013 2014 2015 2016 2017 2018
Source: Eurostat
Household fixed broadband penetration, rural vs total (% of households), 2018*
100%
Rural Total
90%
80%
70%
60%
50%
40%
30%
20%
10%
0%
NL MT UK LU DE SI DK EE CY CZ SE EU HU AT FR HR ES SK EL IE PT IT LT FI PL RO LV BG
Source: Eurostat
*The figure for rural fixed broadband household penetration in Malta was removed due to low data reliability.
The figures for Belgium were removed due to low data reliability.
DESI Report 2019 – Connectivity 13The take-up of fast broadband access has doubled in the last 3 years. In July 2018, 41% of homes
had a subscription of at least 30 Mbps. The Netherlands, Malta and Belgium are the leaders in fast
broadband take-up in Europe.
Households with a fast broadband (at least 30Mbps)
There has been a sharp upward trend in the take-up of fast subscription (% of households), 2012 - 2018
45%
broadband in the EU since 2010, triggered also by the Source: Communications Committee and Eurostat
40%
continuous deployment of infrastructure. Almost all cable 35%
subscriptions and around one third of DSL subscriptions have 30%
been migrated to high-speed plans. Fibre services are also 25%
catching up. In the Netherlands, Malta and Belgium more than 20%
two thirds of homes already subscribe to fast broadband, while 15%
in Greece, Cyprus and Croatia take-up remains below 20 %. 10%
5%
0%
2012 2013 2014 2015 2016 2017 2018
Households with a fast broadband (at least 30 Mbps) subscription (% of households), 2018
80%
Source: Communications Committee and Eurostat
70%
60%
50%
40%
30%
20%
10%
0%
NL MT BE LU SE HU PT DK RO IE ES UK LT DE BG EU LV SI CZ PL SK EE FI IT AT FR HR CY EL
DESI Report 2019 – Connectivity 1420 % of European homes currently subscribe to ultrafast broadband (at least 100 Mbps), a marked
improvement from 2 % 6 years ago. Sweden, Portugal, Romania, Hungary and Belgium are the
most advanced in ultrafast broadband adoption.
Households with an ultrafast broadband (at least 100Mbps)
subscription (% of households), 2012 - 2018
The Digital Agenda for Europe set the objective of at least 25%
50 % of homes subscribing to ultrafast broadband by 2020. Source: Communications Committee and Eurostat
In June 2018, 60 % of homes were covered by networks 20%
capable of providing 100 Mbps. As service offers emerge, 15%
take-up is growing sharply. Penetration is highest in
Sweden, Portugal, Romania and Hungary with over 40% of 10%
homes subscribing to at least 100 Mbps. In Greece, Cyprus 5%
and Croatia take-up is very low.
0%
2012 2013 2014 2015 2016 2017 2018
Households with an ultrafast broadband (at least 100 Mbps) subscription (% of households), 2018
60%
Source: Communications Committee and Eurostat
50%
40%
30%
20%
10%
0%
SE PT RO HU BE LU NL LV ES LT DK PL MT FI IE EU CZ SI UK DE FR SK EE BG IT AT HR CY EL
DESI Report 2019 – Connectivity 15In the EU, 92 % of companies have a fixed broadband subscription. However, only 44 % have fast
broadband (at least 30Mbps). While almost all large companies use broadband, 9 % of small
enterprises are not yet connected.
Percentage of enterprises in the EU with fixed broadband connection,
While the vast majority of European businesses use 2014-2018
broadband, only 44 % of companies and 41 % of private homes Any fixed broadband Fast fixed broadband
subscribed to fast broadband in 2018. 100%
Nevertheless, there has been a significant improvement in fast 80%
broadband penetration, which increased by more than 20 60%
percentage points (from 23 % to 44 %) for all enterprises in the
40%
last 4 years.
The take-up rate of fast broadband varies greatly between 20%
companies of different sizes. While 75 % of large companies 0%
benefit from broadband speeds of at least 30 Mbps, only 40 % 2014 2015 2016 2017 2018
of small enterprises do so. Source: Eurostat
Percentage of enterprises in the EU with any fixed broadband Percentage of enterprises in the EU with a fast fixed
connection, by enterprise size, 2014-2018 broadband connection, by enterprise size, 2014-2018
100% Small Medium Large Small Medium Large
100%
90%
90%
80% 80%
70% 70%
60% 60%
50% 50%
40% 40%
30% 30%
20% 20%
10% 10%
0% 0%
2014 2015 2016 2017 2018 2014 2015 2016 2017 2018
Source: Eurostat Source: Eurostat
DESI Report 2019 – Connectivity 16While 61 % of subscriptions are still xDSL, this technology is steadily losing market share.
Cable is second with 19 % of the market. Fibre to the home/building (FTTH/B), as the fastest-
growing technology, has already aqcuired a 16 % market share.
Fixed broadband net adds in the EU by technology, July
Although DSL is still the most widely used fixed broadband 2006 – July 2018
technology, its market share declined from 80 % in 2008 to 61 % in DSL (VDSL included) Cable (DOCSIS 3.0 included) FTTH/B
60 000
2018 – almost 20 percentage points in 10 years. Its main challenger 50 000 Source: Communications Committee
— cable — increased its share slightly (15 % versus 19 %) during 40 000
the same period. 30 000
20 000
However, the most spectacular growth was achieved by FTTH/B,
10 000
which has acquired 16 % of the market in just 7 years. 0
Nevertheless, DSL is still dominant, and its market share could be -10 000
maintained for some years thanks to increasing VDSL coverage.
Jan-07
Jan-08
Jan-09
Jan-10
Jul-10
Jan-11
Jan-12
Jan-13
Jan-14
Jan-15
Jan-16
Jan-17
Jan-18
Jul-06
Jul-07
Jul-08
Jul-09
Jul-11
Jul-12
Jul-13
Jul-14
Jul-15
Jul-16
Jul-17
Jul-18
Fixed broadband subscriptions, technology market shares in the EU, July 2006 – July 2018
DSL (VDSL included) Cable (DOCSIS 3.0 included) FTTH/B Other
100%
90%
80%
70%
60%
50%
40%
30%
20%
10%
0%
Jan-07
Jan-08
Jan-09
Jan-10
Jan-11
Jan-12
Jan-13
Jan-14
Jan-15
Jan-16
Jan-17
Jan-18
Jul-18
Jul-06
Jul-07
Jul-08
Jul-09
Jul-10
Jul-11
Jul-12
Jul-13
Jul-14
Jul-15
Jul-16
Jul-17
Source: Communications Committee
DESI Report 2019 – Connectivity 17The market share of xDSL varies from 11 % to 100 % and is generally lower in eastern Europe,
where FTTH/B is more widely used. Cable is present in all but two Member States.
xDSL is particularly important in Greece and Italy, and has the Share of fibre connections in total fixed broadband, July
lowest market share in Bulgaria, Lithuania and Romania. 90%
2018
Looking at alternative technologies, cable is the main rival to 80% Source: OECD and
Communications Committee
DSL in the majority of Member States. Cable has a very high 70%
market share in Belgium, Hungary, Malta and the Netherlands. 60%
FTTH and FTTB together represent 16 % of EU broadband 50%
40%
subscriptions. FTTH/B is the most widely used technology in
30%
Lithuania, Latvia, Romania, Bulgaria, Portugal, Estonia and
20%
Sweden.
10%
In these technologies, Europe continues to lag behind global 0%
leaders such as South Korea and Japan. United States EU28 Japan South Korea
Fixed broadband subscriptions - technology market shares, July 2018
DSL lines % (VDSL included) Cable modem % (DOCSIS 3.0 included) FTTH/B % Other %
100%
90%
80%
70%
60%
50%
40%
30%
20%
10%
0%
BE BG CZ DK DE EE EL ES FR HR IE IT CY LV LT LU HU MT NL AT PL PT RO SI SK FI SE UK EU
Source: Communications Committee
DESI Report 2019 – Connectivity 18NGA subscriptions have increased sharply by 28.5 million in the last 2 years, and 55 % of all
subscriptions are NGA. In 12 Member States, the market share of NGA is greater than 75%. By
contrast, its take-up remains low in Greece, Cyprus, France, Austria and Italy.
Total NGA subscriptions in the EU (in millions),
NGA subscriptions have been steadily increasing in the EU July 2012 – July 2018
110
since 2012 and currently account for 55 % of all EU fixed 100 Source: Communications Committee
90
broadband subscriptions. 80
70
Belgium and the Netherlands lead ahead of other Member 60
States in NGA take-up, with both VDSL and DOCSIS 3.0 cable 50
40
widely available. 30
20
The highest growth in the last 12 months was in Malta (17 10
percentage points), Cyprus, Luxembourg and Italy (all 14 0
Jan-13
Jan-14
Jan-15
Jan-16
Jan-17
Jan-18
Jul-12
Jul-13
Jul-14
Jul-15
Jul-16
Jul-17
Jul-18
percentage points).
NGA (FTTH, FTTB, VDSL, DOCSIS 3.0 cable and other NGA) subscriptions as a % of total fixed broadband
subscriptions, July 2018
100%
Source: Communications Committee
90%
80%
70%
60%
50%
40%
30%
20%
10%
0%
BE NL SE MT BG PT LV RO HU DK EE LT FI IE SI LU ES UK PL CZ EU DE HR SK IT AT FR CY EL
DESI Report 2019 – Connectivity 19VDSL is currently the most widespread NGA technology in the EU in terms of take-up, followed by
DOCSIS 3.0 cable. FTTH/B is catching up.
Share of different NGA technologies in total NGA
32 % of NGA subscriptions are DOCSIS 3.0, which is a 40%
subscriptions, July 2018
relatively high figure given that cable broadband in total 35% Source: Communications Committee
represents only 19 % of all EU fixed broadband subscriptions.
30%
While almost all cable networks have been upgraded to NGA,
25%
only 61 % of the xDSL network is VDSL-enabled. Nevertheless,
VDSL coverage increased by 15 percentage points in the last 3 20%
years and the number of subscriptions more than doubled. 15%
VDSL now represents 38 % of all NGA subscriptions, being the 10%
most widespread NGA technology. FTTH/B has a 29 % share in 5%
total NGA subscriptions. 0%
vDSL Cable FTTH/B Other NGA
NGA subscriptions in the EU (millions) by technology, July 2012 – July 2018
40
vDSL FTTH/FTTB Cable Other NGA
35
30
25
20
15
10
5
0
Jul-12 Jan-13 Jul-13 Jan-14 Jul-14 Jan-15 Jul-15 Jan-16 Jul-16 Jan-17 Jul-17 Jan-18 Jul-18
Source: Communications Committee
DESI Report 2019 – Connectivity 20Competition in the fixed broadband market: while new entrant operators are gaining more and
more market share, incumbents still control 40 % of subscriptions. The market share of
incumbents is the highest in Luxembourg and Cyprus and the lowest in Czechia and Romania.
Fixed broadband subscriptions - operator market shares at
EU level, January 2006 - July 2018
Market shares are calculated at national level for incumbents 70%
and new entrants. However, broadband markets are 60%
Incumbents New entrants
geographically fragmented suggesting that a large number of
homes are served by only one provider (most likely the 50%
incumbent operator in this case). 40%
Incumbent operators are market leaders in almost all Member 30%
States. Overall, the market share of incumbents in the EU has Source: Communications Committee
20%
decreased by 10 percentage points since 2006. However, there
Jan-12
Jul-13
Jan-06
Jul-06
Jan-07
Jul-07
Jan-08
Jul-08
Jan-09
Jul-09
Jan-10
Jul-10
Jan-11
Jul-11
Jul-12
Jan-13
Jan-14
Jul-14
Jan-15
Jul-15
Jan-16
Jul-16
Jan-17
Jul-17
Jan-18
Jul-18
have been no significant changes since 2015.
Fixed broadband subscriptions – operator market shares, July 2018
Incumbents New entrants
100%
90%
80%
70%
60%
50%
40%
30%
20%
10%
0%
CZ RO BG PL IE SE SI SK UK PT EU DE ES HU NL IT HR BE MT EL DK LT EE LV AT CY LU
Source: Communications Committee
DESI Report 2019 – Connectivity 21In the DSL market, unbundling has reduced the dominance of incumbents. However, in VDSL
incumbents still hold 63 % of subscriptions. Nevertheless, NGA is provided primarily by new
entrants mainly because of the high share of cable.
Incumbent market share by technology, July 2018
New entrant operators can compete with incumbents by using 70%
Source: Communications Committee
either the incumbent's network or their own network to offer 60%
internet access. In the EU, 48 % of new entrant subscriptions 50%
are based on incumbent networks. In Greece, competition is
40%
almost entirely based on regulated access to the incumbents
access network, while in Italy and France over 80 % of 30%
subscriptions are DSL. In eastern European Member States, 20%
competition is based rather on competing infrastructures. This 10%
also goeas for Belgium, Malta, Portugal and the Netherlands. 0%
All broadband NGA DSL VDSL Cable FTTH/B
New entrant subscriptions – using own infrastrucutre or the incumbent network, July 2018
New entrant subscriptions using the incumbent's infrastructure New entrant subscriptions using own infrastructure
100%
90%
80%
70%
60%
50%
40%
30%
20%
10%
0%
BG MT EE LV RO LT HU BE PT PL CZ SE SK NL AT SI DK ES EU LU IE CY HR DE UK FR IT EL
Source: Communications Committee
DESI Report 2019 – Connectivity 22Mobile broadband represents a fast-growing segment of the broadband market. More than 70 % of
all active mobile SIM cards use mobile broadband.
Mobile broadband penetration at EU level
(subscriptions per 100 people), July 2009 – July 2018
There are 96 active mobile broadband SIM cards per 100 people 120
in the EU. The penetration rate doubled over the last 6 years. Source: Communications Committee
100
In Poland, the Nordic countries, Estonia and Luxembourg there 80
are already more than 120 subscriptions per 100 people, while in
60
Hungary the take-up rate is less than half of that. Most mobile
40
broadband subscriptions are used on smartphones rather than
20
on tablets or notebooks.
0
Jan-12
Jul-09
Jan-10
Jul-10
Jan-11
Jul-11
Jul-12
Jan-13
Jul-13
Jan-14
Jul-14
Jan-15
Jul-15
Jan-16
Jul-16
Jan-17
Jul-17
Jan-18
Jul-18
Mobile broadband penetration (subscriptions per 100 people), July 2018
180
Source: Communications Committee
160
140
120
100
80
60
40
20
0
PL FI EE LU DK LV SE CY IE UK BG MT ES EU NL FR LT IT SK AT RO HR CZ DE BE EL SI PT HU
DESI Report 2019 – Connectivity 23Mobile broadband is still mainly complementary to fixed broadband. In 2018, 9.5 % of EU homes
accessed the internet only through mobile technologies. Finland and Italy were leaders in
mobile–only access with 35 % and 22 % of homes respectively.
EU households using only mobile broadband connection at
Europeans primarily use fixed technologies at home to access home (% of households), 2010-2018
the internet. However, there is a growing number of homes with 10%
only mobile internet use. The percentage of homes with purely 9%
Source: Eurostat
mobile broadband access grew from 4.1 % in 2010 to 9.5 % in
8%
2018.
7%
The Netherlands had the lowest mobile-only access rate at less
than 0.2 % of homes, which correlates with the fact that it has 6%
the highest take-up rate of fixed broadband in the EU (97 %). 5%
By contrast, in Finland, Italy, Poland, Latvia and Austria, where 4%
fixed broadband take-up is comparatively low, more than 15 % 3%
of homes rely purely on mobile technologies at home. 2010 2011 2012 2013 2014 2015 2016 2017 2018
Households using only mobile broadband at home (% of households), 2018
40%
Source: Eurostat
35%
30%
25%
20%
15%
10%
5%
0%
FI IT PL LV AT IE LT SE BG RO CZ EU HR ES FR SK EE DK BE HU LU PT DE UK EL SI MT CY NL
DESI Report 2019 – Connectivity 24Internet traffic per capita in western Europe* is currently 44 GB per month. By 2022, this figure
is forecast to go up to 117 GB, while in the USA it will be 255 GB, followed by South Korea with
218 GB. Internet traffic will continue to be mainly fixed in all world regions.
IP traffic per capita (GB per month and region), 2017 - 2022
300
2017 2022
250
200
150
100
50
0
EU (Western Europe) US Japan South Korea Russia China World
Source: Cisco, VNI Forecast Highlights
Internet traffic per capita in western Europe* is well below the Percentage of mobile data share of total Internet traffic, 2017 - 2022
35%
figures for the US and South Korea. 2017 2022
30%
Mobile data traffic is a fraction of total IP traffic, and this will
25%
remain so despite the increase forecasted by Cisco. Mobile
data currently represents 6 % of European internet traffic, 20%
and this ratio is forecast to reach 10 % by 2022. 15%
Nevertheless, the share of mobile traffic will be significantly 10%
higher in Japan (14 %), China (18 %) and Russia (32 %). By 5%
contrast, only 6 % of US's traffic will go through mobile
0%
networks by 2022. EU (Western US Japan South Korea Russia China
Europe)
* France, Germany, Italy, Spain, Sweden, the United Kingdom, Denmark, Source: Cisco, VNI Forecast Highlights
Netherlands, Belgium, Ireland, Norway and Iceland.
DESI Report 2019 – Connectivity 25Mobile traffic per capita in western Europe* is currently 2.4 GB per month. By 2022, this figure is forecast to
reach equally 12 GB in both western Europe and in China, while in the USA it will be 17 GB. The average
mobile speed in western Europe is currently 16 Mbps, ahead of the USA, with 13.5 Mbps.
Average mobile speed (Mbps per region), 2017 - 2022
60
2017 2022
50
40
30
20
10
0
EU (Western Europe) US Japan South Korea Russia China World
Source: Cisco, VNI Forecast Highlights
Average mobile traffic per capita, GB per month, 2017 - 2022
Average mobile traffic per capita in in western Europe is well 30
below the figures for the USA, Japan, South Korea and 2017 2022
25
Russia. Mobile traffic per capita is forecasted to skyrocket by
2022. It is currently 2.4 GB per capita in the EU and it is 20
forecast to reached 12 GB per capita by 2022. Nevertheless, 15
the traffic per capita is significantly higher in the USA (3.8
GB), Japan (5.3 GB), South Korea (5.8 GB) and Russia (4.2 10
GB). Only China, with 1.4 GB per capita, is currently below 5
European levels. By 2022, Russia will have taken the lead 0
with 25.5 GB of mobile traffic per capita, followed by South EU (Western US Japan South Korea Russia China
Korea with 23.5 GB. Europe)
* France, Germany, Italy, Spain, Sweden, the United Kingdom, Denmark, Source: Cisco, VNI Forecast Highlights
Netherlands, Belgium, Ireland, Norway and Iceland.
DESI Report 2019 – Connectivity 2667 % of EU households subscribe to bundled services. Double play and triple play bundles are available in all Member States, with an EU average of 31 % and 25 % respectively. Quadruple play is the least used with 11 %. Bundled services are most widely used in Malta, France, When it comes to quadruple play, the picture is more polarised. Portugal, the Netherlands and Greece (>80 %), while the While the EU average is 11 %, there are 17 Member States, where lowest take-up is in Czechia, Lithuania and Sweden (
20 % of EU households subscribe to converged bundles (including both fixed and mobile
services). However their popularity varies widely among Member States, ranging from 0 % to 61 %.

                                                                                        Households subscribing to telecoms services as part of a
                                                                                            bundle in the EU (% of households), July 2017
While 65 % of homes subscribe to bundles including fixed                    70%
broadband, only 20 % of households chose bundles with mobile                60%
                                                                                                                         Source: Communications Committee

services.                                                                   50%
Spain, Luxembourg and France lead in the take-up of                         40%
converged bundles (>50 %). However, converged bundles have                  30%
a penetration rate of less than 20 % in 16 Member States.
                                                                            20%
                                                                            10%
                                                                             0%
                                                                                       Fixed broadband    Fixed voice          Pay TV              Mobile

                          Households subscribing to converged bundles (% of households), July 2017*
 70%
                                                                                                                     Source: Communications Committee
 60%

 50%

 40%

 30%

 20%

 10%

  0%
        ES   LU   FR   PT   MT    EE     NL   BE   RO   SI   EL   EU   PL   BG    CY     IT   UK   CZ    HR   IE    SK    DK   HU   DE   AT   SE     LV     LT
   *Data for Finland is not available.
   DESI Report 2019 – Connectivity                                                                             28
Broadband take-up tends to be lower in Member States where the cost of broadband access
accounts for a higher share of income, but this correlation is not strong. Based on the Broadband
Price Index, fixed broadband is most affordable in Finland, France, Germany and Austria.
Income plays an important role in broadband take-up. The lowest Fixed broadband household penetration by income quartiles, 2014-2018
income quartile has a take-up rate for fixed broadband of just 100%
60_% as opposed to 90 % in the highest income quartile. The
80%
take-up in the EU for average income is 76.6 %.
60%
The Broadband Price Index is a score* that measures the prices of
twelve representative broadband baskets as a percentage of 40%
household income. The baskets include three speed categories (12-
30 Mbps, 30-100 Mbps and at least 100 Mbps) and four types of 20% Low income Medium low income
Medium high income High income
products (standalone internet, internet + TV, internet + fixed
Average income
telephony and internet + TV + fixed telephony). 0%
* 0 to 100, 100 being the best 2014 2015 2016 2017 2018
Source: Eurostat
Broadband Price Index (0-100), DESI 2019*
100
90
80
70
60
50
40
30
20
10
0
FI FR DE AT LT IT LU SK CZ LV EU HU NL DK PL SE RO UK EE BE BG PT ES IE SI HR CY EL
* No income data available for MT, therefore Broadband Price Index not calculated.
Source: European Commission based on Empirica and Eurostat
DESI Report 2019 – Connectivity 29Prices* of fast broadband access tend to decrease over time but vary widely between Member
States.
Broadband retail prices (EUR PPP) – standalone offers, 2014 - 2018
Broadband retail prices (minimum prices, based on Purchasing
Power Parity/PPP) vary between EUR 10 and EUR 38 for a 60
12Mbps-30Mbps 30Mbps-100Mbps above 100 Mbps
standalone offers with a minimum download speed of 12 Mbps. The
50
minimum prices were the lowest in Bulgaria (EUR 10), Hungary (EUR
40
11) and Romania (EUR 13), and the highest in Ireland (EUR 38),
30
Spain (EUR 33), Slovenia (EUR 31) and Cyprus (EUR 30).
20
As for offers of at least 100 Mbps, the EU average is EUR 35 with a
10
substantial decrease from 2014, where the average was EUR 60.
* Based on the least expensive monthly prices available and expressed in euros, 0
adjusted for purchasing power parity, VAT included. 2014 2015 2016 2017 2018
Source: European Commission Services based on Empirica and Van Dijk,
Fixed Broadband Prices in Europe, annual report. 2014-2018.
Fixed broadband retail prices (EUR PPP) - standalone offers, October 2018
45
12Mbps-30Mbps 30Mbps-100Mbps
40
35
30
25
20
15
10
5
0
BG HU RO LT LV CZ EE SE AT SK FI PL DE FR EU EL IT NL DK MT BE HR PT UK LU CY SI ES IE
Source: European Commission services based on Empirica, Fixed Broadband Prices study, 2018
Empirica, Fixed Broadband Prices in Europe (2018)
DESI Report 2019 – Connectivity 30Prices* of triple play bundles** which include fast broadband access, fixed telephony and
television have fallen by 21 %, on average, since 2014. The largest decrease has been in higher
speeds, with a 30 % price decrease between 2014 and 2018.
Broadband retail prices (EUR PPP) – bundles including broadband,
The minimum prices for triple play bundles that include broadband fixed telephony and television, 2014-2018
access (with a download speed between 12 and 30 Mbps), fixed 12Mbps-30Mbps 30Mbps-100Mbps above 100 Mbps
90
telephony and television vary between EUR 26 and EUR 65 in the 80
EU. The lowest prices were recorded in Slovakia (EUR 26), Lithuania 70
60
(EUR 26.5) and Latvia (EUR 27), while the highest were in Sweden 50
(EUR 65), Belgium (EUR 63), Spain (EUR 57), Ireland (EUR 55), and 40
Malta (EUR 54). 30
20
The EU average prices for at least 100 Mbps offers is EUR 53 with a 10
0
decrease of 30 % from 2014. 2014 2015 2016 2017 2018
*Based on the least expensive prices available and expressed in euros, adjusted for Source: European Commission Services based on Empirica and Van Dijk,
purchasing power parity, VAT included. **No data available for Finland. Fixed Broadband Prices in Europe, annual report. 2014-2018.
Fixed broadband retail prices (EUR PPP) - bundles including broadband, fixed telephony and television, October 2018
70
12Mbps-30Mbps 30Mbps-100Mbps
60
50
40
30
20
10
0
SK LT LV BG FR RO IT CZ AT EE HU NL PL EL CY DE EU HR SI UK PT DK LU MT IE ES BE SE
Source: European Commission services based on Empirica, Fixed Broadband Prices study, 2018
Empirica, Fixed Broadband Prices in Europe (2018)
DESI Report 2019 – Connectivity 31Prices of mobile voice and data plans vary greatly across Europe. Prices have fallen in all but one
consumption basket (500 MB + 100 calls). The largest price drop is in the most data-intensive
basket (5 GB + 100 calls) which has fallen by 20 % since 2017.
Mobile broadband prices (EUR PPP) - handset use in the EU, 2017 - 2018
Looking at the usage basket of 300 voice calls and 1GB data, 35
2017 2018
minimum prices range between EUR 8 and EUR 59 with an EU 30
average of EUR 22 (EUR 2 cheaper than a year ago). 25
20
The cheapest countries are Luxembourg, Italy, Slovenia,
15
Austria and France, with minimum prices below EUR 10.
10
By contrast, prices are high in Bulgaria (EUR 59), Greece (EUR 5
56), Hungary (EUR 47), Slovakia (EUR 46) and Czechia 0
Bulgaria (EUR 43). 0.1GB + 30 0.5GB + 100 1GB + 300 2GB + 900 2GB + 100 5GB + 100
calls calls calls calls calls calls
Source: Commission services based on Empirica, Mobile Broadband Prices study, 2017- 2018
Mobile broadband prices (EUR PPP) - handset use, 1GB + 300 calls, 2018
70
60
50
40
30
20
10
0
LU IT SI AT FR RO PL UK EE LT DK DE SE LV NL FI IE ES BE EU HR PT CY MT CZ SK HU EL BG
Source: Commission services based on Empirica, Mobile Broadband Prices study, 2018
DESI Report 2019 – Connectivity
32Prices of mobile broadband plans for laptops and tablets show large differences across Europe.
On average, prices have decreased for all types of consumption baskets since 2016, ranging from
5 % to 16 %.
Mobile broadband prices (EUR PPP) - laptop/tablet use in the EU,
Looking at 5 GB data-only plans for laptops, minimum prices 2017 - 2018
range from EUR 3.7 to EUR 42. The EU average (EUR 17) is 35
2017 2018
below the price of fixed standalone offers of 12-30 Mbps. 30
The cheapest countries are Italy, Poland, Sweden, Latvia and 25
Austria, with prices below EUR 10. At the same time, prices are 20
very high in Cyprus (EUR 43). 15
Prices from laptops have decreased for all types of 10
consumption baskets since 2016. The largest price drop is in 5
the highest consumption basket (20 GB), with a 21 % 0
decrease. 0.5GB 1GB 2GB 5GB 10GB 20 GB
Source: European Commission services based on Empirica, Mobile Broadband Prices study, 2017-
2018
Mobile broadband prices (EUR PPP) - laptop/tablet use, 5GB, 2018
50
45
40
35
30
25
20
15
10
5
0
IT PL SE SI LV AT FR EE FI UK DK MT RO LU LT EU HR BG PT DE IE NL HU SK BE EL CZ ES CY
Source: European Commission services based on Empirica, Mobile Broadband Prices study, 2018
DESI Report 2019 – Connectivity
33Mobile prices worldwide: compared with the USA, Japan and South Korea, the EU is cheaper for
data-intensive handset usage baskets. Compared with the USA, the EU is cheaper for all data-
only (laptop/tablets) packages.
On average, the EU performs well in all data consumption Mobile broadband prices (EUR PPP) - handset use in the EU and the US,
Japan and Korea, 2018
baskets, with much lower prices than South Korea and Japan, 45
EU US Korea Japan
40
even in high-consumption baskets (5 GB). When comparing EU 35
and US prices, prices are lower for all baskets in the EU, except 30
for the basket with 1 GB data and high intensity of voice calls 25
20
(2GB + 900 calls). 15
Regarding the handset use baskets with less than 2 GB data 10
5
usage, the USA offered flat rates for calls and text messages 0
for EUR 26.7 in 2018, while in South Korea 5 GB is included in 0.1GB + 30 0.5GB + 100 1GB + 300 2GB + 900 2GB + 100 5GB + 100
all data consumption baskets. calls calls calls calls calls calls
Source: European Commission services based on Empirica, Mobile Broadband Prices study,
2018
Mobile broadband prices (EUR PPP) - laptop/tablet use in the EU, the US,
Korea and Japan, 2018 Regarding laptop/tablet baskets, the USA is more expensive
40
EU US Korea Japan than the EU for all baskets. The least expensive data-only offer
35
30
in the USA allows up to 10 GB of data for EUR 22.
25 In the case of Japan, prices have substantially dropped from
20 previous years, and baskets of up to 20 GB can be found for
15 EUR 10.8 on average. This is what makes Japan the best
10
performer in this category.
5
0 On average, the EU performs well in lower baskets, but prices
0.5GB 1GB 2GB 5GB 10GB 20 GB are higher than South Korea and Japan for high-end baskets
Source: European Commission services based on Empirica, Mobile Broadband Prices study, (especially 10 GB and 20 GB).
2018
DESI Report 2019 – Connectivity
34Telecoms markets: general trends
Member States have actively been pursuing the A few Member States have earmarked investments to
connectivity objectives of the gigabit society. help develop 5G. Many operators have started or
announced 5G trials and are exploring partnerships and
While a few of them will not achieve the 30 Mbps ubiquitous network sharing agreements.
coverage target by 2020, the focus has now shifted to
achieving the 2025 target for all EU households to have The pioneer band is 3.4 – 3.8 GHz, followed by the 700
access to at least 100 Mbps connectivity (upgradable to MHz band. The first auctions have already taken place,
Gbps). https://ec.europa.eu/digital-single- and the voluntary peer review under the Radio Spectrum
market/en/policies/improving-connectivity-and-access Policy Group also seems to have generated interest
among administrations. Most auctions in the 3.4 – 3.8
Ultra-fast broadband coverage is constantly improving. GHz band were designed to enable large blocks to be
While this is driven by new fibre roll-outs in many Member acquired, facilitating the provision of 5G services. They
States, in others it can be attributed to the wide availability also yielded a reasonable price (around
of updated legacy networks (e.g. Germany, Belgium). Take- €0.05/pop./MHz).
up of ultra-fast networks is steadily increasing and seems to
broadly correlate with the affordability of prices. Only a few In the 700 MHz band, the plans of some Member States
Member States have not yet updated their national to reserve spectrum for public protection and disaster
broadband plans to reflect the gigabit objectives. relief raise concerns about avoidable spectrum scarcity.
Almost all Member States have launched their 5G strategies In terms of market developments, content drives
focusing on the availability of spectrum, 5G testing and competition and the increasing take-up of quad-play
designating 5G cities. bundled offers drives a consolidation trend between
fixed and mobile operators in markets where the two
A number of regional agreements for 5G corridors have businesses were distinct up to now.
been signed for automated driving.
Europe's Digital Progress Report 2019 – Connectivity 35Development of national broadband plans (NBPs)
Since the adoption of the Digital Agenda for Europe 2020 will depend on the utilisation of appropriate means, including
targets — i.e. coverage of 30 Mbps download for all legal measures and financial resources.
Europeans and take-up of 100 Mbps subscriptions by at It is therefore important that Member States have the
least 50 % of EU households — all Member States have necessary resources and tools in place, rather than merely
gradually adopted NBPs and started to implement them, policy targets, to facilitate the effective rollout of broadband
albeit with various time lines ranging from 2017 to 2022. infrastructure on their territories.
Some NBPs are integrated into broader strategic
approaches, while others are documents specifically Some Member States (e.g. Sweden, Finland, and the
dedicated to broadband deployment. Netherlands) have already adapted their NBP targets to the
new EU broadband targets for 2025 proposed by the
Content-wise, nearly all Member States’ NBPs focus on Commission in its September 2016 Communication
achieving minimum download speeds — in most cases ‘Connectivity for a Competitive Digital Single Market - Towards a
in terms of coverage (availability of commercial offers European Gigabit Society’ (see Table next slide).
in a given territory) and sometimes also penetration
(actual take-up in the form of internet subscriptions). In To facilitate the exchange of best practice between Member
contrast, emphasis on upload data rates is rather States on developing their 5G Road Maps and adapting
exceptional (e.g. Denmark, Luxembourg or Ireland; see also their NBP’s to the gigabit targets for 2025, the Commission
Table next slide). In addition, operational measures to foster set up the COCOM Working Group 5G in 2017. It finished its
demand for digital applications and high-speed internet work in October 2018 and published a final report (see
access are relatively infrequent. https://ec.europa.eu/digital-single-market/en/news/5g-
observatory-reports-important-progress-5g-roadmaps). This
Declared broadband targets in NBPs are, first and foremost, working group also identified common elements, which can
guideposts, whose practical feasibility and actual success become part of the revised NBPs.
Europe's Digital Progress Report 2019 – Connectivity 36Broadband Targets of NBPs
MS NBP-Targets MS NBP-Targets
Austria 99% coverage with 100 Mbps by 2020 Italy 100 % coverage with 30 Mbps by 2020
85 % coverage with 100 Mbps by 2020
Belgium 50% household (HH) penetration with 1 Gbps by 2020 Latvia 100% coverage with 30 Mbps by 2020
50% HH penetration with 100 Mbps by 2020
Bulgaria 100% coverage with 30 Mbps by 2020 Lithuania 100% coverage with 30 Mbps by 2020
50% of households and 80% of businesses subscribing >100 50% HH penetration with 100 Mbps by 2020
Mbps by 2020
Croatia 100% coverage with 30 Mbps by 2020. Luxembourg 100% coverage with 1 Gbps downstream and 500 Mbps upstream by
50% HH penetration with 100 Mbps by 2020 2020
Cyprus 100% coverage with 30 Mbps by 2020. Malta 100% coverage with 30 Mbps by 2020
50% HH penetration with 100 Mbps by 2020 50% HH penetration with 100 Mbps by 2020
Czechia 100% coverage with 30 Mbps by 2020 Netherlands 100% coverage with 100 Mbps by 2023 (updated 2018)
50% HH penetration with 100 Mbps by 2020 Vast majority should take advantage of 1 Gbps by 2023
Denmark 100% coverage with 100 Mbps download and 30 Mbps upload Poland 100% coverage with 30 Mbps by 2020
by 2020 50% HH penetration with 100 Mbps by 2020
Estonia 100% coverage with 30 Mbps by 2020 Portugal 100% coverage with 30 Mbps by 2020
60% HH penetration with 100 Mbps by 2020 50% HH penetration with 100 Mbps by 2020
Finland 100% coverage with at least 100 Mbps by 2025 (updated 2018) Romania 100% coverage with 30 Mbps and 80% coverage with over 30 Mbps by
2020 (updated 2018 to 2020 targets)
45% HH penetration with 100 Mbps by 2020
France 100% coverage with 30 Mbps by 2022 Slovakia 100% coverage with 30 Mbps by 2020
Greece 100% coverage with 30 Mbps by 2020 Slovenia 96% coverage with 100 Mbps, 4% coverage with 30 Mbps by 2020
50% HH penetration with 100 Mbps by 2020
Germany 100% coverage with 50 Mbps by 2018 Spain 100 % coverage with 30 Mbps by 2020
50 % HH penetration with 100 Mbps by 2020
Hungary 100% coverage with 30 Mbps by 2018 Sweden 95% coverage with 100 Mbps by 2020. 98% coverage with 1 Gbps, by
50% HH penetration with 100 Mbps by 2020 2025. 50% HH penetration with 100 Mbps by 2020 (updated 2018)
Ireland 100% coverage with 30 Mbps by 2020 United Full fibre rollout to 15 million premises by 2025 (updated 2017)
50% HH penetration with 100 Mbps by 2020, expected Kingdom and 100% fibre coverage by 2033
upstream bandwidth of 17-21 Mbps
Source: atene KOM: Study on National Broadband Plans in the EU (SMART 2014/0077), Commission services
Europe's Digital Progress Report 2019 – Connectivity 2EU support for NBP implementation The European Investment and Structural Funds (ESIF) 2017 (with currently 115 members). It brings together national support the NBP implementation by providing almost € 6bn in and regional authorities active in this field with the support of a grants in 2014-20. 56% of the planned projects have already permanent secretariat (Brussels based Support Facility). An been signed. The Commission proposed that this support updated version of the Broadband investment Guide of the continues in 2021-2027 with the focus on very high capacity Commission will be published in 2019. networks (VHCNs). Work to improve the mapping of broadband has also continued The European Fund for Strategic Investment (EFSI) with the review of existing national initiatives. An EU Broadband guarantees and the European Investment Bank (EIB) lending Mapping Portal was launched in spring 2019. The Commission activity also support telecoms infrastructure projects: as of has commissioned a study to develop an EU broadband coverage February 2019, more than € 11,7bn had been mobilised, with methodology and will contribute to the work of the Body of € 3,1bn from EFSI and the EIB. The Commission proposes to European Regulators for Electronic Communications (BEREC) to continue this support beyond 2021 with the InvestEU provide guidelines on the geographical surveys and forecasts of programme. network deployments set out in the European Electronic The Connecting Europe Broadband Fund was launched in Communications Code (Directive (EU) 2018/1972). 2018 and is expected to unlock additional investments of The Commission has also shared with the Member States a “rural between € 1bn and € 1.7bn. A initial project for an open access proofing questionnaire”, aiming to ensure that the connectivity network to cover 135.000 households in some rural areas of needs of rural areas are given the necessary attention in case of Croatia has already been signed. modification requests concerning broadband programmes financed The Commission has also tabled a proposal for a Connecting under ESIF. Europe Facility 2021-2027 with € 3bn in grants to different A first decision on authorising State aid to deploy gigabit digital infrastructure investments (e.g. 5G corridors, VHCN for networks in areas, where an NGA network is already present, socio-economic drivers, backbone networks and local wireless was approved in December 2018 (SA. 48 418, Bavarian gigabit network access connectivity to municipalities that builds on the pilot project), as well as a decision on take-up support through a WiFi4EU initiative). voucher scheme (SA.49 935, Superfast Broadband Project – The Commission continues to support the development of Greece). administrative capacity to design and implement NBPs through the Broadband Competence Offices Network launched in Europe's Digital Progress Report 2019 – Connectivity 38
Municipalities need more connectivity – WiFi4EU
The WiFi4EU initiative promotes free Wi-Fi access in public                                 Each voucher entitles the winning municipality to install a
spaces including parks, squares, public buildings, libraries,                               WiFi4EU network, which covers costs of up to € 15,000.
health centres and museums in municipalities throughout                                     In December 2018, the Commission awarded 2,800 vouchers
                                                                                            for a total of €42 million. The second call is ongoing with 3,400
Europe.                                                                                     vouchers equivalent to an additional € 51 million.
The first and second call for proposals were launched                                       The vouchers were allocated on a first come, first served basis.
respectively between the 7 and 9 November 2018, and                                         To ensure geographical balance, a minimum of 15 and a
between the 4 and 5 April 2019. Municipalities participated on a                            maximum of 224 vouchers (for the first call) have been
                                                                                            allocated to each country.
large scale, showing a genuine need for more connectivity. 21.                              Other calls are planned in 2019 and 2020 for a total budget of
500 municipalities registered; over a fifth of all European                                 the initiative amounting to EUR 120 million.
municipalities. 13,200 municipalities applied for a WiFi4EU
voucher in the first call, and a bit more than 10,000 again in the
second call.

250
                                                                                                           •         Total vouchers per country (1st call)
       224   224   224   224   224 224

200
                                         170

150                                            134
                                                     130   127
                                                                 117
                                                                       113
                                                                             97   93
100                                                                                    91   89

                                                                                                 59
 50
                                                                                                      34   33
                                                                                                                20     19   19   18   15   15        15
                                                                                                                                                15        15   15
                                                                                                                                                                    3
  0

      Source: European Commission

      Europe's Digital Progress Report 2018– Connectivity                                                                    39
EU harmonised spectrum underpins future wireless digital services within the EU
The EU harmonised spectrum for wireless broadband use Bands above 1 GHz provide additional capacity. They remain
amounts to 2090 MHz with a major increase coming from the partly unassigned in many Member States, but will play an even
more relevant role in the deployment of 5G services, in
harmonisation of the 26 GHz band. 41% of this spectrum was particular the 3.4-3.8 GHz band, which has been identified as
assigned for wireless broadband use across Member States at the primary 5G band in Europe.
the end of 2018 (68% if the 26 GHz is excluded). While only six Lack of assignment may be due to different reasons depending
Member States have assigned the 700 MHz band so far (one on the circumstances in each Member State, such as cross-
not in full), activity is expected to increase in 2019 as many border coordination or use for defence purposes.
Member States are preparing the necessary assignment In this context, and in view of different regulatory conditions
applicable to different bands, lack of assignment does not
procedures. necessarily mean non-compliance with EU law as there may be
legitimate reasons under EU law.
Assigned spectrum for wireless broadband in harmonised EU bands
(April 2019)
1 500
2,000
1 000
MHz
500
0
700 MHz 800 MHz 900 MHz 1.5 GHz 1.8 GHz 2 GHz paired 2.6 GHz 3.4-3.6 GHz 3.6 - 3.8 GHz 26 GHz
Source: Commission Services Note: Assigned spectrum includes guard bands
Europe's Digital Progress Report 2018– Connectivity 40Convergent spectrum management approaches are essential to support 5G investment
700 MHz band:
The 800 MHz band (the ‘digital dividend’) is currently assigned
Assigned in six Member States (DE, DK, FI, FR, IT*, SE). Other in all Member States (in two cases only partially) except in
countries are expected to authorise the band by 30 June 2020, Bulgaria, which benefits from the exception due to incumbent
unless there are justified reasons for a delay until mid-2022 at the military use under Article 1(3) of the Radio Spectrum Policy
latest.** Programme.
The 700 MHz band has generated lower sale prices than the 800 The Commission adopted Implementing Decision (EU)
MHz band in most Member States (except in France, where four 2018/661 on the extension of the 1.5 GHz band to provide 50
mobile network operators were competing, and Sweden, where MHz of additional download capacity for 5G services.
only 40 MHz was made available). Initial licences last slightly
longer, with an average of 17.4 years. The Commission adopted Implementing Decision
(EU)2019/235 to update the relevant technical conditions
3.4-3.8 GHz band: applicable to the 3.4-3.8 GHz band to make the band 5G-ready
Assigned (at least partially) in 25 Member States. Current uses as it has been identified as the primary pioneer band for 5G in
vary, six Member States have assigned the band (at least the EU.
partially) based on ‘5G conditions’ in accordance with Decision The Commission adopted Implementing Decision
(EU) 2019/235. The IT auction provided 2 blocks of 80 MHz and (EU)2019/784 to harmonise the technical conditions applicable
2 blocks of 20 MHz, and the price paid was significantly higher to the 26 GHz band (24250-27500 MHz). This band will be
than in other countries. essential for some of the envisaged 5G use cases such as
26 GHz band: enhanced mobile broadband, specific vertical services that
Currently only assigned for 5G use in Italy with 5 lots of 200 MHz. require short response times and extremely high data rates
and fixed wireless access for the provision of high-speed
The European Electronic Communications Code provides for a internet to households and businesses in areas with limited
common deadline to authorise and ensure that the 3.6 GHz and availability of fixed broadband technology.
26 GHz bands can be used by the end of 2020; 700 MHz will be
for wide coverage, 26 GHz for high local capacity and speed, and
3.6 GHz as the primary and universal spectrum band.
It is an established Union policy, enshrined inter alia in a number of recitals (e.g. 99, 134, 135) and Articles (e.g. 53, 54) of the EECC that
authorisation conditions conducive to investment in 5G deployment should avoid extracting excessive capital from the market, promote ambitious
infrastructure roll-out targets (including along rail and roads), enable innovative services, create opportunities for vertical services to access
spectrum, not artificially limit or apportion spectrum supply, in particular in the 3.4-3.8 GHz band where large blocks of spectrum should be made
available to operators to unleash the full 5G potential.
* The 700 MHz spectrum will be available for use in Italy from July 2022 as the authorities have invoked an exception as provided in Decision of the European Parliament
and the Council on the use of the 470-790 MHz band in the Union.
** A limited list of justified reasons is contained in the annex of the Decision of the European Parliament and the Council on the use of the 470-790 MHz band in the Union.
Europe's Digital Progress Report 2018 – Connectivity 41You can also read