CONSULTATION ON FURTHER WEIGHT INCREASE OF CHINA A SHARES IN THE MSCI INDEXES
←
→
Page content transcription
If your browser does not render page correctly, please read the page content below
CONSULTATION ON
FURTHER WEIGHT INCREASE OF
CHINA A SHARES IN THE MSCI
INDEXES
December 2018

This consultation may or may not lead to the implementation of any or all of the proposed changes in MSCI’s
indexes. Consultation feedback will remain confidential. MSCI may publicly disclose feedback if so requested by the
provider of the feedback. In that case, the relevant feedback would be published together with the final results of
the consultation.

                                                                                                                                            © 2018 MSCI Inc. All rights reserved.
                                                                                                                      Please refer to the disclaimer at the end of this document.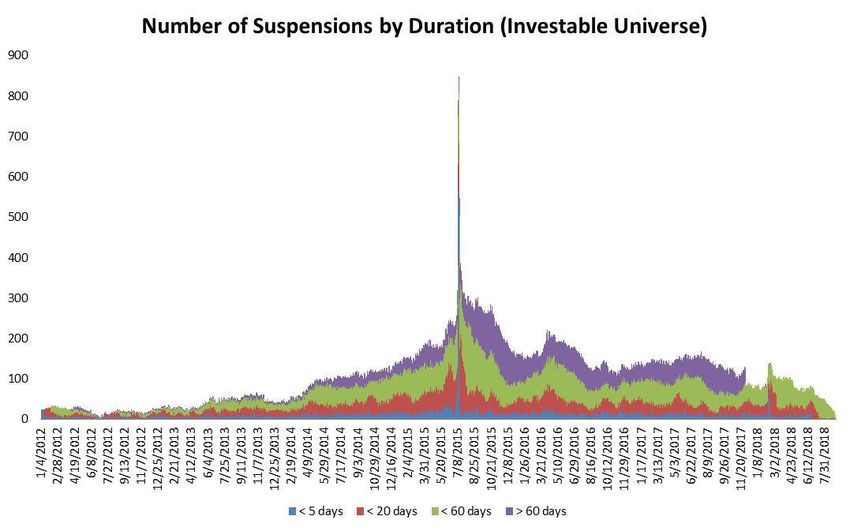
INTRODUCTION

 • The 5% initial inclusion of China A shares was successfully implemented in May and
   August 2018 with overwhelming positive feedback from market participants

 • MSCI is now launching this consultation on a further weight increase of China A shares in
   the MSCI Indexes

 • MSCI welcomes feedback from the investment community on the proposal by February
   15, 2019 and plans to announce its decision on or before February 28, 2019

 • This consultation may or may not result in changes in the MSCI Global Investable Market
   Indexes

                                                                                               2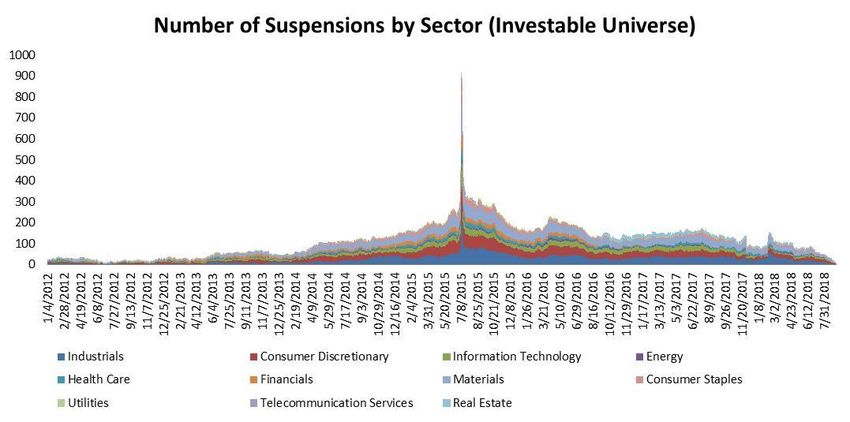
CONSULTATION PROPOSALS

                          Proposal                                        Timing
     1

         Increase the inclusion factor of China A Large              May 2019 and August
         Cap securities from 5% to 20% in two phases*                       2019

                              *7.5 percentage points in each phase

     2

            Add ChiNext to the list of eligible stock
                                                                          May 2019
                    exchange segments

     3
          Add China A Mid Cap securities with a 20%
                                                                          May 2020
                inclusion factor in one phase

                                                                                           3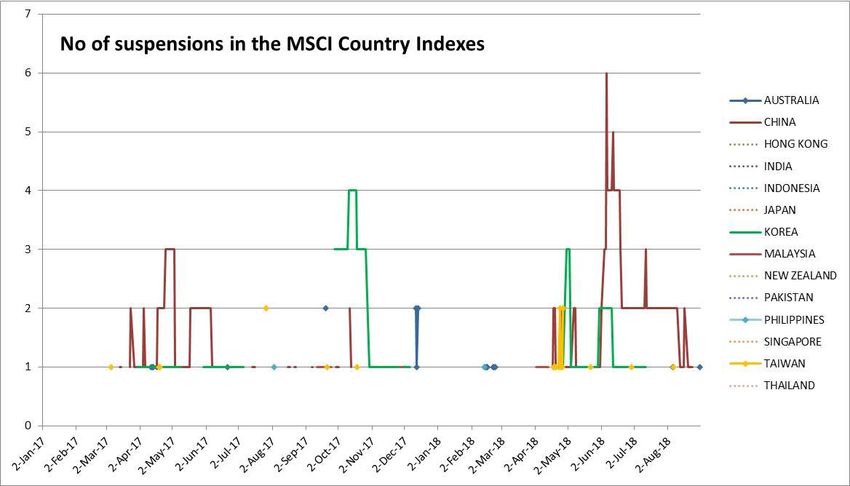
RATIONALE FOR THE PROPOSAL

    The broad participation in, and successful implementation of, the initial 5% inclusion
  provided strong evidence of positive market accessibility of the China A shares market via
                                       Stock Connect

                                     Stock Connect has proven to be a robust channel to access China A
       Stock Connect                 shares. Currently, Stock Connect daily quota and CNH liquidity are
        Robustness                 sufficient to address an inclusion factor that is a multiple of the current
                                                                       size

                                       Quadrupling of the Stock Connect daily limit, visible reduction in
    Market Accessibility
                                   trading suspensions and successful implementation of a closing auction
     Improvements                               mechanism on the Shanghai Stock Exchange

                                                                                                                 4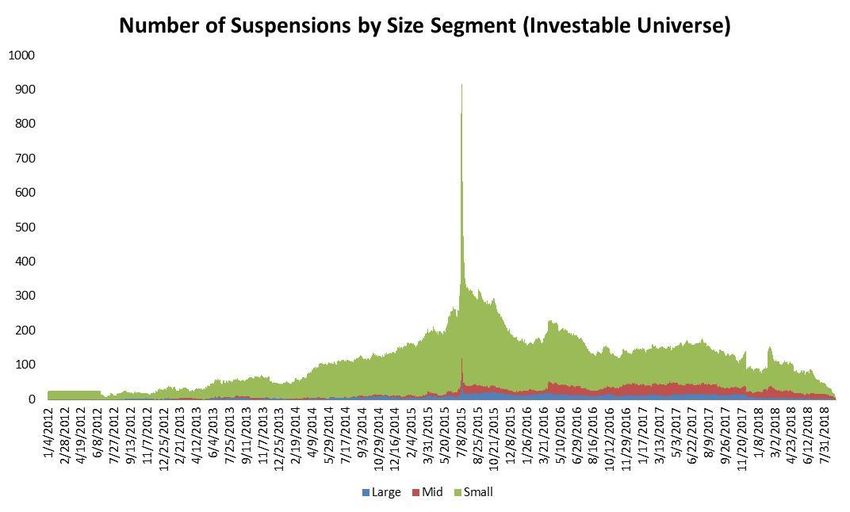
BROAD PARTICIPATION DURING THE INITIAL INCLUSION
  Since the announcement of the MSCI China A shares inclusion, more than 4,600 new Stock Connect
 accounts have been opened to trade China A shares and the total Northbound Connect portfolio value
                                       grew by US$46 billion

              Number of SPSA accounts                          Northbound Connect AUM
                       Number of SPSA accounts                           Connect AUM (RMB bn)
                                                                                                 665
                                             6363

                                                                 347

                1700

    Before inclusion announcement           Sep-18   Before inclusion announcement              Sep-18
              (June 2017)                                      (June 2017)

                  Source: MSCI, HKEX
                                                                                                         5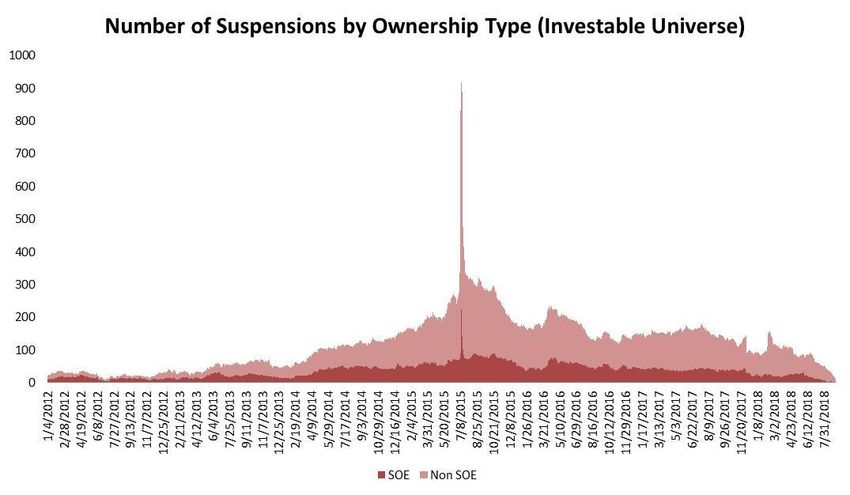
PRO-FORMA WEIGHT IN MSCI EM INDEX
           With an increase of the inclusion factor of China A Large Cap securities to 20%, the pro forma
           index weight of China A shares in the MSCI Emerging Market Index would be 2.8% in August
           2019. The addition of China A Mid Cap securities with an inclusion factor of 20% in May 2020
                               would increase the pro forma weight further to 3.4%

                                                                                Saudi                                               Saudi
                                                                               Arabia,                                             Arabia,
          Others,                                                               2.5%                                                2.5%
          20.6%                                                   Others,                                              Others,
                                    China x A,                    19.6%                    China x A,                                         China x A,
                                                                                                                       19.4%
                                      30.6%                                                  29.1%                                              28.9%
                                                                                                                                  MSCI EM
Brazil,                                                                       MSCI EM
                    Current                                  Brazil,                                             Brazil,          with 20%
5.8%
                                                             5.5%
                                                                              with 20%
 South              MSCI EM                                                                                      5.4%             China A
Africa,
                                                              South           China A LC                          South
 6.2%
                                                              Africa,                                             Africa,          LC+MC
                                                               5.9%                                                5.8%
     India,                                                          India,                                              India,
                                   Korea,                                                  Korea,                                            Korea,
      9.3%                                                            8.8%                                                8.8%
                                   14.8%                                                   14.0%                                             13.9%
                    Taiwan,                      China A                       Taiwan,                  China A                   Taiwan,                  China A
                     12.2%                       0.71%                          11.6%                   2.82%                      11.5%                   3.36%
                                                 Large Cap #:                                           Large Cap #:
                                                                                                                                                           Large Cap +
                                                 235                                                    249
                                                                                                                                                           Mid Cap #: 434
                                                                                                        (14 ChiNext)
                                                                                                                                                           (31 ChiNext)

                                                                              August 2019                                          May 2020

                              Data as of September 3, 2018                                                                                                          6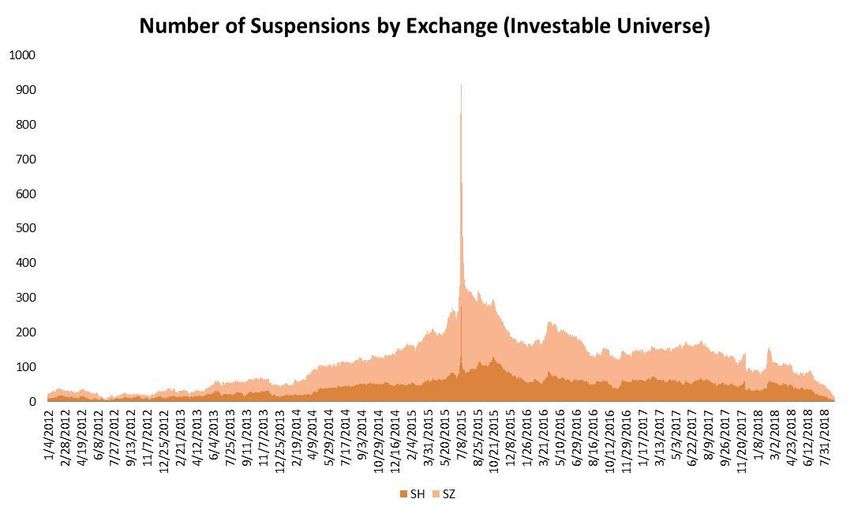
MARKET LIBERALIZATION CONTINUES
           The pace of market opening continued to accelerate in 2018 with more than 10 opening measures
                                                    year to date

                                          Latest opening measures in the China financial sector
                                                                        May 18                                                                                        Aug 18
                                                                        MSCI                                                                                          MSCI
Nov 17          Apr 18             Apr 18               May 18          successfully       June 18           June 18                         August 18                successfully
HKEX            PBoC               China granted        HKEx introduced implemented        Shanghai          SAFE removed                    SSE                      implemented
launched        quadrupled         Japan Rmb 200        USD/HKD         the first 2.5% A   issued            monthly repatriation            implemented              the second
RDVP for        daily quota of     billion RQFII        collateral      shares inclusion   consultation      cap and principal lock          closing auction          2.5% A shares
Connect         Stock Connect      quota, third         enhancement                        on closing        up period, giving               similar to SZSE          inclusion
                                   largest after HK     service in                         auction           QFII/RQFII the ability to       on August 20,
                                   and USA              Connect                                              access FX hedging               2018
                                                                                                             instruments and
                                                                                                             simplifying document
                                                                                                             filing

                   Apr 18        Apr 18               May 18                                                       July 18               July 18
           SAFE granted          SAFE widened         CSRC released                                       China opened                   Ministry of Commerce to consult
      QDII quota of US$          quotas of QDLP       Administrative                                          A shares to                on reducing the lock up period
        8.33 billion to 24       and QDIE             Measures for                                        eligible foreign               on listed company investments
      institutions after a       programs by US$      Foreign-Invested                                          individual               by foreign strategic investors
          three-year halt        5 billion each       Securities                                                 investors               from 3 years to 1 year
                                                      Companies

                                                                                                                                                                                 7
VISIBLE IMPROVEMENT IN TRADING SUSPENSIONS
# of trading suspensions in MSCI China A International IMI Index
90 900
# of large cap suspensions
70 700
9 Jul 2015
# of mid cap suspensions
Large Cap: 56 # of small cap suspensions (Right)
Mid Cap: 76
Small Cap: 794
50 ~ ~ ~ 500
30 ~ ~ ~ 300
1 June 2017
25 Large Cap: 16 250
Mid Cap: 12
Small Cap: 119
20 5 Sep 2018 200
Large Cap: 0
Mid Cap: 0
15 Small Cap: 2 150
10 100
5 50
0 0
Sep/2014 Sep/2015 Sep/2016 Sep/2017 Sep/2018
8CHINEXT REPRESENTS 20% OF THE CHINA A SHARES INVESTMENT
OPPORTUNITY SET
• The ChiNext board represents around one-fifth of the total China A shares opportunity set in terms of number of
stocks and free float adjusted market capitalization. It has a larger free float adjusted market capitalization than
the Shenzhen main and SME boards
• ChiNext securities are currently accessible through the expansion of Stock Connect. There are currently 194
ChiNext stocks eligible to be traded via Stock Connect
Distribution of A shares: free float
Distribution of A shares: # of stocks
market capitalization
Shenzhen Shenzhen
ChiNext ChiNext
21% 20%
Shanghai
Main
40% Shanghai
Main
Shenzhen 49%
SME
Shenzhen
18%
SME
26%
Shenzhen Shenzhen
Main Main
13% 13%
Data as of September 3, 2018; Based on all listed China A shares in Shanghai and Shenzhen Stock Exchanges 9COMPARISON OF LISTING REQUIREMENTS
• Listing requirements of ChiNext board are not materially lower than the main board/SME board
• Most tech companies made their debut in ChiNext, which is positioned as China’s “Nasdaq”
ChiNext Market
Items Main Board & SME Board
Criteria I Criteria II
Positive net profit in the last 3 Positive net profit in the past 2
Net Profit consecutive years and the aggregate consecutive years, and accumulated Positive net profit in last one year
value is no less than RMB 30 million profit no less than RMB 10 million
No less than RMB 50 million in revenue during the past year and >30%
Accumulated revenue in past 3 years revenue growth during the past two years
Revenue/ no less than RMB 300 million, or
Cash Flow accumulative net operating cash flow
no less than RMB 50 million.
Tangible asset ratio > 80% No less than RMB 20 million at the end of the most recent reporting period
Net Assets with no uncovered losses
A total share capital of no less than RMB 30 million after the IPO
Total stock capital before issuance is
Share Capital
no less than RMB 30 million
Others Shall not be subject to any of (6) circumstances which adversely affect its ongoing profitability
Source: Shenzhen Stock Exchange 10KEY DISCUSSION QUESTIONS
• Is 20% inclusion factor for both Large and Mid Cap securities appropriate for the next phase of
A shares inclusion?
─ Are you anticipating any accessibility constraints that could make the proposed weight
increase challenging?
• The proposed implementation of the increase in inclusion factor to 20% for China A Large Cap
securities would coincide with the reclassification of the MSCI Saudi Arabia and MSCI
Argentina Indexes to Emerging Markets.
─ Is the management of potential turnover an important consideration?
• Is the differentiated treatment between China A Large and Mid Cap securities appropriate?
─ How much time would you require to be ready to cover the additional 168 China A Mid Cap
securities?
• Do you agree with the addition of ChiNext to the list of eligible stock exchange segments for
China?
─ Are you already invested in ChiNext securities?
11REVIEW OF EXISTING ACCESSIBILITY CONSTRAINTS
The China A shares market has achieved significant progress in market opening. However, MSCI believes
further progress could be made with respect to its market accessibility standards and is seeking feedback
from international institutional investors as to what further improvements could facilitate the
implementation of the proposal
1. Trading suspensions: while there has been visible improvement lately, trading suspensions in the China A
shares market remain unique when compared to other emerging markets. As a reminder, MSCI does not
include and will remove stocks in prolonged suspension from the index
2. Alignment of international settlement cycle: China currently operates on a T+0/1 settlement cycle.
Despite the availability of market solutions on T+1/2 DVP/RDVP through Stock Connect, the short
settlement cycle onshore continues to pose operational challenges to global investors, especially for
those based outside Asian time zones
3. Access to hedging and derivatives vehicles: Exchange restrictions placed on China A shares index
licensing of certain listed futures and options as well as certain leveraged and inverse leveraged
investment instruments, whether onshore or offshore, continue to hamper investors’ ability to manage
risk and gain exposure beyond the cash market
4. Access to CNY for stock settlement: The current pool of CNH liquidity remains sufficient to address an
inclusion multiple the size of 5%. However, direct access to CNY for stock settlement could represent a
more efficient FX option for international investors and financial intermediaries
12REVIEW OF EXISTING ACCESSIBILITY CONSTRAINTS (CON’T)
5. Trading Holidays: As Mainland China and Hong Kong observe different holiday schedules, Stock Connect
is not open to international investors when Hong Kong is on holiday
6. Access to IPOs and ETFs: IPOs and ETFs remain outside the scope of Stock Connect
7. Stock Lending and Borrowing: While short selling is technically allowed, there is no functioning stock
lending and borrowing market. This hampers investors’ ability to implement their investment views
8. Stability of the Stock Connect universe: Given that the eligibility universe of Northbound Connect is tied
to non-MSCI indexes, there is a dependency and forced turnover issue in the maintenance of MSCI
Indexes
9. Omnibus in Stock Connect: Given the implementation of the Broker-to-Client Assigned Number (BCAN)
in Stock Connect, a functioning omnibus structure may need to be developed to allow for efficient
transactions and achieving best execution
13APPENDIX INDEX WEIGHT BY SECTOR AND SHARE CLASS HYPOTHETICAL FULL INCLUSION SCENARIO
INDEX WEIGHT COMPARISON BY SHARE CLASS AND SECTOR

               Index Weight by Share Class                                                                 Index Weight by Sector

                                                      22.7%                                                                                        24.2%
       ADR                                                                          Communication Services
                                                         24.8%
                                                                                                                                                 22.5%
                                                                                                 Financials

                                                          25.1%                                                                            20.0%
     P CHIP                                                                         Consumer Discretionary
                                                              27.4%
                                                                                                                       5.9%
                                                                                                Industrials

                                      12.7%                                                                            5.3%
   RED CHIP                                                                                     Real Estate
                                        13.8%
                                                                                                                       5.2%
                                                                                                    Energy

                                                                 28.9%                                               4.2%
         H                                                                                     Health Care
                                                                      31.5%
                                                                                                                     3.7%
                                                                                    Information Technology

                   0.2%                                                                                             3.4%
         B                                                                               Consumer Staples
                   0.2%
                                                                                                                    2.8%
                                                                                                   Utilities

                                    10.4%                                                                           2.7%
         A                                                                                       Materials
                     2.3%
                                                                                                               0%           10%        20%               30%   40%
              0%              10%             20%             30%             40%
                                                                                                         China with 20% China A LC+MC (post GICS change)

              China with 20% China A LC+MC          Current China                                        Current MSCI China (post GICS change)

                                                                                                         Current MSCI China

                          Data as of September 3, 2018. GICS changes effective September 28, 2018                                                                    15
A HYPOTHETICAL FULL INCLUSION SCENARIO
MSCI China (including A shares) could have a weight of 40% in MSCI Emerging Markets Index
Saudi Arabia,
2.2%
Others,
17.1%
H Shares
20.4%
Brazil, 4.8%
MSCI China,
A Shares
36.8%
MSCI Red Chips
40.3%
South Africa, Emerging China
9.0%
5.1%
Markets B Shares
0.1%
ADRs
P Chips
17.7%
India, 7.7% 16.0%
Taiwan,
10.1% Korea, 12.3%
Data as of September 3, 2018, assuming Stock Connect eligible Large and Mid Cap A shares are fully included in the MSCI Emerging 16
Markets IndexAPPENDIX Turnover Analysis
INCLUSION TIMING OF A SHARES WITH SAUDI ARABIA
 • While each market classification decision is independent, unsynchronized timing in the
   inclusion of the MSCI Saudi Arabia and Argentina Indexes and further inclusion of China A
   large cap shares could create additional market volatilities for a longer period of time
   •    Synchronized rebalancing could save turnover by US$ 3.3 billion on a pro forma basis

                                                                                                                                         Total EM Portfolio
                                                                               May 2019 -                        May 2020 -
                                                                                                                                           Turnover Post
                                                                               August 2019                       August 2020
                                                                                                                                             Inclusion

                                                                                                          Saudi Arabia & Argentina:
                              + Saudi Arabia (May/Aug 2019)         Saudi Arabia & Argentina: +$68bn
   Unsynchronized                                                                                                  -$1.2bn
                              + Argentina (May 2019)                      China A shares: -0.4bn                                                5.0%
   rebalancing                                                                                             China A shares: +60.9bn
                              + China A (May/Aug 2020)                    Rest of EM: -$67.6bn
                                                                                                            Rest of EM: -$59.7bn

                                                                        Saudi Arabia & Argentina:
                            + Saudi Arabia (May/Aug 2019)
                                                                                +$66.8bn
   Synchronized rebalancing + Argentina (May 2019)                                                                    n/a                       4.9%
                                                                        China A shares: +$60.5bn
                            + China A (May/Aug 2019)
                                                                          Rest of EM: -$127.3bn

                    Index weights are based on data as of 3 September 2018. Portfolio flows are estimated based on assets benchmarked to MSCI indexes as
                    of Dec 31, 2017, as reported on March 31, 2018 by eVestment, Morningstar and Bloomberg. The USD 3.3 billion turnover compares total
                    capital movements impacted by the synchronized vs. unsynchronized rebalancing.                                                            18
APPENDIX AN UPDATE ON TRADING SUSPENSIONS
VISIBLE REDUCTION IN TRADING SUSPENSIONS SINCE 2015

             Suspension Instances by Duration (Investable Universe)                                                           • Compared to 2015, overall suspension
3500                                                                                                                            instances have declined by 80% in
              26         High # of 1-day                                                                                        2018
3000                     suspension due to annual
                         shareholding meeting
                                                                                                                              • Reduction in trading suspensions is
2500
                                                                                                                                observed across different durations

                                                                 404
                                                                                                                              • Most suspension instances in China
2000
                                                                                                                                rarely last for only one day
1500                                                                                                                          • There remain many cases of
                                                                                   283                                          suspensions exceeding 3 months in
                                                201
1000                                                                                                257                         duration
                               65

500
                                                                                                                    113

  0
            2012              2013              2014             2015             2016              2017            2018

       1 --> 1 day   2 --> less than 1 week   3 --> less than 1 month   4 --> less than 3 months   5 --> more than 3 months

                                                                                                                                                                20
MAIN REASONS FOR IMPROVEMENTS IN SUSPENSION
Recent improvements in trading suspensions can be attributed to tighter enforcement of suspension
policies announced in 2016
Reasons for improved trading suspension performance
1. Improved quality of suspension disclosures – listed companies are now required to disclose restructuring
details related to the underlying assets, counterparties, transaction methods and content of restructuring
agreements. Exchanges strive to strictly control information disclosure consistency to curb “arbitrary
suspension announcements”
2. Narrowed scope for trading suspension – non-public offerings, transfer of control rights and external
investments are examples that do not justify long term trading suspension. Exchanges have been guiding
listed companies to reduce reliance on trading suspension when planning major corporate actions
3. Enhanced role of phased information disclosure – to reduce unnecessary suspension, exchanges urge listed
companies to speed up audit work and follow the approval procedures thereby shortening the duration of
trading suspension
21PROBABILITY OF REPEATED SUSPENSION
Probablity of current suspensions also suspended in the
following year
• By analyzing the trend of trading suspensions in Small Mid Large
82% 84%
two consecutive years, we derive the historical 78%
trend of repeated suspensions as a proxy for
64%
measuring probability of repeated suspension 58%
56% 55%
49% 48%
• The probability of a large cap A shares to be 41%
38% 39% 41% 40%
35%
suspended repeatedly has dropped to 10% in
2017 from 78% in 2014 22%
14%
10%
• The probability of a large cap SOE A shares to Probablity of current suspensions also suspended in the
following year
suspended repeatedly has dropped to 12% in 2012 2013 2014 2015 2016 2017
Non SOE SOE
2017 from 69% in 2014
89%
• The probability of non-SOE going into repeated
suspension is higher 63%
69%
52%
48% 49%
42%
40%
37%
35%
22%
12%
2012 2013 2014 2015 2016 2017
22
Data include all companies suspended at any point in time but exclude 1 day suspensions 22TRADING SUSPENSIONS BY VARIOUS DURATION HORIZONS HAVE ALL
COME DOWN
Suspensions exceeding 3
months were removed from
the MSCI Investable
Universe since the new index rules were
implemented
Data include all companies suspended at any point in time but exclude 1 day suspensions 23SUSPENSION BY SIZE-SEGMENT
Data include all companies suspended at any point in time but exclude 1 day suspension 24SUSPENSION BY SECTOR
Industrials, Materials and
Consumer Discretionary are the
three largest sectors with most
number of index constituents
Data include all companies suspended at any point in time but exclude 1 day suspension 25SUSPENSION BY STOCK EXCHANGE
Data include all companies suspended at any point in time but exclude 1 day suspension 26SUSPENSION BY OWNERSHIP TYPE
Data include all companies suspended at any point in time but exclude 1 day suspension 27SUSPENSION BY INSTANCES
Instances of Suspension beyond a day by Ownership Type (2012-2018) Instances of Suspension beyond a day by Exchange (2012-2018)
200
182 200
180 175 173 179
180
160 156
146 144 160 150
140 140 128
123 SH
120 120
SOE SZ
96 99
100 Non SOE100
78
80 80
57 60
60 60
37 38
40 40 28
23
20 15
20 12 10
6 2 2 3 1
0 0
1x 2x 3x 4x 5x 6x 7x 8x 9x 10x 11x 12x 13x 14x 1x 2x 3x 4x 5x 6x 7x 8x 9x 10x 11x 12x 13x 14x
Instances of Suspension beyond a day by Exchange (2012-2018)
Instances of Suspension beyond a day by Size-Segment (2012-2018)
300
247 254
250 233
195
200 Large
Mid
145
150 Small
99
100
64
50 36
25
16
6 4 1 1
0
1x 2x 3x 4x 5x 6x 7x 8x 9x 10x 11x 12x 13x 14x
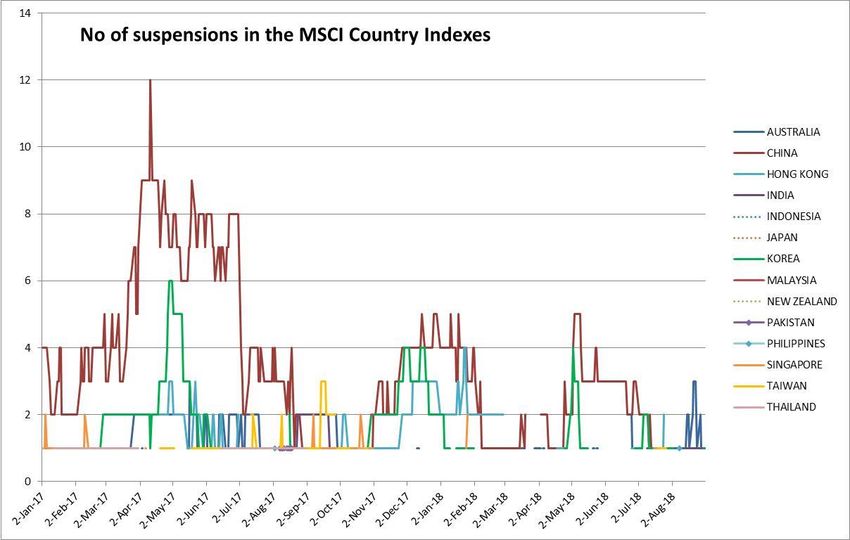
28REGIONAL COMPARISON – STANDARD INDEX
June 1 2018:
First phase of Large
Cap China A shares
inclusion
29
Data shows the number of suspended securities in the respective MSCI Country Index as of each day from January 2017 to August 2018REGIONAL COMPARISON – SMALL CAP INDEX
Data shows the number of suspended securities in the respective MSCI Country Index as of each day from January 2017 to August 2018
30ABOUT MSCI For more than 40 years, MSCI’s research‐based indexes and analytics have helped the world’s leading investors build and manage better portfolios. Clients rely on our offerings for deeper insights into the drivers of performance and risk in their portfolios, broad asset class coverage and innovative research. Our line of products and services includes indexes, analytical models, data, real estate benchmarks and ESG research. MSCI serves 99 of the top 100 largest money managers, according to the most recent P&I ranking. For more information, visit us at www.msci.com.
NOTICE AND DISCLAIMER
 This document and all of the information contained in it, including without limitation all text, data, graphs, charts (collectively, the “Information”) is the property of MSCI Inc. or its subsidiaries (collectively, “MSCI”), or MSCI’s licensors, direct or indirect suppliers or any third
 party involved in making or compiling any Information (collectively, with MSCI, the “Information Providers”) and is provided for informational purposes only. The Information may not be modified, reverse-engineered, reproduced or redisseminated in whole or in part
 without prior written permission from MSCI.

 The Information may not be used to create derivative works or to verify or correct other data or information. For example (but without limitation), the Information may not be used to create indexes, databases, risk models, analytics, software, or in connection with the
 issuing, offering, sponsoring, managing or marketing of any securities, portfolios, financial products or other investment vehicles utilizing or based on, linked to, tracking or otherwise derived from the Information or any other MSCI data, information, products or services.

 The user of the Information assumes the entire risk of any use it may make or permit to be made of the Information. NONE OF THE INFORMATION PROVIDERS MAKES ANY EXPRESS OR IMPLIED WARRANTIES OR REPRESENTATIONS WITH RESPECT TO THE INFORMATION (OR
 THE RESULTS TO BE OBTAINED BY THE USE THEREOF), AND TO THE MAXIMUM EXTENT PERMITTED BY APPLICABLE LAW, EACH INFORMATION PROVIDER EXPRESSLY DISCLAIMS ALL IMPLIED WARRANTIES (INCLUDING, WITHOUT LIMITATION, ANY IMPLIED WARRANTIES OF
 ORIGINALITY, ACCURACY, TIMELINESS, NON-INFRINGEMENT, COMPLETENESS, MERCHANTABILITY AND FITNESS FOR A PARTICULAR PURPOSE) WITH RESPECT TO ANY OF THE INFORMATION.

 Without limiting any of the foregoing and to the maximum extent permitted by applicable law, in no event shall any Information Provider have any liability regarding any of the Information for any direct, indirect, special, punitive, consequential (including lost profits) or any
 other damages even if notified of the possibility of such damages. The foregoing shall not exclude or limit any liability that may not by applicable law be excluded or limited, including without limitation (as applicable), any liability for death or personal injury to the extent
 that such injury results from the negligence or willful default of itself, its servants, agents or sub-contractors.

 Information containing any historical information, data or analysis should not be taken as an indication or guarantee of any future performance, analysis, forecast or prediction. Past performance does not guarantee future results.

 The Information should not be relied on and is not a substitute for the skill, judgment and experience of the user, its management, employees, advisors and/or clients when making investment and other business decisions. All Information is impersonal and not tailored to
 the needs of any person, entity or group of persons.

 None of the Information constitutes an offer to sell (or a solicitation of an offer to buy), any security, financial product or other investment vehicle or any trading strategy.

 It is not possible to invest directly in an index. Exposure to an asset class or trading strategy or other category represented by an index is only available through third party investable instruments (if any) based on that index. MSCI does not issue, sponsor, endorse, market,
 offer, review or otherwise express any opinion regarding any fund, ETF, derivative or other security, investment, financial product or trading strategy that is based on, linked to or seeks to provide an investment return related to the performance of any MSCI index
 (collectively, “Index Linked Investments”). MSCI makes no assurance that any Index Linked Investments will accurately track index performance or provide positive investment returns. MSCI Inc. is not an investment adviser or fiduciary and MSCI makes no representation
 regarding the advisability of investing in any Index Linked Investments.

 Index returns do not represent the results of actual trading of investible assets/securities. MSCI maintains and calculates indexes, but does not manage actual assets. Index returns do not reflect payment of any sales charges or fees an investor may pay to purchase the
 securities underlying the index or Index Linked Investments. The imposition of these fees and charges would cause the performance of an Index Linked Investment to be different than the MSCI index performance.

 The Information may contain back tested data. Back-tested performance is not actual performance, but is hypothetical. There are frequently material differences between back tested performance results and actual results subsequently achieved by any investment
 strategy.

 Constituents of MSCI equity indexes are listed companies, which are included in or excluded from the indexes according to the application of the relevant index methodologies. Accordingly, constituents in MSCI equity indexes may include MSCI Inc., clients of MSCI or
 suppliers to MSCI. Inclusion of a security within an MSCI index is not a recommendation by MSCI to buy, sell, or hold such security, nor is it considered to be investment advice.

 Data and information produced by various affiliates of MSCI Inc., including MSCI ESG Research LLC and Barra LLC, may be used in calculating certain MSCI indexes. More information can be found in the relevant index methodologies on www.msci.com.

 MSCI receives compensation in connection with licensing its indexes to third parties. MSCI Inc.’s revenue includes fees based on assets in Index Linked Investments. Information can be found in MSCI Inc.’s company filings on the Investor Relations section of www.msci.com.

 MSCI ESG Research LLC is a Registered Investment Adviser under the Investment Advisers Act of 1940 and a subsidiary of MSCI Inc. Except with respect to any applicable products or services from MSCI ESG Research, neither MSCI nor any of its products or services
 recommends, endorses, approves or otherwise expresses any opinion regarding any issuer, securities, financial products or instruments or trading strategies and MSCI’s products or services are not intended to constitute investment advice or a recommendation to make (or
 refrain from making) any kind of investment decision and may not be relied on as such. Issuers mentioned or included in any MSCI ESG Research materials may include MSCI Inc., clients of MSCI or suppliers to MSCI, and may also purchase research or other products or
 services from MSCI ESG Research. MSCI ESG Research materials, including materials utilized in any MSCI ESG Indexes or other products, have not been submitted to, nor received approval from, the United States Securities and Exchange Commission or any other regulatory
 body.

 Any use of or access to products, services or information of MSCI requires a license from MSCI. MSCI, Barra, RiskMetrics, IPD, InvestorForce, and other MSCI brands and product names are the trademarks, service marks, or registered trademarks of MSCI or its subsidiaries in
 the United States and other jurisdictions. The Global Industry Classification Standard (GICS) was developed by and is the exclusive property of MSCI and Standard & Poor’s. “Global Industry Classification Standard (GICS)” is a service mark of MSCI and Standard & Poor’s.

                                                                                                                                                                                                                                                                                                   32
You can also read