Consumer complaints throughout the credit life cycle, by demographic characteristics - Consumer Complaint Research Brief
←
→
Page content transcription
If your browser does not render page correctly, please read the page content below
CONSUMER FINANCIAL PROTECTION BUREAU | SEPTEMBER 2021

Consumer complaints
throughout the credit life
cycle, by demographic
characteristics
Consumer Complaint Research Brief
Table of Contents
Table of Contents .............................................................................................................1

1. Introduction ................................................................................................................2

2. Consumer complaints and demographic information .........................................5

 2.1 External work............................................................................................. 6

 2.1.1 Discussion............................................................................................... 7
 2.2 The credit life cycle .................................................................................. 10
 2.3 Demographics ........................................................................................... 11

3. Data overview ...........................................................................................................13

4. Analysis.....................................................................................................................18

 4.1 Income...................................................................................................... 18
 4.2 Race and ethnicity ................................................................................... 22

 4.2.1 Discussion............................................................................................. 32

5. Area case studies ....................................................................................................35

 5.1 New York City: Income............................................................................ 35
 5.2 St. Louis, Missouri: Share of Black or African American residents.......40

6. Conclusion................................................................................................................45

7. Appendix ...................................................................................................................46

 7.1 Detailed table ...........................................................................................46
 7.2 Regression analysis.................................................................................. 47

 7.3 Product and issue lifecycle mapping ....................................................... 52

1 CONSUMER FINANCIAL PROTECTION BUREAU
1. Introduction
This Consumer Complaint Research Brief 1 analyzes consumers who submit complaints to the
Consumer Financial Protection Bureau (CFPB). 2 It is the first in-depth analysis published by the
CFPB that seeks to understand which communities are submitting complaints and whether
differences exist across various demographic and socio-economic groups. 3 Understanding such
differences is important as consumer complaints are one of the primary ways the CFPB hears
from consumers. Their complaints—and how companies respond—inform the CFPB’s efforts in
supervising companies, enforcing federal consumer financial laws, writing rules and regulations,
and educating consumers.

To better understand which communities are submitting complaints and whether differences
exist across several demographic and socio-economic groups, we match census tract-level
consumer complaint data to data from the U.S. Census 2019 American Community Survey
(ACS).4 Using ACS tract-level data as a proxy is necessary because the CFPB only collects limited
demographic information via the complaint process. Given this approach, our analysis is best
thought of as comparing different American communities. Additionally, our ability to link
consumers across complaints using a consumer’s identifying information, which is not available
to the public, allows us to better account for consumers with issues that span multiple products
or companies, as well as consumers that submit multiple complaints about a single issue. The
data set includes three years of data—from 2018 to 2020. In total, more than 63,000 tracts, out
of more than 74,000 total tracts, had at least one complaint in the data.

We map complaints to a credit life cycle consisting of loan origination; servicing of performing
loans (“performing servicing”); delinquent and distressed servicing and collections (“delinquent
servicing”); and credit reporting (Figure 1). This approach allows us to examine consumers’

1 This research brief was prepared by Lewis Kirvan and Robert Ha.
2 The Dodd-Frank Wall Street Reform and Consumer Protection Act directed the CFPB to facilitate the centralized
 collection of, monitoring of, and response to consumer complaints regarding consumer financial products or
 services. See Dodd-Frank Wall Street Reform and Consumer Protection Act of 2010, Pub. L. No. 111-203 (Dodd-
 Frank Act), Section 1013(b)(3); see also § 1002(4) (“The term ‘consumer’ means an individual or an agent, trustee,
 or representative acting on behalf of an individual.”).
3 The CFPB published a complaint bulletin that summarized complaints at the county-level. See Consumer Fin. Prot.
 Bureau, Complaint Bulletin: County-level demographic overview of consumer complaints (Apr. 2021),
 https://files.consumerfinance.gov/f/documents/cfpb_complaint-bulletin_county-level-demographic-overview-
 consumer-complaints_2021-04.pdf.
4 U.S. Census 2019 American Community Survey (“2019 American Community Survey” or “ACS Survey”),
 https://www.census.gov/programs-surveys/acs (The American Community Survey provides a wide range of
 important statistics—e.g., race, ethnicity, education, language, employment, etc.—for every community in the
 nation).

2 CONSUMER FINANCIAL PROTECTION BUREAU
financial experiences more broadly, rather than attempting to address all 13 products, and more
than 40 sub-products about which consumers can submit complaints. Credit reporting, unlike
other products and services, occurs throughout the credit lifecycle (e.g., creditors rely on credit
reports at origination; servicers furnish payment activity; debt collectors may furnish
delinquencies; etc.). Figure 1 reflects this unique feature.

FIGURE 1: THE CREDIT LIFE CYCLE

This research brief analyzes the relationship between census characteristics of a community and
the share of consumers complaining about each stage of the credit life cycle in that community.
In doing so it extends and qualifies prior research on complaints by using the CFPB’s non-public
data and matching to census information at a more precise level, by using consumers as our
main unit of analysis instead of complaints, and by utilizing domain expertise to classify
consumers’ complaints into an overarching credit life cycle. We believe that these differences
allow us to paint a more accurate picture of how complaints vary with the demographic
characteristics considered. Our approach is explained in the next section.

Throughout the report, we analyze complaint submission rates (i.e., the number of consumers
who complain per resident in a census tract). Some key findings from this report include:

 ▪ Lower income census tracts, and census tracts with a greater concentration of minority
 populations are associated with greater rates of submitting credit reporting complaints
 and delinquent servicing complaints.

3 CONSUMER FINANCIAL PROTECTION BUREAU
▪ Higher income census tracts tend to submit a greater share of complaints about loan
 origination and performing servicing than lower income census tracts.

 ▪ A large increase in complaints about loan originations in 2020 (driven by mortgage
 complaints) was centered in higher income census tracts and census tracts with fewer
 minorities.

 ▪ Census tracts with the highest share of white, non-Hispanic consumers submit
 complaints about loan originations at more than twice the rate as the census tracts with
 the highest share of Black or African American consumers.

 ▪ Census tracts with the highest share of Black or African American consumers submit the
 most complaints per resident.

 ▪ Census tracts with a median income between 80% and 120% of their metropolitan
 statistical area (MSA) or county median tend to submit fewer complaints than census
 tracts with median incomes less than 80% of their MSA or county median and fewer
 complaints than census tracts with median incomes greater than 120% of their MSA or
 county median.5

This research brief is organized as follows. Section 2 of this report discusses the use of
complaints and demographic information. We describe our approach and contrast it with recent
work that other researchers have done combining complaints with demographic information.
Section 3 provides a high-level overview of the dataset. Section 4 develops our analysis further
and looks at how the differences in the use of products by demographic groups has changed
from 2018 to 2020. Section 5 provides two case studies on specific geographic areas to show
some trends and issues we identify in prior sections. Finally, Section 6 offers concluding
remarks and contemplates future engagements about this research.

5 We compared tract-level income to an enclosing area’s median income. For example, we compare tracts within a
 metropolitan area to the metropolitan median income. For rural areas we compare tracts to their counties. Section
 2.3 describes this calculation.

4 CONSUMER FINANCIAL PROTECTION BUREAU
2. Consumer complaints and
 demographic information
On July 21, 2011, the CFPB began accepting consumer complaints. Since then, consumers have
submitted more than three million complaints to the CFPB about a variety of consumer financial
products and services. 6 About a quarter of these—more than 700,000 complaints—have been
submitted since the declaration of the coronavirus (COVID-19) national emergency on March
13, 2020. The CFPB has published several Complaint Bulletins analyzing these complaints. 7

Consumer complaints are integral to the CFPB’s work. By collecting, investigating, and
responding to consumer complaints, the CFPB hears directly from consumers and can better
understand the types of challenges they are experiencing in the marketplace. The CFPB also has
insight into how companies are responding to their customers’ concerns. Our public release of
consumer complaint data, including complaint narratives, through the public Consumer
Complaint Database (Database)8 is, increasingly, being used in a variety of research contexts.
Complaint data have been used to understand consumers’ experiences in the mortgage
marketplace,9 firms’ responses to changing administrations, 10 the relationship between a
consumer’s affect and their understanding of the complaints process, and even as a source for
educational resources on developing supervised machine learning models using text data. 11

6 When consumers submit complaints to the CFPB, the CFPB routes their complaints —and any documents they
 provide—directly to financial companies, and works to get consumers a timely response, generally within 15 days.
 See Consumer Fin. Prot. Bureau, Learn how the complaint process works,
 www.consumerfinance.gov/complaint/process/.
7 See e.g., Consumer Fin. Prot. Bureau, Complaint Bulletin: COVID-19 issues described in consumer complaints
 (Jul. 2021), https://files.consumerfinance.gov/f/documents/cfpb_covid-19-issues-described-consumer-
 complaints_complaint-bulletin_2021-06.pdf; Consumer Fin. Prot. Bureau, Complaint Bulletin: Mortgage
 forbearance issues described in consumer complaints (May 2021),
 https://files.consumerfinance.gov/f/documents/cfpb_mortgage-forbearance-issues_complaint-bulletin_2021-
 05.pdf.
8 See Consumer Fin. Prot. Bureau, Consumer Complaint Database, https://www.consumerfinance.gov/data-
 research/consumer-complaints/.
9 See Taylor A. Begley & Amiyatosh Purnanandam, Color and Credit: Race, Regulation, and the Quality of Financial
 Services, 141 Journal of Financial Economics, 48-65 (2021), https://doi.org/10.1016/j.jfineco.2021.03.001.
10 See Charlotte Haendler & Rawley Heimer, The Financial Restitution Gap in Consumer Finance: Insights from
 Complaints Filed with the CFPB (Jan. 2021), http://dx.doi.org/10.2139/ssrn.3766485.
11 See Pamela Foohey, Calling on the CFPB for Help: Telling Stories and Consumer Protection, 80 Law and
 Contemporary Problems 177-209 (Jun. 2017), https://scholarship.law.duke.edu/lcp/vol80/iss3/8/.

5 CONSUMER FINANCIAL PROTECTION BUREAU

2.1 External work
Several recent studies conducted by external and other government researchers have connected
consumer complaints from the CFPB’s Database with proxy demographic data to estimate the
race, ethnicity and economic circumstances of consumers who have submitted complaints to the
CFPB.

A working paper by Davesh Raval of the Federal Trade Commission’s (FTC) Bureau of
Economics examined consumer complaints submitted from 2014 to 2018 using data from
Consumer Sentinel, 12 a database that aggregates complaints submitted to federal and state
government agencies, such as the CFPB and the FTC, and to private entities like the Better
Business Bureaus (BBBs). 13 Using the addresses linked to the consumer complaints, Raval
connected the complaints with ZIP code-level U.S. Census demographic data from the 2008-
2012 ACS.14

Using these proxy demographic data, Raval found that greater complaint rates were associated
with communities that were more heavily Black or African American, more educated, higher
income, older and more urban. Lower complaint rates, on the other hand, were associated with
communities that were predominantly Hispanic or Latino and had larger household sizes. In
reaching these conclusions, Raval warns that “because the demographic information is at the
ZIP code-level, any inferences on demographics are best thought of as reflecting differences
between different types of American communities.” 15

Another working paper, conducted by researchers Taylor Begeley from the Washington
University in St. Louis and Amiyatosh Purnanandam from the University of Michigan, examined
consumer complaints submitted from 2012 to 2016 to analyze indications of mortgage product
quality as determined by complaints citing fraud, mis-selling, and poor customer service. Like
Raval, these researchers linked the consumer complaints to U.S. Census Data (i.e., 2010 Census
and the 2012 ACS) at the ZIP code-level.16

12 See Devesh Raval, Which Communities Complain to Policymakers? Evidence from Consumer Sentinel, Economic
 Inquiry, Vol. 58, Issue 4, pp. 1628-1642 (Oct. 2020), http://dx.doi.org/10.1111/ecin.12838.
13 Dodd-Frank Act, supra note 2, at Section 1013(b)(3)(D) (“the Bureau shall share consumer complaint information
 with…the Federal Trade Commission”). See also Federal Trade Comm., Consumer Sentinel Network,
 https://www.ftc.gov/enforcement/consumer-sentinel-network (last visited Sep. 7, 2021).
14 More granular data, such as ZIP code information, is available to CFPB analysts and researchers, as well other users
 of complaint data, such as the researchers at the FTC.
15 See Raval, supra note 12.
16 See Begley & Purnanandam, supra note 9.

6 CONSUMER FINANCIAL PROTECTION BUREAU
Looking exclusively at mortgage complaints, Begeley and Purnanandam found that there were
more complaints in ZIP codes with lower incomes and educational attainment and larger
minority populations, after controlling for mortgage lending rates.

Another recent study, a working paper by Charlotte Haendler and Rawley Heimer of Boston
College, looks at differences in company responses to complaints across different communities
and under different political administrations. The researchers examined consumer complaints
submitted from January 2014 through March 2020, and the rates at which firms provided relief
over this period. This paper also relied on ZIP code matching to census data to approximate
socioeconomic demographics of the consumers who submitted these complaints.17

Haendler and Heimer found that consumer complaints submitted to the CFPB from zip codes
associated with low socioeconomic status (i.e., low median household incomes and high shares
of residents who are African American) were less likely to be closed with financial restitution
than those from zip codes associated with high socioeconomic status. For reference, the
researchers defined complaints closed with financial restitution as those labeled “closed with
monetary relief” in the Database.

The researchers also found that their observed disparity in complaint outcomes existed despite
no major socioeconomic differences in submission rates. They observed that this socioeconomic
gap in financial restitution increased significantly under the Trump administration.

2.1.1 Discussion
The CFPB welcomes scholarship using consumer complaint data. 18 All three papers extend our
collective knowledge of the financial marketplace, consumers’ use of the complaint process, and
financial firms’ behavior, as revealed by complaints.

This research brief uses our access to non-public identifying and address information. Our
internal complaint database includes personal information and unique identifiers that enable
improvements upon what can be accomplished with our public release of data. For example, all
complaints are routinely geocoded and matched to corresponding census geographies. This
additional information allows us to extend and qualify this prior external research in several
ways. We can perform more precise census area matching. We can track consumers across
multiple complaints, enabling us to focus our analysis on consumers. And because of significant
domain knowledge and experience reading and reviewing complaints, we can use a novel

17 See Haendler & Heimer, supra note 10.
18 Indeed, it was one of several rationales for making complaint data available to the public. See e.g., Disclosure of
 Certain Credit Card Complaint Data, 76 FR 76628 (Dec. 8, 2011).

7 CONSUMER FINANCIAL PROTECTION BUREAU
approach to classifying complaints. We believe that these differences allow us to paint an
accurate picture of how community level complaint submission varies with the demographic
characteristics considered. While we do offer some limited discussion of possible interpretations
of this data, this report does not seek to test any of the possible causal explanations for the
differences we identify.

CE NS US AREA MATCHING
All three studies make analytical assumptions in linking the location data available on the
Database to U.S. Census demographic data. But this might be problematic for several reasons.
To begin, there is a lack of standard correspondence between the U.S. Census’ ZIP code
tabulation areas (ZCTA) and the U.S. Postal Service’s ZIP code recorded on the Database. To
reduce reidentification risk, some of the U.S. Postal ZIP codes available on the Database are
truncated to the first three digits.

The researchers varied in their approaches to this issue. Raval linked the complaints’ ZIP codes
with the U.S. Census ZCTA data and conceded that not all complaints lined up perfectly. Begeley
and Purnanandam instead aggregated census tract-level population data to the ZIP code-level by
calculating the proportion of the population that resided within the tracts in the given ZIP code.
They filtered out complaints mapped to a three-digit ZIP code. Lastly, Haendler and Hiemer
mapped the ZIP codes of complaints to county-level U.S. Census data. When a complaint on the
Database is mapped to a three-digit ZIP code, Haendler and Hiemer averaged the demographics
of the potentially corresponding counties by population.

This research brief uses data from the CFPB’s internal complaint database, matching complaints
with a valid address (nearly all complaints) to U.S. Census tracts. Thus, we bypass any
difficulties in reconciling complaints to census geography. Moreover, by using demographic data
at the census tract-level, our demographic approximations should be more precise than those at
the ZIP code- or county-level.19

ANALY ZI NG COMPLAINTS V S ANALYZING CONSUMERS
All three of these studies use consumer complaints as the base measure to reference with
demographic data. This measure poses limitations, as some problems may prompt consumers to
submit complaints about multiple companies related to a single issue or problem. For example,
a consumer’s problem with a credit or consumer report may prompt them to submit complaints
about a data furnisher and one or more consumer reporting agencies. Access to non-public
identifying information allows us to avoid double counting when the consumer submits multiple
complaints about the same product life cycle. As shown in Figure 3 below in section 3, the

19 See U.S. Census Bureau, Standard Hierarchy of Census Geographic Entities (Nov. 2020),
 https://www.census.gov/housing/hvs/files/currenthvspress.pdf (last accessed Sep. 7, 2021).

8 CONSUMER FINANCIAL PROTECTION BUREAU
number of consumer complaints and unique consumers has diverged over time, especially for
credit reporting complaints. As explained more fully in the next section, this research brief
measures the complaint-submitting behavior of individual consumers.

CFP B I NTAKE OF COMPLAINTS
Lastly, the process for consumers to submit complaints has evolved since the CFPB first opened
and started collecting complaints in 2011. The types of products and sub-products available on
the CFPB complaint form expanded through 2016 as new products were introduced (Figure 2).
For instance, the CFPB began accepting complaints for prepaid cards, credit repair, debt
settlement, and pawn and title loans in July 2014, virtual currency in August 2014, and federal
student loan servicing in February 2016.

FIGURE 2: TYPES OF COMPLAINTS OVER TIME

The consumer complaint form, used by most consumers who submit complaints, was revised in
April 2017 to streamline and reorganize some product and issue options, as well as to make
some plain language improvements. 20 In addition, changes to the form gave consumers with
credit reporting complaints the option to identify each company involved in the problem and
have the complaint sent to each company simultaneously. As a result of this 2017 revision, some
products and issues experienced notable changes in complaint volume. Because companies may
triage complaints based on the products and issues that are cited in them, changes in complaint
intake could have produced downstream effects on consumer outcomes.

As the intake of complaints has not been constant, it is difficult to exclude the possibility that
form revision played a role in any differences observed between the periods before and after the
revision. For research projects that span this period, special care should be taken to account for
changes to these products and issues. To mitigate these potential issues, our analysis relies only

20 See Consumer Fin. Prot. Bureau, CFPB Summary of product and sub -product changes (Apr. 24, 2017),
 https://files.consumerfinance.gov/f/d ocuments/201704_cfpb_Summary_of_Product_and_Sub -
 product_Changes.pdf.

9 CONSUMER FINANCIAL PROTECTION BUREAU
on complaints submitted through the online form or over the phone during the 2018-2021
period.

2.2 The credit life cycle
This report takes a novel approach to classifying and analyzing complaints. The CFPB accepts
complaints in 13 major product areas, many sub-products, and many issues and sub-issues. This
level of granularity provides rich and specific information across the spectrum of products that
consumers use and about the issues they have with those products. This brief is intended to
provide a broader view of consumers’ experiences—it is about the forest of peoples’ experiences
with borrowing, not the trees.

Accordingly, based on the consumer’s choice of products and issues, we map complaints onto
one of four broader problem areas that correspond to the potential life cycle of a range of credit
products. These areas are loan origination, performing servicing loans, delinquent servicing, and
credit reporting. This mapping is available in the Appendix. Complaints about bank accounts,
money transfer services, and other financial products that do not primarily involve the extension
of credit are excluded from this mapping. Because short-term lending products have a life cycle
that differs from other types of credit in substantial ways, they were also excluded.

Additionally, to account for the differing behavior of complaint submitters across products, this
analysis does not focus on total complaints. Rather, within each census tract, we count each
unique consumer once per year for each credit life cycle category about which they submitted a
complaint. This method accounts for the complexity of some complaints that touch on multiple
aspects of the credit life cycle as well as the tendency of consumers to submit multiple
complaints in some product areas. For example, if a single consumer had a mortgage servicing
issue that led to negative credit reporting, and the consumer submitted a mortgage servicing
complaint against their mortgage servicer and a credit reporting complaint against each of the
nationwide credit reporting agencies, they would be counted for two stages of the credit life
cycle—once for performing servicing and once for credit reporting. This method allows us to
make statements about the shares of consumers in a given census tract who complained about
each life cycle category.

Table 1 below shows total complaints and the total unique consumers for each of these life cycle
categories. We use a combination of full name and email to identify unique consumers in the
dataset. Because we rely on product and issue selection our sample is also limited to complaints

10 CONSUMER FINANCIAL PROTECTION BUREAU
submitted through the online form or over the phone (i.e., those complaints whe re consumers
affirmatively made a product and issue selection).21

TABLE 1: COMPLAINTS AND CONSUMERS ACROSS THE CREDIT LIFE CYCLE. ALL VALUES ARE IN
 THOUSANDS.

Life cycle 2018 2018 2019 2019 2020 2020
category Complaints Consumers Complaints Consumers Complaints Consumers

Loan origination 6,763 6,162 7,482 6,711 9,651 8,825
Performing
 29,117 25,866 30,164 26,851 33,548 29,494
servicing

Delinquent
 53,194 38,025 49,652 35,306 54,554 36,643
servicing

Credit reporting 99,505 38,587 131,032 49,098 271,134 86,171

2.3 Demographics
This report relies on matching consumer address information to census tracts. We consider four
tract-level demographic measures: percentage of area median income (AMI), share of Black or
African American residents, share of Hispanic or Latino residents, and share of Asian American
or Pacific Islander residents. 22 We treat the community-level differences described in this report
as reflective of differences in communities’ use of the complaint process. We believe these
differences do reflect some aspects of consumers’ experiences of the credit marketplace but
should be interpreted with care as they may reflect several other factors, including the
availability of products and services, different patterns of use by different groups, and different
communities’ propensity for, or ability, to complain.

To calculate the percentage of AMI, we compare census tract median income to a larger
enclosing area’s median income. Core-Based Statistical Areas (CBSAs) are used to identify
relevant medians for this comparison; where census tracts do not fall within CBSAs, county-
level medians are used. For example, a tract with a median income of $74,000 in a CBSA with a
median income of $100,000 is at 74% of the area’s median income. Bins for this measure are
less than 80%, between 80 and 120%, and greater than 120% of area medians.

To understand how communities with different racial or ethnic characteristics experience the
credit marketplace differently, we group the census tract level share of residents for a particular

21 We exclude a small number of complaints that are received via direct mail.
22 Asian American or Pacific Islander includes two census categories: Asian and Pacific Islander. We also some times
 provide information about white, non-Hispanic share for comparison or baseline.

11 CONSUMER FINANCIAL PROTECTION BUREAU
race or ethnicity, and comparisons are made between census tracts with the highest share of a
race or ethnicity and census tracts with the lowest share of a race or ethnicity. 23 This table
shows the raw population totals, number of census tracts, and share of minority populations for
the groups.24 Throughout the rest of this report, we will refer to these groups as “high,”
“medium,” and “low.” The highest group is the group with the greatest share of a minority
population or the highest area median income.

A detailed table, providing complaint and population information for these bins across the
credit life cycle, is included in the Appendix.

TABLE 2: MINORITY POPULATION AND TOTAL NUMBER OF TRACTS FOR UNIVARIATE CLUSTERING
 BINS FOR DEMOGRAPHIC GROUPS. ALL VALUES ARE IN THOUSANDS.

 Minority population
Group Bin Number of tracts Share minority total
 total

Black or African American
 High (> 54%) 14,961,255 5,646 35.95%

 Mid (between 17% and
 15,522,547 11,388 37.29%
 54%)

 Low (< 17%) 11,137,516 56,264 26.76%

Hispanic or Latino
 High (> 56%) 25,121,229 6,694 40.68%

 Mid (between 20% and
 21,414,846 12,970 34.68%
 56%)

 Low (< 20%) 15,219,214 53,634 24.64%

Asian American or Pacific Islander
 High (> 33%) 4,796,927 1,956 25.89%

 Mid (between 9% and
 7,668,970 9,268 41.39%
 33%)

 Low (< 9%) 6,064,686 62,074 32.73%

23We use univariate clustering to identify appropriate cut points for our bins. This method of binning is designed to
 identify groups of tracts that have a more concentra ted minority population, compared with simple quantiles. The
 breaks for the groups are identified in Table 2. With this method the cutoffs are determined by clustering the census
 tract level shares using the k -means algorithm with three clusters. This method of clustering univariate data is often
 used in mapping contexts because it identifies natural breaks that can make choropleth maps more readable and
 accurate. Compared with bins that cut tracts based on a fixed share (i.e., thirds), this method increases the
 difference in percentage share between the high and low bins, while also increasing the number of tracts and total
 population in the highest concentration bin.
24As mentioned above, for the three years of complaint data included in this report, appro ximately 10,000 census
 tracts (out of more than 74,000) were not observed. These tracts were coded as having zero complaints and zero
 complaining consumers but were included in the binning process for income and race or ethnicity.

12 CONSUMER FINANCIAL PROTECTION BUREAU
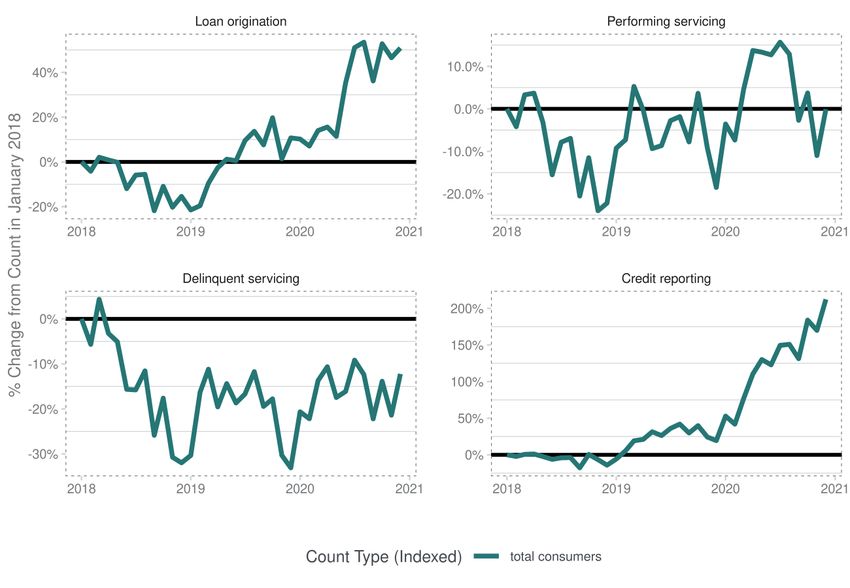
3. Data overview
The volume of consumers submitting complaints to the CFPB has increased significantly over
the last 18 months, from February 2020 to July 2021. In particular, we saw large increases in the
volume of consumers with credit reporting and loan origination complaints that roughly
coincided with the declaration of COVID-19 national emergency in March 2020.

Figure 3 is indexed to January 2018 and includes monthly time series of total consumers
submitting complaints to the CFPB for each of the credit life cycle categories. The top left plot,
which contains information for loan origination, shows large increases in monthly complainant
volume, with steep upticks starting in the summer of 2020. The volume of consumers with loan
origination complaints, driven mainly by mortgage complaints, is now around 50% higher than
it was at the beginning of 2018. Much of this volume appears to be related to refinancing of
existing mortgages as consumers try to take advantage of historically low interest rates.

FIGURE 3: INDEXED MONTHLY TIME SERIES OF CREDIT LIFE CYCLE STAGES FOR NUMBER OF
 CONSUMERS. SERIES ARE INDEXED TO JANUARY 2018 VALUES.

13 CONSUMER FINANCIAL PROTECTION BUREAU
The number of consumers with credit reporting complaints increased even more. Beginning in
March 2020, the number of consumers with credit reporting complaints increased rapidly from
levels that were already elevated in 2019. 25 Because of its unique role in the credit life cycle,
downstream from past credit and upstream from new credit, the increase in the number of
consumers with credit reporting complaints may also bear some relationship to consumers’
attempts to improve credit scores as they seek new credit, especially given current mortgage
interest rates.

The number of consumers with servicing complaints temporarily increased following the onset
of the pandemic. Many of these complaints involved consumers attempting to resolve credit
card disputes for transactions, such as travel plans that were cancelled because of the
pandemic.26 The number of consumers with delinquent servicing complaints have declined
slightly from their 2018 levels and remained low throughout 2020. This decline suggests that
the Coronavirus Aid, Relief, and Economic Security (CARES) Act, which became effective in
March 2020 and provided relief for struggling homeowners with federally backed mortgages
have been effective.27

Student loan servicing complaints in particular saw large declines in volume. Beginning in
March 2020, the U.S. Department of Education’s Office of Federal Student Aid and the CARES
Act provided relief to borrowers with government-owned federal student loans.28 Relief included
suspension of loan payments, a 0% interest rate, and stopped collections on defaulted loans.

We also look at how complaint submission rates vary with the demographic characteristics we
are considering. But, before we do, a word of caution on interpretation of these results.
Differences in the complaint submission rates of communities with differing demographic
characteristics do not necessarily reflect only differences in the incidence of issues consumers

25See Consumer Fin. Prot. Bureau, Consumer Response Annual Report (Mar. 2021) at Section 4.1,
 https://files.consumerfinance.gov/f/documents/cfpb_2020-consumer-response-annual-report_03-2021.pdf.
26 Id. at Section 4.3.
27In March 2020, Congress passed the Coronavirus Aid, Relief, and Economic Security (CARES) Act that, among
 other things, provided relief to homeowners. Under the CARES Act, homeowners with an eligible mortgage who had
 experienced financial hardship due to the pandemic had the right to request and obtain a forbearance on their
 mortgage for up to 180 days. Homeowners additionally had the right to request and obtain an extension for up to
 another 180 days (for a total of up to 360 days). The CARES Act also esta blished a moratorium on mortgage
 foreclosures. See 15 U.S.C. § 9056(c). Borrowers with certain types of mortgages who requested additional
 forbearance were able to extend their forbearance for up to 18 months. See Consumer Fin. Prot. Bureau, Learn
 about mortgage relief options and protections, https://www.consumerfinance.gov/coronavirus/mortgage -and-
 housing-assistance/mortgage-relief/ (last accessed Sep. 7, 2021). See also Consumer Fin. Prot. Bureau, Complaint
 Bulletin: Mortgage forbearance issues described in consumer complaints , supra note 7.
28 SeeU.S. Department of Education, Coronavirus and Forbearance Info for Students, Borrowers, and Parents:
 History of the COVID-19 Emergency Relief Flexibilities, https://studentaid.gov/announcementsevents/coronavirus
 (last accessed Sep. 7, 2021). See also Consumer Fin. Prot. Bureau, Complaint Bulletin: COVID-19 issues described in
 consumer complaints, supra note 7, at Section 2.

14 CONSUMER FINANCIAL PROTECTION BUREAU
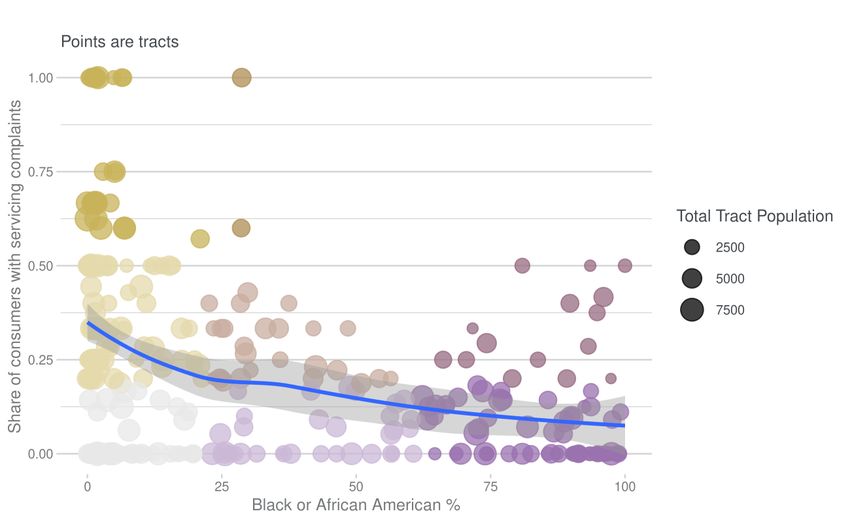
are having. These differences almost certainly reflect several distinct factors: credit products’
availability in a particular community and the terms on which it is offered, the patterns of use of
those products by different groups of consumers, the incidence of different problems in those
communities, and the rate at which different consumers come to the CFPB with the problems
that do occur. More fully addressing the range of causal factors that give rise to the differences
we observe in different community’s tendency to submit complaints is beyond the scope of this
report, which is focused primarily on providing a thorough description of these differences.
Given these unknowns, we treat the community-level differences described in this report as
reflective of differences in communities’ tendency to use the complaint process for a particular
issue or product. These differences do reflect aspects of consumers’ differing experiences of the
credit marketplace but should be interpreted with caution given these limitations.

Figure 4, below, shows estimates of the number of consumers complaining per every thousand
residents, across the range of demographic characteristics. For groups other than Black or
African Americans, as the share of a race or ethnicity increases the rate of submitting first
increases and then slowly declines. By contrast, as the share of African American residents
increases, the rate of submitting complaints continues to increase across virtually the whole
range of shares. This difference is substantial, but it is unclear what factors contribute to the
higher rates of submission in communities with a high share of Black or African American
residents. One possible explanation is that it reflects neighborhood “learning” of some kind—i.e.,
information about the complaint process may have spread significantly in some Black or African
American communities.

15 CONSUMER FINANCIAL PROTECTION BUREAU
FIGURE 4: ESTIMATED MEAN NUMBER OF RESIDENTS SUBMITTING COMPLAINTS PER 1000 RESIDENTS
 FOR TRACTS FROM ZERO TO HUNDRED PERCENT SHARE OF RACE. CONDITIONAL MEANS
 ARE ESTIMATED USING CUBIC REGRESSION SPLINES. CONFIDENCE INTERVALS ARE 95%.

For the share of Black or African American residents, the estimated number of residents
submitting complaints per thousand peaks at nearly 2.4 for tracts with the greatest percent
share of Black or African Americans. Census tracts with the greatest shares of Black or African
Americans (over 95%) have estimated complaint rates that are double the rates for tracts where
around 5% of residents are Black or African American. By contrast, the number of residents
submitting complaints peaks at around 1.4 complaining consumers per thousand residents, for
tracts that have around 25% Hispanic or Latino residents. The average number of consumers
submitting complaints for tracts that are 95% Hispanic or Latino is around half the average
number of complainants in the least concentrated tracts.

Looking across the values of AMI in Figure 5, below, provides insight into which consumers
submit complaints to the CFPB. The lowest-income census tracts submit the most complaints;
census tracts with median incomes around 40% of the enclosing area’s median income have
around 1.3 consumers submitting complaints per thousand residents. Census tracts at around
100% of AMI have only one resident submitting complaints per thousand residents. The number
of complainants again increases in census tracts with median income around 200% of the larger

16 CONSUMER FINANCIAL PROTECTION BUREAU
area’s median income, with roughly 1.2 consumers submitting complaints per thousand
residents.

FIGURE 5: ESTIMATED MEAN NUMBER OF CONSUMERS SUBMITTING COMPLAINTS PER 1000
 RESIDENTS FOR TRACTS ACROSS THE VALUES OF PERCENTAGE OF AREA MEDIAN
 INCOME. CONDITIONAL MEANS ARE ESTIMATED USING CUBIC REGRESSION SPLINES.

The Appendix to this report provides additional detail about how demographic characteristics
vary across the credit life cycle. We include this appendix to provide additional context to help
better understand how census tract-level demographic characteristics vary with different shares
of complaints about the credit life cycle. It presents a series of plots depicting the coefficients of
models fit to each year of the data. Each model predicts the census tract-level demographic
characteristic using the shares of consumers in each life cycle. Each plot is also accompanied by
relevant predictive comparisons.

17 CONSUMER FINANCIAL PROTECTION BUREAU
4. Analysis
This section takes a deeper look at how the demographic characteristics of communities vary
across credit life cycle stages. In each demographic bin, we examine the share of consumers
submitting complaints about a particular life cycle stage. Because consumers can, and often do,
submit complaints about more than one life cycle category, the total shares in this section do not
sum to 100%. We also calculate and consider the relative difference in these shares between the
high bin (i.e., the bin with the highest income or share of race) and the low bin (i.e., the bin with
the lowest income or share of race). The relative difference is calculated as follows:

 = (ℎ ℎ − )/

By looking at these relative differences, we can compare the credit life cycle categories, even
where there is a large difference in the overall share of consumers submitting complaints
between categories, because all the values are on the same scale. 29 We then look at how these
percentage differences have evolved over the last three years.

4.1 Income
We first examine the relationship between a community’s percentage of AMI with the share of
consumers in those communities who have submitted complaints about each credit life cycle
category.

As shown in Figure 6, below, there are noticeable differences in the shares of consumers
submitting complaints about each credit life cycle category between AMI percentage bins, with
large differences across all categories between the lowest AMI bin (i.e., an AMI percentage lower
than 80%) and the highest (i.e., an AMI percentage higher than 120%).

29For example, roughly ten times as many consumers complain about credit reporting as complain about loan
 originations.

18 CONSUMER FINANCIAL PROTECTION BUREAU
FIGURE 6: SHARES OF CONSUMERS FROM DIFFERENT RELATIVE INCOME CATEGORIES WHO
 SUBMITTED COMPLAINTS ABOUT EACH CREDIT LIFE CYCLE CATEGORY

As the graph shows, 5% of consumers from the lowest AMI bin submitted complaints about loan
origination versus 8% from the highest AMI bin.

In addition, credit reporting was the credit life cycle category that captured the biggest share of
consumers for all income bins: 55% share of consumers from the lowest AMI bin versus 42%
from the highest AMI bin.

The credit life cycle category shares from the middle AMI groups are generally situated between
the low and high AMI groups and highest AMI, except in the case of delinquent servicing. This
suggests that the other credit lifecycle categories share decreases or increases dependent on that
life cycle groups median income. For communities with relatively high incomes, complaints
about loan originations and performing servicing are relatively more common and complaints
about credit reporting and delinquent servicing are relatively less common.

The relative difference in shares between the high and low income bins, depicted in Figure 7,
provide a measure of the degree to which complaints about a particular lifecycle category are

19 CONSUMER FINANCIAL PROTECTION BUREAU
present in communities with higher income at a greater rate (positive values) or present at a
lesser rate (negative value).

FIGURE 7: RELATIVE DIFFERENCE IN SHARES BETWEEN TRACTS WITH 120% OR GREATER OF THE
 AREA MEDIAN INCOME AND TRACTS WITH 80% OR LESS OF THE AREA MEDIAN INCOME FOR
 THE STAGES OF THE CREDIT LIFE CYCLE

Positive values mean tracts with AMI > 120% residents have a greater share. Negative values mean tracts
with AMI < 80% residents have a greater share.

Communities with the highest AMI submitted complaints about performing servicing at a
frequency of 67% greater than those from the lowest AMI bin. On the other end of that
spectrum, the share of consumers from the highest AMI bin submitting complaints about credit
reporting was 23% lower than for the lowest AMI bin. Credit reporting is the credit life cycle
category that is the most underrepresented in the highest AMI bin.

20 CONSUMER FINANCIAL PROTECTION BUREAU
FIGURE 8: MONTHLY TIME SERIES OF RELATIVE DIFFERENCE BETWEEN CENSUS TRACTS WITH
 HIGHEST INCOMES AND CENSUS TRACTS WITH LOWEST INCOMES FOR THE STAGES OF
 THE CREDIT LIFE CYCLE

Positive values mean tracts with AMI > 120% residents have a greater share. Negative values mean tracts
with AMI < 80% residents have a greater share.

Figure 8, above, shows how differences between the highest AMI bin and the lowest increased
substantially during 2020 for loan origination and performing servicing. The main issues
accounting for these changes relate to applying for—or refinancing—an existing mortgage,
closing a mortgage, and issues getting a credit card.

The relative difference in share between the high and low bins declined for delinquent servicing
somewhat in 2019 and 2020. This trend is in line with other research suggesting that lower
income consumers are using stimulus payments to pay-off debts at a fairly high rate. 30

30See Olivier Armantier et al., “How Have Households Used Their Stimulus Payments and How Would They Spend
 the Next?,” Federal Reserve Bank of New York, Liberty Street Economics (Oct. 2020),
 https://libertystreeteconomics.newyorkfed.org/2020/10/how-have-households-used-their-stimulus-payments-
 and-how-would-they-spend-the-next.html.

21 CONSUMER FINANCIAL PROTECTION BUREAU
4.2 Race and ethnicity
This section focuses on the three largest minority groups in the U.S.: Black or African
Americans, Latinos or Hispanics, and Asian American or Pacific Islanders. We also include
information about white, non-Hispanic residents for comparison. This section follows the same
approach used with income, by first looking at differences in credit life cycle categories for these
groups and looking at how these differences have evolved over the last three years.

We first examine the relationship between a community’s percentage of white, non-Hispanic
residents with the share of consumers submitting complaints about each credit life cycle
category.

As shown in Figure 9, below, there are noticeable differences in the shares of consumers
submitting complaints about a credit life cycle category between each white, non-Hispanic
percentage bin, with the largest differences being between the lowest white, non-Hispanic
percentage bin (i.e., a percentage less than 35%) and the highest (i.e., a percentage greater than
71%). The trends match those we saw when we analyzed community AMI—wealthier census
tracts and census tracts with more white, non-Hispanic residents both have a greater share of
consumers with loan origination and performing servicing complaints, and a lower share of
consumers with credit reporting and delinquent servicing complaints.

22 CONSUMER FINANCIAL PROTECTION BUREAU
FIGURE 9: SHARE OF CONSUMERS WITH COMPLAINTS ABOUT EACH CREDIT LIFE CYCLE CATEGORY
 FOR CENSUS TRACTS WITH DIFFERENT CONCENTRATIONS OF WHITE, NON-HISPANIC
 RESIDENTS.

As the graph shows, 4% of consumers from the lowest white, non-Hispanic percentage bin
submitted complaints about loan origination versus 8% from the highest.

The same graph shows that the credit life cycle category that captured the biggest share of
consumers for all white, non-Hispanic percentage bins–similar to the income bins–was credit
reporting: 58% of consumers from the lowest white, non-Hispanic percentage bin submitted
complaints about credit reporting versus 37% from the highest.

Similar again to income, the credit life cycle category shares from the middle white, non-
Hispanic percentage bin are, aside from delinquent servicing, between the shares of the lowest
and highest white, non-Hispanic percentage bins. As such, it appears as though a credit life cycle
category share of consumers in a bin also decreases or increases dependent on that bin’s white,
non-Hispanic percentage.

With that point of comparison established, we look at the credit life cycle shares for minority
demographics, starting with Black or African American population percentages.

23 CONSUMER FINANCIAL PROTECTION BUREAU
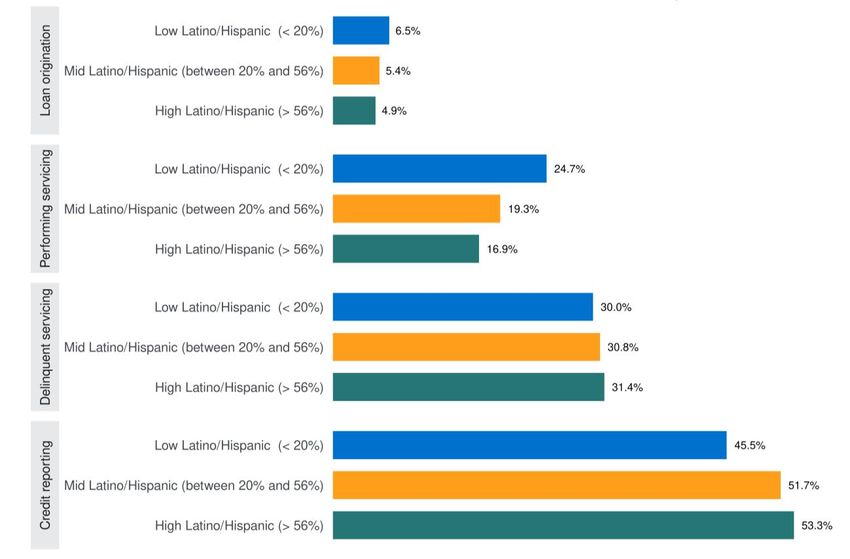
FIGURE 10: SHARE OF CONSUMERS WITH COMPLAINTS ABOUT EACH CREDIT LIFE CYCLE CATEGORY
 FOR COMMUNITIES WITH DIFFERENT CONCENTRATIONS OF BLACK OR AFRICAN AMERICAN
 RESIDENTS

In Figure 10, above, the relationships between the tracts with the highest share of Black or
African Americans residents and those with the lowest share are consistently inverted from that
of white, non-Hispanic population shares across the credit life cycle categories. The credit life
cycle categories overrepresented in the highest AMI and white, non-Hispanic percentage bins
are underrepresented in the highest Black or African American percentage bin (i.e., loan
origination and performing servicing) while the categories underrepresented in the highest AMI
and white, non-Hispanic percentage bins are overrepresented in the highest Black or African
American percentage bin (i.e., credit reporting). A large share of complaints from high Black or
African American census tracts concern credit reporting.

24 CONSUMER FINANCIAL PROTECTION BUREAU
FIGURE 11: RELATIVE DIFFERENCE IN SHARE OF CONSUMERS SUBMITTING COMPLAINTS BETWEEN
 COMMUNITIES WITH THE HIGHEST CONCENTRATION OF BLACK OR AFRICAN AMERICAN
 RESIDENTS AND COMMUNITIES WITH LOWEST CONCENTRATION OF AFRICAN AMERICAN
 RESIDENTS FOR THE CREDIT LIFE CYCLE STAGES

Positive values mean tracts with predominantly Black or African American residents have a greater share.
Negative values mean tracts with lowest concentration of Black or African American residents have a
greater share.

Out of the four credit life cycle categories, percentage differences between the highest Black or
African American percentage bin and the lowest were the following: loan origination (-51%),
performing servicing (-56%), delinquent servicing (-6%), and credit reporting (54%).

25 CONSUMER FINANCIAL PROTECTION BUREAU
FIGURE 12: MONTHLY TIME SERIES OF RELATIVE DIFFERENCE BETWEEN CENSUS TRACTS WITH THE
 HIGHEST CONCENTRATION OF BLACK OR AFRICAN AMERICAN RESIDENTS AND CENSUS
 TRACTS WITH LOWEST CONCENTRACTION OF BLACK OR AFRICAN AMERICAN RESIDENTS
 FOR THE STAGES OF THE CREDIT LIFE CYCLE.

Positive values mean tracts with pred ominantly Black or African American residents have a greater share.
Negative values mean tracts with lowest concentration of Black or African American residents have a
greater share.

The declining percentage difference for loan origination and performing servicing indicates an
increasingly large gap between Black or African American communities and other communities
in complaints about performing loan servicing and new loan originations. The large and
increasing concentration of these complaints in communities with a smaller Black or African
American population may reflect differences in access to credit, especially given that the
pandemic may have inspired a “flight to safety” among some lenders. 31 Persistently high
differences in rates of submitting credit reporting complaints suggests that Black or African

31 See e.g., Akos Horvath et al., “The COVID-19 Shock and Consumer Credit: Evidence from Credit Card Data,”
 Finance and Economics Discussion Series 2021-008. Washington: Board of Governors of the Federal Reserve
 System (Feb. 2021), https://doi.org/10.17016/FEDS.2021.008 (documenting a tightening of credit supply to less
 credit worthy borrowers). See also Alanna McCargo & Jung Hyun Choi , “Closing the Gaps: Building Black Wealth
 through Homeownership,” Housing Finance Policy Center. Urban Institute (December 2020),
 https://www.urban.org/sites/default/files/publication/103267/closing -the-gaps-building-black-wealth-through-
 homeownership_0.pdf (showing that African Americans tend to have lower credit scores).

26 CONSUMER FINANCIAL PROTECTION BUREAU
American communities tend to submit complaints to address past issues they have had with
credit as well as past victimization by identity thieves. 32 These facts, taken together, may reflect
differences in communities’ ability to take advantage of financial opportunities (such as low
mortgage interest rates). Given the scale and persistence of the racial wealth divide,33 these
differences are hardly surprising–but they do highlight the active role that consumers in Black
or African American communities take in trying to address credit issues.

FIGURE 13: SHARE OF CONSUMERS SUBMITTING COMPLAINTS ABOUT EACH CREDIT LIFE CYCLE
 CATEGORY FOR CENSUS TRACTS WITH DIFFERENT CONCENTRATIONS OF HISPANIC OR
 LATINO RESIDENTS

Similar to the Black or African American percentage bins, the relationships between the
different Hispanic or Latino percentage bins are inverted from that of the AMI percentages and
the white, non-Hispanic percentages (see Figure, 13 above). The credit life cycle categories

32A large share of complaints about credit reporting involve claims that information on a consumer’s report is not
 theirs. These differences may reflect past problems with credit as well as higher rates of victimization for some kinds
 of identity theft.
33See e.g., Neil Bhutta et al., “Disparities in Wealth by Race and Ethnicity in the 2019 Survey of Consumer Finances ,”
 Federal Reserve Board (Sep. 2020), https://www.federalreserve.gov/econres/notes/feds-notes/disparities-in-
 wealth-by-race-and-ethnicity-in-the-2019-survey-of-consumer-finances-20200928.htm.

27 CONSUMER FINANCIAL PROTECTION BUREAU
overrepresented in the highest AMI and white, non-Hispanic percentage bins are
underrepresented in the highest Hispanic or Latino percentage bin (i.e., loan origination and
performing servicing) while the categories underrepresented in the highest AMI and white, non-
Hispanic percentage bins are overrepresented in the highest Hispanic or Latino percentage bin
(i.e., credit reporting). While not insubstantial, these differences are less pronounced than they
were for Black or African Americans residents.

FIGURE 14: RELATIVE DIFFERENCE IN SHARE OF CONSUMERS SUBMITTING COMPLAINTS BETWEEN
 CENSUS TRACTS WITH THE HIGHEST CONCENTRATION OF HISPANIC OR LATINO
 RESIDENTS AND CENSUS TRACTS WITH LOWEST CONCENTRATION OF HISPANIC OR LATINO
 RESIDENTS FOR THE CREDIT LIFE CYCLE STAGES

Positive values mean tracts with predominantly Hispanic or Latino residents have a greater share of
consumers complaining about the life cycle category. Negative values mean tracts with lo west concentration
of Hispanic or Latino residents have a greater share of consumers complaining about the life cycle category.

Out of the four credit life cycle categories, percentage differences between the highest Hispanic
or Latino percentage bin and the lowest were the following: loan origination (-24%), performing
servicing (-32%), delinquent servicing (4%), and credit reporting (17%). For all credit life cycle
categories, the percentage differences (in absolute value) for the Hispanic or Latinos percentage
bin were less than that between the Black or African American percentage bins.

28 CONSUMER FINANCIAL PROTECTION BUREAU
FIGURE 15: MONTHLY TIME SERIES OF RELATIVE DIFFERENCE BETWEEN COMMUNITIES WITH THE
 HIGHEST CONCENTRATION OF HISPANIC OR LATINO RESIDENTS AND COMMUNITIES WITH
 LOWEST CONCENTRATION OF HISPANIC OR LATINO RESIDENTS FOR THE STAGES OF THE
 CREDIT LIFE CYCLE

Positive values mean tracts with predominantly Hispanic or Latino residents have a greater share of
consumers complaining about the life cycle category. Negative values mean tracts wit h lowest concentration
of Hispanic or Latino residents have a greater share of consumers complaining about the life cycle category.

The trends over time for Hispanic or Latino communities are generally similar to those for Black
or African American communities. But the percent difference in share of credit reporting
complaints increased somewhat over the course of 2019 and 2020 (see Figure 15, above).
Performing servicing in particular saw a large percentage decline from 2018 to 2020 (from
approximately -20% to approximately -40%).

29 CONSUMER FINANCIAL PROTECTION BUREAU
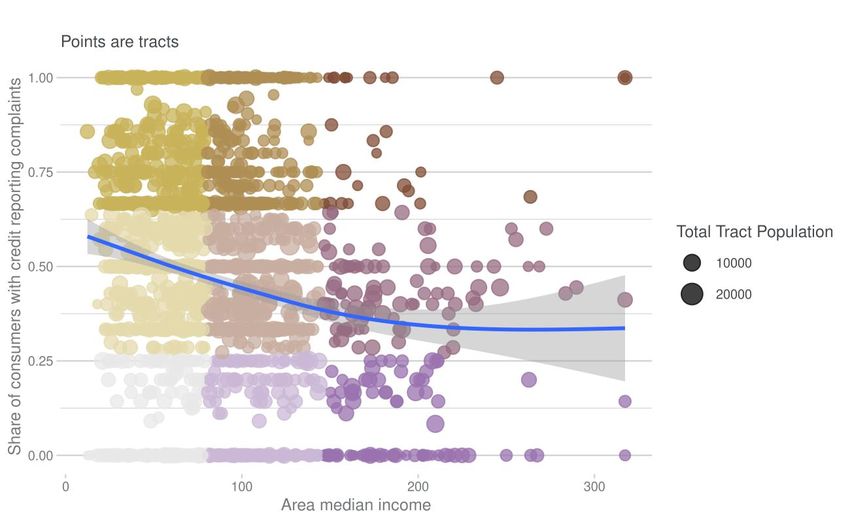
FIGURE 16: SHARE OF CONSUMERS SUBMITTING COMPLAINTS ABOUT EACH CREDIT LIFE CYCLE
 CATEGORY FOR COMMUNITIES WITH DIFFERENT CONCENTRATIONS OF ASIAN AMERICAN
 OR PACIFIC ISLANDER RESIDENTS

Although directionally similar to white, non-Hispanic consumers—communities with the
greatest share of Asian American or Pacific Islander residents also have greater shares of
performing servicing complaints and loan origination complaints and fewer credit reporting
complaints—there are some noteworthy differences. Specifically, the most concentrated Asian
American or Pacific Islander census tracts have rates of submitting complaints about credit
reporting that are much higher than the most concentrated white, non-Hispanic census tracts
and also have a lower share of complaints about delinquent servicing.

30 CONSUMER FINANCIAL PROTECTION BUREAU
You can also read