Consumer Preferences in Food Interactive Packaging - RIT ...
←
→
Page content transcription
If your browser does not render page correctly, please read the page content below
Rochester Institute of Technology
RIT Scholar Works
Theses

5-2018

Consumer Preferences in Food Interactive
Packaging
Nuchjarin Pareeratanasomporn
np3801@rit.edu

Follow this and additional works at: https://scholarworks.rit.edu/theses

Recommended Citation
Pareeratanasomporn, Nuchjarin, "Consumer Preferences in Food Interactive Packaging" (2018). Thesis. Rochester Institute of
Technology. Accessed from

This Thesis is brought to you for free and open access by RIT Scholar Works. It has been accepted for inclusion in Theses by an authorized
administrator of RIT Scholar Works. For more information, please contact ritscholarworks@rit.edu.
Consumer Preferences in Food Interactive Packaging

                         By Nuchjarin Pareeratanasomporn

          A Thesis submitted in partial fulfillment of the requirements for

the degree of Master of Science in Print Media in the School of Media Sciences in the

                       College of Imaging Arts and Sciences

                      of the Rochester Institute of Technology

                                     May 2018

                    Primary Thesis Advisor: Dr. Barbara Birkett

               Secondary Thesis Advisor: Professor Michael Riordan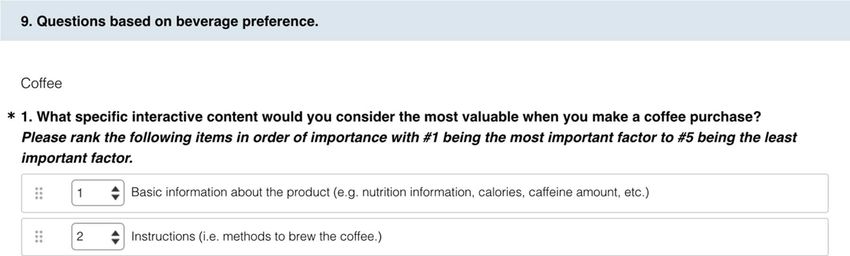
Table of Contents

Table of Contents.…..…..………..…..….….…..…..…..…..…..…..……………..……....i

List of Figures...…..…..…..…..…..…..…..…...…..…..…..……..…..…..……..……..….iii

List of Tables..…..…..…..…..…..…..……..……...…..….……………………………….v

Abstract…..…..…..…..…..…..…..……..….…..…..…..…...…..…..……….…................vi

Chapter 1 Introduction and Statement of the Problem……..…..……..…………...…….…1

           Background……………………..…...…..……..…..……..……..……...…..1

           Statement of the Problem………..…..……..…..…...…..…..…………...…..2

           Reasons for Interest…………..……..…..……..………...……..….....….3

Chapter 2 Theoretical Basis………………..….…..……..……..……………...………….4

Chapter 3 Literature Review………..…..………………..…..………………...………....8

           Packaging Market and Trends………………………………………....…….8

           Impact of Packaging on Purchase……………..…..……..…..………....12

           Interactive Packaging Technology………..……..……..…..….………...14

            Quick Response Code Scanning (QR Code)…..………..…................15

              QR Code Structure and Functional Elements…............................15

              QR Code Printed Size……..….....…….……..…............................17

            Augmented Reality (AR) …………………………….........................19

            Radio-Frequency Identification (RFID) ………………………...…...19

            Near Field Communication (NFC) ………………….….……………20

Chapter 4 Research Objectives………..…..………..………..….……..…….…………22

                                        i
Chapter 5 Methodology…………..………..………..………..……….….……...…...23

Chapter 6 Results…………..……..…..…..…..…..…..…..…..…..…..…..…..….….27

           Sample Demographic…..…..…..…..…..…..….….…..…..…..…….…27

           Smartphone Usage and Behavior…..…..…..…..…..…..….………..….28

           Factors and Information Participants Consider When Selecting a Food

           Product………..…..….…..………....…..….….…..…..…...…..…..…….29

           Interactive Features Awareness, Experience, and Their Opinion to the

           Features…..…..…..…..…..…..….……………………....…..…..…..…...32

           The Result Regarding Participants’ Beverage Purchase……………….…35

Chapter 7 Summary and Conclusions….…..…..…..…..…..…..…..…..…..…….….43

           Research Question 1…..…..…..…..…..…..….….…..…..…..……..….43

           Research Question 2…..…..…..…..…..…..….….…..…..…..……..….44

           Research Question 3…..…..…..…..…..…..….….…..…..…..……..….45

           Analysis and Summary Conclusions…..…....…..…...…..…..…..…..….46

           Limitation and Future Research…..…..…..…..…..…..….….…..……….48

Bibliography…………………………………..………..………..…………………......50

Appendices……..………..………..………..………………..………..………..…...……56

                                       ii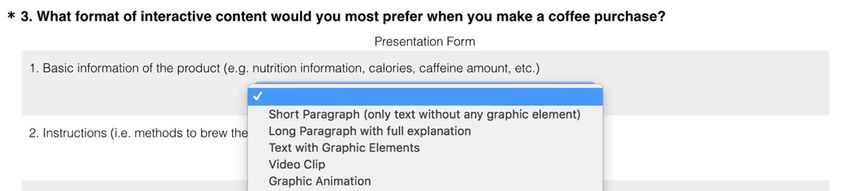
List of Figures

Figure 1. Heinz Ketchup Augmented Reality Activity through Blippar Application….…7

Figure 2. Value of Global Printed Packaging and Labeling 2010- 2020……..……….......9

Figure 3. Smart Packaging Trends and Annual Growth Between 2014 to 2025……...…10

Figure 4. Percentage of Young Adults Who Have Scanned QR Code, by Media, 2012...11

Figure 5. QR Code Elements and Its Structure………………,………………………….16

Figure 6. Percentage of Respondents’ Background Categorized by College..…….…….28

Figure 7. Frequency of Downloading a New Application onto Smartphone……..……..29

Figure 8. Factors Respondents Consider When Selecting a Food Product …..……...….30

Figure 9. Product Label Information Respondents Consider when Selecting a Food

         Product…..…………………………………………………………………………………...…….31

Figure 10. Respondents’ Awareness and Experience with Interactive Feature:

          QR Codes and Augmented Reality …..…..…..…..…..…..…..…..………..…32

Figure 11. Factors Limiting the Use of Interactive Features....…..…..…..…..…..…..….33

Figure 12. Percentage of Respondents Beverage Purchasing: Only Coffee,

          Only Tea, Both Coffee and Tea, or Neither Beverage…..…..………….…....36

Figure 13. The Interactive Content Respondents Consider the Most Valuable When

          Making a Purchase …..….…..………………………………………………………….….38

Figure 14. Percentages Showing Respondents' Preferences for Interactive

          Content Format……..…..…..……………………………………..………….40

                                          iii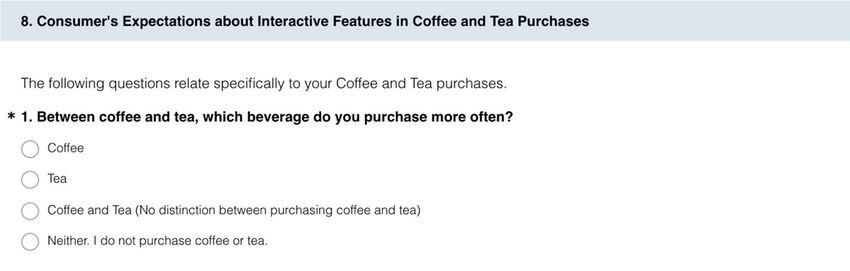
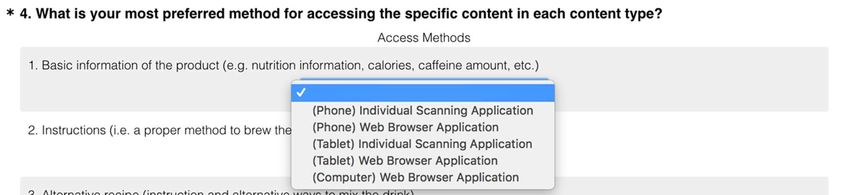
Figure 15. Percentags Showing Respondents' Preferred Method for Accessing Interactive

          Content…..…..……………………………..………..…..…..…...…..…..…...42

                                         iv
List of Tables

Table 1. Independent and Dependent Variables…………………………………….…...25

Table 2. Factors That Can Increase the Use of Interactive Features…..…..…..………...34

Table 3. The Interactive Content Respondents Consider the Most Valuable

         when Making a Coffee or Tea Purchase ..…..…..……………..…..…...……...37

Table 4. Respondents’ Preference in Interactive Content Format in Each Specific

        Content Type…..…..…..…..…..…..…..…..…..…………………………..…....39

Table 5. Respondents’ Preference Method for Accessing Each Specific Content Type...41

Table 6. Correlation Between Method for Accessing Each Specific Content Type……..46

                                           v
Abstract

       Interactive packaging is an innovation that has been adopted by the packaging

design industry. It enables consumers to interact with packaging through their smart

devices. Although the technology is already available, it is uncertain how many

consumers use it or will ever find it useful.

       This research measured the young Millennial (18-24 years old) consumers’

perspectives and their preferences for interactive feature on food packaging. College

students between 18 to 24 years old were chosen by using a purposive sampling method.

First, a questionnaire asked for information about the participants’ behavior surrounding

two topics. The first topic asked about their smartphone usage, and the second topic

asked about the factors affecting their purchasing decisions concerning food products.

Next, the survey focused on the consumers’ perceptions and their experiences with

interactive activities. QR codes and Augmented Reality were the variables. Participants

without any awareness of interactive features and participants without any experience in

using interactive features, even though they were aware of them, were introduced to the

interactive packaging functions through a video in order to help them to better understand

interactive packaging features.

       Lastly, the survey asked for respondents’ opinions and expectations of interactive

features in terms of the content, both function and form, and their preferred method of

access. In this part of the study, coffee and tea products were used as example products.

The data was analyzed by using Descriptive Statistical Analysis.

                                                vi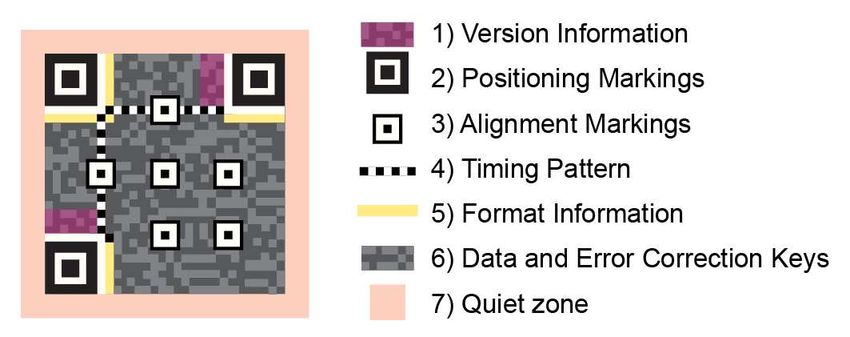
A sample of 80 students between 18 to 24 years old participated the survey.

Participants were more aware and have experienced the QR code scanning more than the

Augmented reality scanning. Basic information and product reviews were the top two

rated for the content consumers considered important. Short paragraph and text with

graphic elements were preferred interactive content formats. Consumers preferred using a

web browser application on their phones to search for product information more than

using a scanning application.

                                           vii
Chapter 1

                                        Introduction

Background

       The development of technology has a direct and indirect impact on any business.

The packaging industry has been influenced by the increasing use of technologies such as

the Internet. Technologies have generated new features for packaging which can

transform traditional packaging into an interactive medium. Interactive packaging

provides functional enhancement that increases the consumer’s experience with products

(Wilder, 2015). Interactive packaging can be described as a component of packaging’s

ability to provide functionality; in this case, the feature allows a brand to insert

information onto packaging which can be read through smartphones or other digital

devices. The experience at the point of sale may stimulate the purchasing decision. The

design of packaging for both aesthetics and functions is an important factor in attracting

buyers among numerous competitors on the shelf.

       The interactive packaging trend is rapidly expanding its markets. VisionGain

(2015) forecasted the smart packaging market from 2015-2025. They reported revenue of

smart packaging in 2015 was $1.9 billion. They predicted revenue to increase 36% by

2020, and 68% by 2025. Interactive packaging activity uses mobile technology, and

smartphone global revenue (Statista, 2016) is predicted to increase to $401.3 billion in

2016. Statista (2016) also reveals that smartphone users worldwide, those with immediate

access to interactive packaging, will be up to 5.07 billion people in 2019.

                                               1
Statement of the Problem
The forecast of smart packaging trends and the growth of the mobile device
market support the notion that smart packaging will play a significant role in the
packaging industry. Two types of interactive packaging that do not require special
printing techniques to produce them are Quick Response (QR) code scanning and
Augmented Reality (AR) technology.
QR codes are common in consumer advertising. Although the usefulness of
interactive technology is known and available, the functions are not widely used by
consumers. The data comparing the number of mobile phone users who scanned a QR
code from January of 2012 to May of 2013 showed that the number of QR Code
subscribers grew by 13.84% while the number of smartphone owners increased by
39.19% (Marketing Charts, 2013). Thus, the growth of QR code scanning subscribers
was not parallel to the increase in smartphone users even though the applications for QR
codes scanning were available for free download. Will this be the case for other types of
interactive packaging?
As Barton, Formm, and Egan (2012) revealed, the Millennial generation is
increasing in number and has a significant impact on the market. Also, the Millennials
have grown up in a period of advancement in innovation and technology, and they tend to
be more professional in using these advancements than other generations. This thesis
research focuses on the young Millennial consumers’ preferences and perspectives on
2interactive food packaging.
Reasons for Interest
The researcher has a background in graphic design, with printing technology
being a personal interest. Graphic design and printing are a perfect combination for
developing new packaging products. The researcher believes that graphic design would
not be successful without a good printing method. The researcher took a course on
packaging in the Print Media program, and the package printing industry was shown to
be highly attractive. Packaging can be presented in a variety of design types that use
various techniques to produce them. Smyth (2015) stated that electronic media cannot
substitute for packaging as was the case in other graphic printing sectors. However, the
researcher recognizes that developed technology, for example, new interactive media, can
provide a unique experience for the user as well as increase the ability for the brand to
communicate with consumers. An experience that combines both of these worlds could
prove to be a disruptive marketing approach.
Interactive activity is also the researcher’s personal interest. The researcher
considers that an interactive feature on packaging is an effective marketing or sales
feature, and food products, among other products, can take advantage of this technology.
3Chapter 2
Theoretical Basis
This chapter presents the theoretical background required to explain pertinent
ideas regarding this study.
Klimchuk, Krasovec, and Sandra (2013), in the book Packaging Design:
Successful Product Branding from Concept to Shelf, state that packaging has been used
since ancient times as humans needed to gather, collect, store, transport, and preserve
goods. Groth (2006) also presented the history of packing and packaging in the book
Exploring Package Design and said that ceramic pottery, wooden boxes and barrels were
used as containers to store products and food. The development of materials and the
innovation of machinery and technology heightened the possibility to design and to
produce packaging. Subsequently, glass, metal, paper, cardboard, and plastic were used,
and all now play important roles as packaging substrates. They provide varied choices to
create structure, function, and aesthetics in design.
Packaging has become more significant since the period of the Industrial
Revolution (Groth, 2006). Once mechanization flourished, advanced technology was
invented in order to serve demands in the area of commerce. Package labeling is an
important packaging component in that it facilitates marketing communication through
the design of a label that differentiates the product. Moreover, today the label can
generate interactive activities on packaging.
4As mentioned previously, a brand can take advantage of the package to
communicate with the consumer at the point of sale. Information about the particular
product can be made available to the consumer through the product label and package
(Mann, 2007). The guidance for the food industry from A Food Labeling Guide by the
Food and Drug Administration (2013) is that most food is required to clarify nutrient
content claims and health messages. A Food Labeling Guide also describes the labeling
requirements in detail as follows:
1. Principal Display Panel (PDP) is the place where all required label statements are
shown, such as the statement of product identity and the net amount of the
product. This information is generally on the front panel and should be most
likely attractive to consumers at the point of purchase.
2. Information Panel Labeling presents the information that does not appear on the
PDP which includes the name and address of the manufacturer, packer and/or
distributor, the ingredient list, nutrition labeling, and any required allergy
labeling.
3. Ingredient List provides the listing of all ingredients.
4. Nutrition Facts Labeling can be placed with the ingredient list and the name and
address of the manufacturer or distributor either on the PDP, or on the
Information Panel Labeling. Also, it can be placed on any alternative panel that
can be seen by the customer.
5. Nutrition Content Claim (NCC) is the information that is required in order to
prevent the nutrition claim from being misinterpreted. It is the claim about food
5that characterizes the level of nutrients in the food, for example, “low fat,” or
“contains 200 calories.”
Besides the mandatory information about the product that is revealed on
packaging, the book Design Matters: Packaging 01 (2008) also supports that packaging
can be used to present general information which allows the brand to provide information
to assist consumers’ purchasing decisions.
The package itself is not only a container of a product. It also has a responsibility
to attract consumers’ attention. Edwards, Klimchuk, Wallace, and Werner (2009) wrote
in the book Really Good Packaging Explained that packages not only hold the product
and provide the surface for listing product attributes, but they also produce the
opportunity for the brand to tell its story. Procter and Gamble, a leading company in the
multinational manufacture of family, personal, and household care products, believes that
packaging is the first and almost always the last moment of truth before a purchase is
made. This is supported by the research of Frontiers (1996) who indicated that
approximately 73% of purchasing decisions are made at the point of sale. In addition, the
development in interactive technology also increases the ability of a package to
communicate more information to its customers.
Mobile technology has developed rapidly in the past decades. Consumers have
been surrounded with interactive devices which impact their behavior in some way.
Packaging is one of the media that is trying to connect with consumers through the use of
these technologies. The interactive features in packaging allow consumers to get
6information beyond the information printed on the package or label. They also increase
the user experience through the activities provided by the interactive technologies.
Figure 1. Heinz Ketchup Augmented Reality Activity through Blippar Application.
An example of interactive activities on packaging is demonstrated in Figure 1.
Heinz ketchup packaging allows customers to connect to the Blippar application by using
their smartphone to scan the label on the ketchup bottle. When the database recognizes
the element of the label, it generates an augmented reality of a cookbook. While using the
application, customers get choices of recipes in which Heinz ketchup is an ingredient.
Moreover, they receive other information from the Heinz company as well as the link to
the company’s website.
There are several technologies that generate a connection between packaging and
consumers through mobile devices, such as the QR code scanning, augmented reality,
Radio-frequency Identification (RFID) and Near Field Communication (NFC). These are
described in the next chapter.
7Chapter 3
Literature Review
Packaging has played a significant role in the food industry. Development of
technology has influenced traditional food packaging with its responsibilities to protect,
communicate, and provide convenience and containment (Biji, Ravishankar, Mohan,
Gopal, 2015). Interactive packaging is an innovation that enhances communication
between the brand and the consumers and is the focus of this literature review. Since
packaging has become an important factor in the age of consumption-driven retail,
research on consumer preferences is also reviewed.
Packaging Market and Trends
The package printing industry is growing. Smyth (2015) indicated that demands
for packaging would become more substantial in both its physical protection and its
promotional roles.
8Global Printed Packaging and Labeling Market
600.00
500.00
TOTal ($Billion)
400.00
300.00
200.00
100.00
0.00
2010 2015 2020
YEAR
Figure 2. Values of Global Printed Packaging and Labeling 2010-2020. Adapted from
The Future of Digital vs Analogue Printing to 2020 (16), by S. Smyth, 2015, Akron,
OH: Smithers Pira.
Smyth’s (2015) report, The Future of Digital vs Analogue Printing to 2020,
reveals values for the global printed packaging and labeling market. Both conventional
printing technology and digital printing technology in 2015 were at a high of $402.91
billion. This figure is forecasted to grow to $492.96 billion by 2020. Figure 2 shows this
projected growth.
9Smart Packaging Market Forecast 2015-2025
3.5
3
2.5
Sale ($B)
2
1.5
1
0.5
0
2015 2017 2019 2021 2023 2025
Year
Figure 3. Smart Packaging Trends and Annual Growth Rate between 2014 to 2025.
Adapted from Smart Packaging Market Report 2015-2025 (79), 2015, VisionGain.
Smart packaging is also expanding. The development of technology has
influenced packaging with conventional packaging becoming smarter. VisionGain (2015)
forecasted the smart packaging market from 2015-2025. The revenue from smart
packaging in 2015 was $1.9 billion. They predicted it to increase 36% by 2020, and 68%
by 2025. The chart showing smart packaging trends and projected annual growth from
2014 to 2025 is presented in Figure 3.
The number of mobile phone users and QR code subscribers (Data Dive: QR
Codes, 2013) in the US from September 2011 to May 2013 indicates that the growth of
QR codes scanning subscribers was not parallel to the increase in smartphone users even
though the applications for QR codes scanning were available for free downloading.
10Percentage of Young Adults Who Have Scanned
QR Code, by Media, 2012
50%
Percent of Respondents 45%
40%
35%
30% 27%
25% 21% 21% 21%
20%
15% 13%
9%
10% 7%
5%
0%
Magazine Poster Mail Packaging Website Email TV
Media
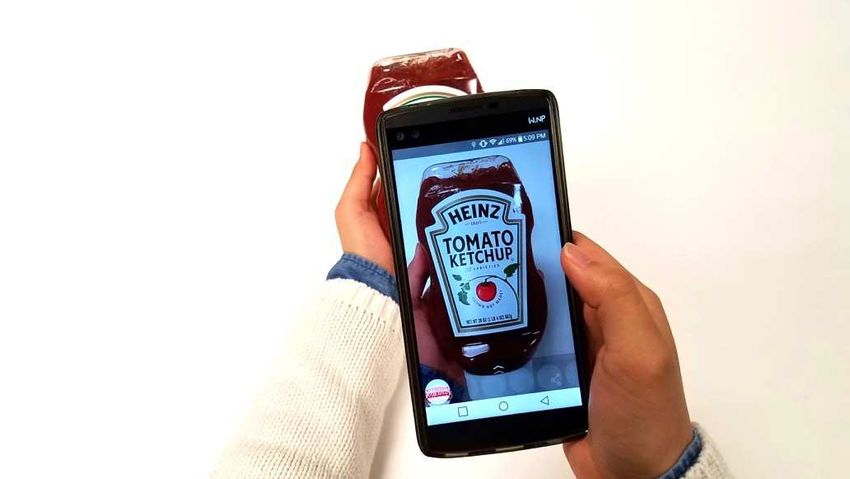
Figure 4. Percentage of US and Western Europe Young Adults Who Have Scanned a QR
Code, categorized by Media in 2012. Adapted from US Ahead of Western Europe in QR
Code Usage, 2013. Retrieved from http://www.eMarketer.com/Article/US-Ahead-of-
Western-Europe-QR-Code-Usage/1009631.
The QR Code usage among 3,000 young adult consumers between 18-34 years
old in the US and Western Europe was studied by the company, Pitney Bowes. The study
found that consumers were more familiar with the codes on magazines and printed
materials such as posters, mail, and packaging than the codes shown on websites, email,
or television. However, Figure 4 shows that the percentage of users in each media is
lower than 30 percent.
11Impact of Packaging on Purchase
Among the competitive products on the shelf, packaging performs as a
representative of the brand to draw the customer’s attraction. It acts as a silent salesman
(Osborne, 2012). Even the placement of the elements in packaging design impacts the
consumer’s recall of the package. Rettie and Brewer (2000) found that the most effective
layout of packaging design is that the text should be presented on the right-hand side and
the image should be placed on the left-hand side of the package.
The visual influence on in-store buying decisions was studied by Clement in
2007. The experiment used eye-tracking equipment to evaluate how packaging design
influences buying behaviors. The study concluded that in-store purchasing could be
classified into four phases. The first phase is a pre-attention phase where consumers’
attention is attracted by the visual impact of the packaging. The next phase is the
succeeded attention phase in which the packaging design impacts the consumers’ minds.
Then the physical action phase occurs when consumers pick the package up from the
shelf. The last phase is the post-purchase phase where the decision and the purchase are
made.
Visual elements of packaging (Wang and Chou, 2010) are the primary
communication media between the producer and the consumer, especially for food
packaging. However, the consumer’s ability to perceive the design of a package is varied.
Individual consumers have their own decision-making approaches and interest in the type
of information and the appearance of the package (Hawkins, Best, & Coney, 2004). Some
consumers focus on price, while others might emphasize the product appearance, and
12others might be concerned about ingredients and consumption instructions. Moreover,
consumers’ preferences and expectations differ by generation as well.
Every generation has encountered different moments in a specific time that have
an impact on their characteristics. For instance, the conservative view of life of the early
Baby Boomers was influenced by the World War II period, or the Generation X’s life
was affected by the destruction of the Berlin Wall and the AIDS contagion. The
Millennial’s view has been influenced by the terrorist attack on September 11th, or by the
repercussions from the Asian Tsunami. Moreover, a great impact on the Millennial
lifestyle is the substantial use of technology (Downing, 2006; & Lowes, 2015).
The Millennial generation (Barton, Fromm, and Egan, 2012), also known as
Generation Y, is increasing, and has a significant impact in the consumer market. In
2012, the number of U.S. Millennials was 79 million while there were 76 million Baby
Boomers (those born between 1946-1964). In demographic terms, the Millennials are a
group of people whose birth years ranged from the early 1980s to the early 2000s.
Moreover, the generation of Millennials is also divided into two segments (Cohen, n.d.):
Younger Millennials are from 18-24 years old, and the older Millennials are from 25-34
years old. The major difference between these two Millennial groups is the level of
education, and their economic dependence on their parents (Barton, Fromm, and Egan,
2012).
When the Millennials are compared with other generations, the Millennials have
grown up in a period of advancement in technology. Therefore, technological
advancement and innovation (Barton, Fromm, and Egan, 2012) have influenced their
13behavior, including the way they purchase. Moore (2012) conducted a study, Interactive
Media Usage Among Millennial Consumers, comparing the use of interactive technology
in the context of purchasing clothes, shoes, and accessories between the Millennial
consumer and the Generation X consumer, and between the Millennial consumer and the
Baby Boomer consumer. The study found that Millennials were more likely to be
motivated to use interactive technologies for marketing purposes, and to connect with the
brand through mobile devices and conventional internet methods. However, they were
not engaged with the brand’s social network activities as much as Generation X. When
Millennials were compared with the Baby Boomers, Millennials were more likely to use
internet resources for functional and entertainment purposes. They also interacted with
the brands’ and retailers’ links through blogs and coupons. However, the study also found
that the rate of online purchasing in Millennials was lower than that of the Generation X
and the Baby Boomers.
In response to different preferences in consumers and the development of
consuming methods, the packaging industry has also developed innovative technology to
enhance the packaging potential for the consumer to obtain more information. Interactive
packaging is one of the latest technologies that enables consumers to interact with the
packaging through their smart devices. The history and the current state of interactive
packaging is presented in the next section.
Interactive Packaging Technology
As was mentioned previously, interactive activities on packaging can be
facilitated through several features, such as QR code scanning, Augmented Reality
14scanning, RFID scanning, and NFC scanning. This section describes the characteristic of
each feature.
Quick response code scanning (QR code). The QR code (Lin, Luo, & Chen,
2013) is a universal two-dimensional barcode that encrypts information. It is widely used
because of its low creation cost. Also, it is easily scanned through smart devices by using
the device’s built-in camera to access information and a downloaded app.
The QR code (Denso Wave Incorporated, n.d.) was designed in Japan for tracking
components in industry. It was first used in the automotive industry, and it was later used
in other industries, such as the food and pharmaceutical industries, to control their
merchandise.
QR Code Structure and Functional Elements. The QR code is able to handle a
large amount of data, up to 7,089 numerals which is its maximum version. The QR code
(QRStuff, n.d.) can be read either upside down or on a distorted surface because of its
error correction data feature which is described in the following section.
15Figure 5. QR Code Elements and its structure. Adapted from What’s A QR Code?,
In QRStuff, n.d., Retrieved September 22, 2016, from http://www.qrstuff.com/
qr_codes.html
A QR code consists of seven major elements which are shown in Figure 5.
QRCode-Generator.de (n.d.) explains each element of the QR Code structure:
1) Version information demonstrates the datatype, version, and error correction
level of the code. The datatype can be the numerical or the alphanumeric
content. There are 40 versions of the QR Code. Each version indicates the
dimensions and capacities of the code. The largest one is code version 40
which can hold up to 7,089 numerals as mentioned earlier. The error
correction is an element that detects and corrects code errors. It helps the
scanner to read the code, even if some parts of the code are damaged. There
are 4 levels of error correction of which the lever L (Low) is the lowest level.
Seven percent of code words can be restored in level L while 30 percent of
code words can be restored in level H (High) which it is the highest level of
the error correction. However, the capacity decreases in the higher error
correction level.
162) Positioning markings signify the direction in which the code is printed.
3) Alignment markings are additional elements for a large scale QR code. They
are used to indicate the code’s orientation.
4) The timing pattern is an indicator for the scanner to specify the size of the data
matrix.
5) Format information helps the code to be more easily scanned. It contains
information about the error tolerance and the data mask pattern.
6) Data and error correction keys hold all the data.
7) The quiet zone is a barrier to separate the code from its surroundings.
QR Code Printed Size. The website QRStuff (2011) explains that the published
size of the code depends on an appropriate scanning environment factor such as distance
and brightness. Also, the data density is a factor. The greater density of data makes the
code presented in a smaller pixel size. This means that it requires a more precise scanning
environment to read the code. QRCode-Generator.de (n.d.) supports that a sufficient
simple code size is 20x20 millimeters for a small format publishing, for example, the
code in a magazine, or the code on a package.
QR Codes are available in various types. Each type provides different functions.
Denso Wave Incorporated (n.d.) describes QR Code in five types:
1) QR Code Model 1 and Model 2 are the original types of the QR Code. The
largest of Model 1 is QR Code version 14, which is able to hold up to 1,167
17numerals. Then, the Model 2 is an enhancement of the Model 1. It can store
up to 7,089 numerals in its version 40.
2) The Micro QR Code is a small size QR Code which allows it to be printed in a
small space. It can store only 35 numerals as the maximum amount of data.
3) The iQR Code is a type that can be produced in either square modules or
rectangular modules. The maximum capacity of this type is about 40,000
numerals.
4) The SQRC is a code that requires a specific reading instrument. It is generally
used to keep private information. The SQRC has the same appearance as the
regular QR Code.
5) The Frame QR is a QR Code that provides a flexible area to be used in the
center of the code. For example, a brand can insert its logo to present its
identity in the middle of the code, and it is still readable.
The QR Code has been developed and improved in its capability to generate a
connection between offline and online media (Bosomworth, 2011). The QR Code is used
in several applications, such as magazine, poster, mail, packaging, website, email, and
television applications. In addition, it is used for many marketing campaigns.
Pasco (2016) has evaluated the effectiveness of QR code labels that directly
deliver detailed information through free applications for smart devices. Although the QR
Code provides real-time data tracking, scanning requires downloading an application
which tends to inhibit consumer behavior.
18Augmented reality (AR). Augmented Reality was created in 1968 by Ivan
Sutherland. Carmigniani & Furht (2011) described Augmented Reality as a technology
that integrates virtual and computer-generated digital content. Augmented reality causes
virtual reality to interact with the physical environment. Carmigniani & Furht (2011)
mentioned in the Handbook of Augmented Reality that augmented reality can be used to
enhance user’s perception of and interaction with the real environment.
QR code scanning and Augmented Reality technology are two types of interactive
packaging that do not require any special printing techniques. Radio-Frequency
Identification (RFID) and Near Field Communication (NFC) are two other types of
interactive technologies that are used in packaging. However, Schiffner (2011) explains
that the layer of RFID printing contains an antenna and microchip, and its production
requires a particular type of thermal transfer digital printing. Similarly, NFC technology
needs microchips to store data in order to transfer the information to another NFC device.
RFID and NFC technology are further described below.
Radio-Frequency Identification (RFID). RFID is explained in the book
Emerging Food Packaging Technology (Yam and Lee, 2012) as the use of radio
frequencies to read information electronically. The book also clarifies that the RFID tag
is classified into two types. The first type is the passive tag whose power is provided by
the energy of the reader; and the second type is the active tag that has its own battery to
transmit signals to the reader.
The book Food and Package Engineering (Morris, 2011) presents the advantages
of RFID tags. RFID provides a communicative function in devices along with large
19amounts of memory. RFID in packaging is also used to track the product in its supply
chain by monitoring the products in logistics, or checking its inventories. Since the RFID
system can be traced from a distance, it is also used to prevent counterfeiting and theft.
The tag maximum reading distance depends on several factors such as the individual
RFID reader and the signal power, the integrated circuit in the tag, the material of the tag,
and the material to which the tag is attached. The low frequency (LF) passive RFID tags
can be read in a foot or less, while the super high frequency active tags can be read up to
the range of 325 feet.
Near Field Communication (NFC). McHugh and Yarmey (2014) introduce NFC
in the book Near Field Communication: Recent Developments and Library Implications
as a type of a radio frequency technology that transmits information wirelessly between
objects, tags, posters, mobile devices, or computers across a small distance. The
theoretical working distance of the NFC is about 20 centimeters.
Nagashree, Vibha, and Aswini (2014) support that NFC functions similar to RFID
tags because it is a non-contact identification and an interconnection. Presently, the use of
NFC enables the popular contactless payment through a mobile phone. It is secure and
convenient. For example, an integration of a credit card and mobile phone and a usage
over NFC generate a purchase through a wireless sensor network. Nevertheless, NFC
technology is in a novel stage of development because it remains challenging to enhance
its compatibility in devices. Moreover, the cost of adopting NFC technology is quite
expensive.
20In conclusion, technology and innovation have enabled packaging to become
more communicative. The point of sale is the last chance for brands to advertise their
products. Packaging then acts as a silent salesperson to present the product to consumers,
and it does have an impact on the consumer’s purchasing decision. Currently, interactive
media involved in the packaging industry enhances the ability of packaging to provide
interactive experiences, and to allow customers to acquire more information. Interactive
activities on packaging are now available. The objective of this research was to
investigate Millennial consumers’ perspectives and preferences concerning interactive
packaging. The significance and potential contribution of this research were to better
understand the views and responses of Millennials in relation to the interactive activities
on packaging.
21Chapter 4
Research Objectives
Interactive features can provide extended content to printed packaging for
consumer goods. This research aimed to answer these research questions:
1. For a population of 18 through 24 year-old consumers, what are the factors
limiting their use of interactive packaging features?
2. For the same population, what specific interactive content, both function and
form, is considered the most valuable in packaging?
3. For the same population, what is the correlation between the desired specific
interactive content in packaging and the preference method of access?
22Chapter 5
Methodology
This research proposes to examine the consumers’ perspective on the interactive
activities on food packaging. The term, interactive packaging, refers to the ability of
consumers to interact with the packaging through their smartphones or any smart device.
Sample
The sample of the study was chosen by the purposive sampling selective method.
All participants were young Millennial students in college. Both male and female persons
between 18 and 24 years old (includes 18 and 24 years old) were selected. In order to
evaluate the respondents’ perspectives on the interactive functions of packaging;
respondents must be smartphone users.
Procedure
The data about consumers’ perception of interactive packaging and the activities
related to it was accumulated from a survey. The first part of the survey contained
questions that asked for information about the participants’ behaviors concerning two
topics. The first topic related to their smartphone usage, and the second topic related to
the factors affecting their purchasing decisions about food products.
The second part of the survey focused on the consumers’ perceptions of
interactive activities. QR codes and Augmented Reality were variables for this research.
Participants without any awareness of interactive features and participants without any
experience in using interactive features even though they were aware of them were
23introduced to the interactive packaging functions through a video in order to enable them
to better understand interactive packaging features.
The last part of the survey asked for respondents’ opinions and expectations about
interactive features in terms of the content, both function and form, and their preferred
method of access. In this part of the study, coffee and tea were used as example products.
The report Coffee Houses and Tea Shops in US by Mintel (2015) provided that
Millennials comprised a large group of coffee and tea consumers. Even though the young
Millennials group was not a premium consumer of coffee and tea as the group of adult
Millennials was, they were beginners that were trying to explore different kinds and
different flavors of coffee. Therefore, the researcher determined that coffee and tea could
be example products for the study.
Key Variables
This research was conducted in order to observe following variables:
1. The Independent variables were the interactive features on packaging, the QR
Codes and Augmented Reality;
2. The Dependent variables were factors limiting the use of interactive features,
the interactive content on packaging, the interactive form of the interactive
content, and the reference method of access to the specific content.
24Table 1
Independent and Dependent Variables
Independent Variable Dependent Variables
The interactive features on packaging, the Factors that limit the use of interactive
QR Code and the Augmented Reality. features
The kind of interactive content on
packaging
The interactive form of the interactive
content
The reference method of access to the
specific content
Analysis
The data was analyzed by using Descriptive Statistics Analysis. The distribution,
the central tendency, and the dispersion were determined.
The method of analyzes depended on the type of question in the questionnaire.
The questionnaire in this survey included four question types (SurveyMonkey, n.d.).
1) A Multiple Choice Question that asked participants to select one or more
choices from a list of answers. The data from this question type was presented as
percentages for each choice. A pie chart was developed to provide data comparison. The
distribution, the central tendency, and the dispersion were determined.
252) A Matrix Question was similar to the Multiple Choice Questions. The question
allowed participants to select an answer from a same preset list of answer choices. The
data from this type of question was also presented in percentages and charts to compare
the results. The distribution, the central tendency, and the dispersion were determined for
each answer choice.
3) A Rating Scale Question or a Likert Scale Question was a question that
assigned weights to each answer. The weighted averaged was calculated for each answer
choice in the analysis. Also, the distribution, the central tendency, and the dispersion
were determined.
x1 w1 +x2 w2 +x3 w3 +…+xn wn
Total
x = response count for answer choice
w = weight of answer choice
4) A Ranking Question was a question that asked participant to compare items by
ranking them in order. The first choice had a weight of the total number of answer
choices (i.e. the question has four answers to be ranked, the first choice will have a
weight of four) and the last choice had a weight of one. An average raking was calculated
for each answer choice. Also, the distribution, the central tendency, and the dispersion
were determined.
x1 w1 +x2 w2 +x3 w3 +…+xn wn
Total
x = response count for answer choice
w = weight of ranked position
26Chapter 6
Results
The methodology described in Chapter 5 was implemented by the researcher over
a two-month period between February and March 2017. The data for the research were
gathered from an online survey. The result and details are described below in the
chronological order of the survey.
- Sample demographic;
- Participants’ smartphone using behavior;
- Factors and information participant consider when selecting a food product;
- Interactive Features (QR Codes and Augmented Reality) awareness,
experience, and perspective;
- Questions with regard to respondents’ beverage purchase which coffee and tea
are example products for this study;
o Specific content participants consider the most valuable;
o Format of interactive content participants prefer to see for each
specific content type;
o Preferred method for accessing each specific content type.
Sample Demographic
The respondents of the survey were RIT Students. A total of 80 surveys were
completed; the respondents, all college students, were 18 through 24 years old. There
27were 46 males (57.5%) and 34 females (42.5%). Respondents were from different
colleges as shown in Figure 6.
Percentage of Responsents' Background Categorized by College
5.0%
7.5%
25.0%
2.5%
6.3%
5.0%
11.3% 13.8%
7.5%
16.3%
Figure 6. The pie chart indicates the percentage of respondents from each RIT College
Smartphone Usage and Behavior
From the survey, data showed that respondents spend an average time of 6 hours
on their smartphones. The maximum amount was 14 hours, and the minimum was 1 hour.
The range of the data was 13 hours which is a large number.
28Frequency of Downloading a New Application onto Smartphone
Less then once a week
Once a week
More than once a week
0% 10% 20% 30% 40% 50% 60% 70% 80% 90% 100%
Figure 7. The Data from the Survey Question “On Average, How Often Do You
Download a New Application onto Your Smartphone?”
There were 63 responses (78.75%) who download a new application on their
smartphone less than once a week, and 10 responses (12.5%) download once a week, and
only 7 responses (8.75%) download an application more than once a week. The data is
shown in Figure 7.
This data showed that students spend significant time on their smartphone;
however, they rarely download a new application.
Factors and Information Participants Consider When Selecting a Food Product
The research also investigated factors that customers consider when purchasing a
food product. The questionnaire asked respondents to rank important factors they might
consider when making a purchase.
29Factors Respondents Consider When Selecting a Food Product
Product Information 4.99
Design of the Package 3.64
New Brand 2.51
New Product 3.55
Discount Coupon 4.75
Advertisement 3.54
Price 6.89
Brand 6.14
1 2 3 4 5 6 7 8
Figure 8. The Data from The Survey Ranking Question “Factors You Consider When
Selecting a Food Product.”
The data from the survey shows in Figure 8 that the respondents considered price
the most important factor when selecting a food product. As shown by the weighted
average of 6.89, brand was the second factor. However, a new brand was the least
considered factor. Furthermore, some respondents also provided additional suggestions as
possible for this choices for this question: Product review, major food allergens, and
expiration date were also mentioned as the factors they considered.
The questionnaire also asked for specific product label information customers
considered when selecting a food product. The list of the labeling requirements from A
Food Labeling Guide by the Food and Drug Administration (2013) were used in the
ranking question.
30Product Label Information Respondents Consider when Selecting a
Food Product
Nutrition Content Claim 2.75
Nutrition Facts about the product 3.96
Ingredients list 3.55
Name of manufacturer, packer, or
3.19
distributor of product
Amount of the product in container 4.06
Statement of product identity 3.49
0 0.5 1 1.5 2 2.5 3 3.5 4 4.5
Figure 9. The Data from The Survey Ranking Question “Product Label Information
You Consider when Selecting a Food Product.”
The graph in Figure 9 presents the weighted average of the respondents to each
type of label information. Amount of the product in container and Nutrition facts about
the product received a similar weighted average. The amount of the product in the
container was a most considered factor which received a weighted average of 4.06.
Nutrition Facts about the product received 3.96. The nutrition content claim received the
weighted average of only 2.75 which means that this information was considered the
least. Expiration date information and product review were also mentioned by
respondents as additional comments with this question.
31Interactive Features Awareness, Experience, and Their Opinion to the Features
The questionnaire asked participants about their awareness and experience in
using interactive features. This study, focused primarily on QR Codes and Augmented
Reality.
Respondents' Awareness and Experience with Interactive Feature: QR Codes
and Augmented Reality
100%
90% 86.25%
80% 72.50%
70%
60%
50%
38.75%
40%
30%
17.50%
20%
10%
0%
AWARE of QR Code EXPERIENCE in QR AWARE of Augmented Experience in Augmented
scainning Code Scanning Reality scanning Reality Scanning
Figure 10. The Data from The Survey Question “Are You Aware of The Use of QR
Code Scanning?”, “Are You Aware of The Use of Augmented Reality Scanning?”, and
“Have You Ever Used QR Code Scanning or Augmented Reality Scanning?”
The data presented in Figure 10 shows that 86.25% of respondents (69 people)
were aware of the use of QR Code scanning; however, there was only 38.75% (31
people) of respondents who were aware of the use of Augmented Reality scanning.
Moreover, the results of the survey showed that 72.50% of respondents were experienced
in using QR Codes, and only 17.5% of respondents had used augmented reality scanning.
32The factors limiting the use of interactive features were the next item of inquiry.
A Likert Scale question was used. Participants chose the reason they were unaware of the
benefit from scanning the interactive feature as the most prominent reason for their
limited use. The weighted average was 3.44. However, other factors received only a
slightly less rating average.
Factors Limiting the Use of Interactive Features
The content provided by the code is not sufficient
interest 3.36
Unaware of benefit from scanning the interactive
feature 3.44
Sufficient WIFI/DATA are available for
downloading the scanning application 2.73
Scanning take too much time
3.15
Do not want to download any scanning
application on the phone 3.32
Do not have any scanning application on the
phone 3.18
0 1 2 3 4 5 6
Figure 11. The Data from The Survey Question “What Factors Limit Your Use of
Interactive Features? (QR Codes, and Augmented Reality)
Figure 11 presents the weighted average for each factor that might limit the
respondents’ use of interactive features. If they were arranged by weighted average from
the highest to the lowest score the order would be; 1) Unaware of benefit from scanning
the interactive feature, 2) The content provided by the code is not of sufficient interest, 3)
33Do not want to download any scanning application on the phone, 4) Do not have any
scanning application on the phone, 5) Scanning takes too much time, and 6) Sufficient
WIFI/DATA are not available for downloading the scanning application.
Table 2
Factors That Can Increase the Use of Interactive Features Total of 78 Responses
(QR Codes and Augmented Reality)
Strongly Strongly Rating
Answer Options Disagree Neutral Agree
Disagree Agree Average
Having a
universal scanning
2 1 11 29 35 4.21
application for all
codes
Packaging clearly
states the benefit
2 1 10 40 25 4.09
of scanning the
code
The questionnaire asked for the factors that could increase the respondents’ use of
interactive features. The researcher provided two choices for participants to rate by using
a Likert Scale. The data shows in Table 2 that 35 participants answered strongly agree for
the factor “Having a universal scanning application for all codes.” This factor received
the rating average of 4.21. Moreover, the additional comments from participants also
supported that they preferred that the manufacturer notify consumers about the benefit of
using interactive packaging with a message on the product or on shelf advertising.
34You can also read