Container Capacity Expansion Plans at Pacific Coast Ports - TP 14710E
←
→
Page content transcription
If your browser does not render page correctly, please read the page content below
TP 14710E

Container Capacity Expansion Plans
       at Pacific Coast Ports

              Prepared for:
         Policy Research Branch
       Strategic Policy Directorate
              Policy Group
            Transport Canada

                 By:
       Hanam Canada Corporation
             Victoria, BC

              January 2007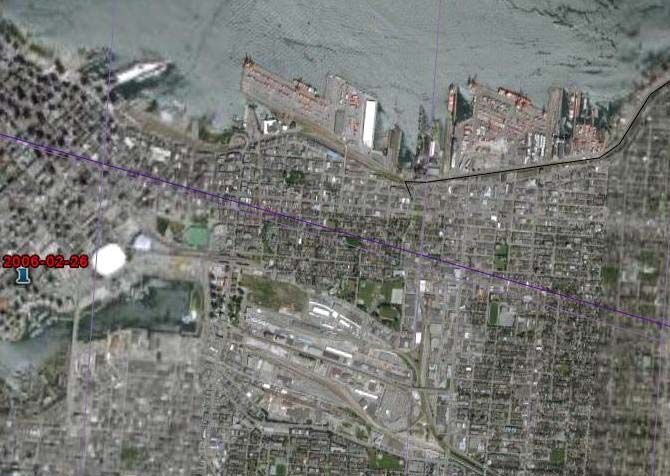

TP 14710E

Container Capacity Expansion Plans
       at Pacific Coast Ports

                   By:
       Hanam Canada Corporation
          1165 Burdett Avenue
         Victoria, BC, V8V 3H3
             250-381-6768
      Web: www.hanamcanada.com
      Helmut G. Burke, P.Eng., MBA
       hburke@hanamcanada.com

              January 2007
Container Capacity Expansion Plans at Pacific Coast Ports        Hanam Canada Corporation
January 2007

The Directory of Pacific Coast Container Ports, Terminals, and Services (TP 14711E)
has been published as a companion document to this report.

This report reflects the views of Hanam Canada Corporation only and does not
necessarily reflect the official views or policies of Transport Canada.

Neither Transport Canada, nor its employees, makes any warranty, express or implied, or
assumes any legal liability or responsibility for the accuracy or completeness of any
information contained in this report, or process described herein, and assumes no
responsibility for anyone's use of the information. Transport Canada is not responsible for
errors or omissions in this report and makes no representations as to the accuracy or
completeness of the information.

Transport Canada does not endorse products or companies. Reference in this report to
any specific commercial products, process, or service by trade name, trademark,
manufacturer, or otherwise, does not constitute or imply its endorsement,
recommendation, or favoring by Transport Canada and shall not be used for advertising
or service endorsement purposes. Trade or company names appear in this report only
because they are essential to the objectives of the report.

References and hyperlinks to external web sites do not constitute endorsement by
Transport Canada of the linked web sites, or the information, products or services
contained therein. Transport Canada does not exercise any editorial control over the
information you may find at these locations.

U.S. dollars are used throughout this report except as noted.

Une traduction de ce document est également disponible en français : «Plans d’expansion
de la capacité en conteneurs des ports de la côte du Pacifique», TP 14710F.

© 2007 Transport Canada

                                              ii
Transport         Transports
                  Canada            Canada                                                                                                       PUBLICATION DATA FORM
 1.    Transport Canada Publication No.                               2.    Project No.                                                    3.    Recipient’s Catalogue No.

       TP 14710E
 4.    Title and Subtitle                                                                                                                  5.    Publication Date

       Container Capacity Expansion Plans at Pacific Coast Ports                                                                                 January 2007
                                                                                                                                           6.    Performing Organization Document No.

 7.    Author(s)                                                                                                                           8.    Transport Canada File No.

       Helmut G. Burke
 9.    Performing Organization Name and Address                                                                                            10.   PWGSC File No.

       Hanam Canada Corporation
       1165 Burdett Avenue
                                                                                                                                           11.   PWGSC or Transport Canada Contract No.
       Victoria, B.C.
       Canada V8V 3H3                                                                                                                            T8080-06-0263
 12.   Sponsoring Agency Name and Address                                                                                                  13.   Type of Publication and Period Covered

       Policy Research Branch                                                                                                                    Final
       Strategic Policy Directorate (Policy Group)
       Transport Canada, Tower C, Place de Ville                                                                                           14.   Project Officer

       330 Sparks Street, 28th Floor                                                                                                             Nick Strizzi
       Ottawa, Ontario K1A 0N5
 15.   Supplementary Notes (Funding programs, titles of related publications, etc.)

       Companion document:
       TP 14711E, Directory of Pacific Coast Container Ports, Terminals, and Services
 16.   Abstract

       This report provides an overview of expansion plans and issues at all the major container terminals along the
       Pacific Coast of North America. It includes a review of the major trends, forecasts of container trade and capacity
       to the year 2020, and a competitive analysis. It was prepared over the period November-December 2006 and is
       based on interviews with representatives of the major shipping companies, railways, container port authorities,
       terminal operators and other stakeholders.
       Key findings include the following:
       •      Planning is under way for a 53 percent increase in capacity.
       •      Increased trade and larger ships will create attractive expansion opportunities at Delta (BC) and inland.
       •      Containerized imports and exports for Canadian Pacific ports are forecast to grow conservatively to 5.6
              million TEUs per year by the year 2020.
       •      Terminals in Delta, Los Angeles (CA) and Long Beach (CA) are the current container market leaders.
       •      Overall the Pacific Coast ports’ plans match forecast growth in container traffic.

 17.   Key Words                                                                                         18.   Distribution Statement

       North American Pacific Coast ports, expansion plans,                                                    Available online at www.tc.gc.ca/pol/en/menu.htm
       container terminal, shipping

 19.   Security Classification (of this publication)                  20.   Security Classification (of this page)                  21.   Declassification         22.   No. of   23.     Price
                                                                                                                                          (date)                         Pages
       Unclassified                                                         Unclassified                                                        —                    viii, 62           Shipping/
                                                                                                                                                                                        Handling
CDT/TDC 79-005
Rev. 96
                                                                                                   iii
Transports         Transport
                   Canada             Canada                                                       FORMULE DE DONNÉES POUR PUBLICATION
 1.    No de la publication de Transports Canada                   2.    No de l’étude                                         3.    No de catalogue du destinataire

       TP 14710E
 4.    Titre et sous-titre                                                                                                     5.    Date de la publication

       Container Capacity Expansion Plans at Pacific Coast Ports                                                                     Janvier 2007
                                                                                                                               6.    No de document de l’organisme exécutant

 7.    Auteur(s)                                                                                                               8.    No de dossier - Transports Canada

       Helmut G. Burke
 9.    Nom et adresse de l’organisme exécutant                                                                                 10.   No de dossier - TPSGC

       Hanam Canada Corporation
       1165 Burdett Avenue
                                                                                                                               11.   No de contrat - TPSGC ou Transports Canada
       Victoria, B.C.
       Canada V8V 3H3                                                                                                                T8080-06-0263
 12.   Nom et adresse de l’organisme parrain                                                                                   13.   Genre de publication et période visée

       Direction de la recherche sur les politiques                                                                                  Final
       Direction générale des politiques stratégiques (Groupe des politiques)
       Transports Canada, Tour C, Place de Ville                                                                               14.   Agent de projet

       330, rue Sparks, 28e étage                                                                                                    Nick Strizzi
       Ottawa (Ontario) K1A 0N5
 15.   Remarques additionnelles (programmes de financement, titres de publications connexes, etc.)

       Document d’accompagnement :
       TP 14711E, Directory of Pacific Coast Container Ports, Terminals, and Services
 16.   Résumé

       Ce rapport donne une vue d’ensemble des plans d’expansion et des problèmes qui se posent dans tous les
       principaux terminaux à conteneurs situés le long de la côte du Pacifique de l’Amérique du Nord. On y trouve un
       examen des principales tendances, prévisions ainsi que du commerce et de la capacité en conteneurs jusqu’en
       l’an 2020, et une analyse concurrentielle. Ce rapport a été préparé entre novembre et décembre 2006 et il
       repose sur des entretiens avec des représentants des principales compagnies maritimes, des chemins de fer,
       des administrations des ports à conteneurs, des exploitants des terminaux et d’autres intervenants.
       Nos principales constatations sont les suivantes :
       •      On prévoit d’augmenter de 53 pour cent la capacité de ces ports.
       •      Une augmentation des échanges et des navires de plus grandes dimensions présenteront d’intéressantes
              possibilités d’agrandissement à Delta (C-B) et dans l’arrière-pays.
       •      On prévoit que les importations et les exportations conteneurisées dans les ports canadiens du Pacifique
              augmenteront à 5,6 millions d’EVP par an d’ici à l’an 2020.
       •      Les terminaux de Delta, Los Angeles (CA) et Long Beach (CA) sont actuellement les chefs de file du marché
              des conteneurs.
       •      Dans l’ensemble, les plans des ports de la côte du Pacifique cadrent avec la croissance prévue du trafic des
              conteneurs.

 17.   Mots clés                                                                                      18.   Diffusion

       Ports de la côte du Pacifique de l’Amérique du Nord,                                                 Disponible en ligne à www.tc.gc.ca/pol/en/menu.htm
       plans d’expansion, terminal à conteneurs, transports
       maritimes
 19.   Classification de sécurité (de cette publication)           20.   Classification de sécurité (de cette page)     21.   Déclassification      22.   Nombre         23.    Prix
                                                                                                                              (date)                      de pages
       Non classifiée                                                    Non classifiée                                             —                  viii, 62                  Port et
                                                                                                                                                                               manutention
CDT/TDC 79-005
Rev. 96
                                                                                             iv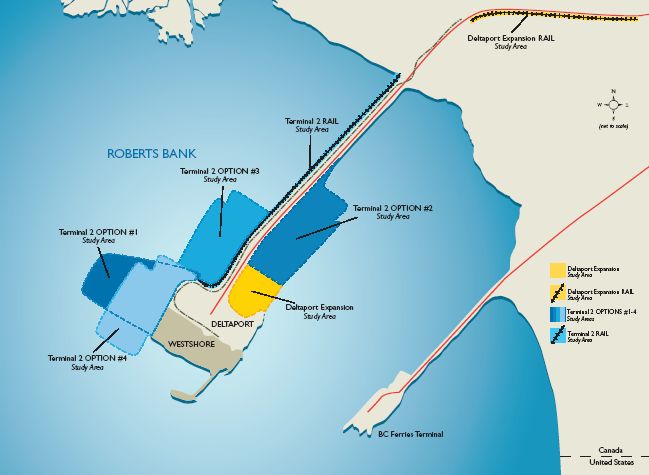
Container Capacity Expansion Plans at Pacific Coast Ports                                 Hanam Canada Corporation
January 2007

Contents
1.      INTRODUCTION .................................................................................................. 1
        1.1  Objectives ................................................................................................... 1
        1.2  Scope of report............................................................................................ 1

2.      ASIA-PACIFIC CONTAINER TRADE ................................................................ 2
        2.1   Asia-Pacific import growth ........................................................................ 2
        2.2   Canada’s containerized exports .................................................................. 7
        2.3   Shipping company consolidation................................................................ 8
        2.4   Larger and more productive terminals...................................................... 12
        2.5   Port related wetland restoration ................................................................ 15
        2.6   Implications of trends for British Columbia ............................................. 17

3.      PACIFIC CONTAINER TERMINAL PLANS & ISSUES ................................. 18
        3.1   Vancouver ................................................................................................. 21
        3.2   Delta and Surrey ....................................................................................... 26
        3.3   Prince Rupert ............................................................................................ 31
        3.4   Seattle, Tacoma and Portland ................................................................... 33
        3.5   Oakland ..................................................................................................... 36
        3.6   Long Beach and Los Angeles ................................................................... 38
        3.7   Manzanillo, Lazaro Cardenas, and Ensenada ........................................... 40
        3.8   Balboa (Panama)....................................................................................... 42

4.      ASSESSMENT OF COMBINED EXPANSION PLANS ................................... 44
        4.1  Container growth forecast......................................................................... 44
        4.2  Demand-capacity analysis ........................................................................ 47
        4.3  Container market share analysis ............................................................... 48
        4.4  Employment impacts of port expansion ................................................... 50
        4.5  Container terminal management ............................................................... 51
        4.6  Container terminal competitiveness.......................................................... 53

5.      FINANCING PORT EXPANSION PLANS ........................................................ 56
        5.1  Financial performance .............................................................................. 56
        5.2  Sources of port investments ...................................................................... 57

6.      CONCLUSIONS................................................................................................... 61

                                                          v
Container Capacity Expansion Plans at Pacific Coast Ports Hanam Canada Corporation
January 2007
List of Exhibits
Exhibit 1 Value of North American container trade 2006.......................................... 2
Exhibit 2 Top 15 container ports in Asia Pacific region 2005 ................................... 3
Exhibit 3 Containerized imports in North America 2006........................................... 5
Exhibit 4 Principal destinations of containers in 2005 ............................................... 6
Exhibit 5 Inbound, outbound and empty containers in North America..................... 7
Exhibit 6 Containerized exports from North America 2006 ...................................... 8
Exhibit 7 Shipping companies served by Pacific Coast ports .................................... 9
Exhibit 8 Shipping services or routes to BC ports in 2006 ...................................... 10
Exhibit 9 Trends in container ship sizes in 2006...................................................... 11
Exhibit 10 Productivity comparisons 2006................................................................. 13
Exhibit 11 Container storage capacity 2006............................................................... 15
Exhibit 12 Implications of Asia-Pacific container trends for BC............................... 17
Exhibit 13 Terminal operators and ports .................................................................... 19
Exhibit 14 Pacific coast container port expansion plans ............................................ 20
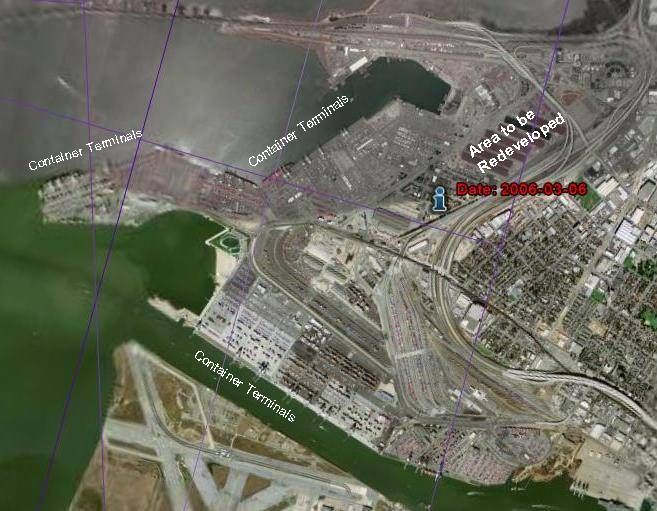
Exhibit 15 Map of Vancouver container terminals and railroads............................... 22
Exhibit 16 CP, CN and BNSF Rail Yards .................................................................. 22
Exhibit 17 CP Rail N Yard and nearby BNSF Barge Slip ........................................ 23
Exhibit 18 Map of Delta and Surrey terminals and railways...................................... 26
Exhibit 19 Deltaport 3rd Berth Project 2009 ............................................................... 28
Exhibit 20 Roberts Bank Terminal 2 .......................................................................... 29
Exhibit 21 Aerial photo of Seattle container terminals .............................................. 33
Exhibit 22 Port of Oakland Berth 21 Project.............................................................. 37
Exhibit 23 Graph of container freight growth by region ............................................ 44
Exhibit 24 Container freight volume and growth forecasts........................................ 46
Exhibit 25 Planned capacity and growth of container business ................................. 48
Exhibit 26 World and Pacific Coast container market size and share........................ 49
Exhibit 27 Port related employment 2005 .................................................................. 51
Exhibit 28 Terminal business dominance- % market share 2006............................... 52
Exhibit 29 Shipping prices per forty foot imported container.................................... 54
Exhibit 30 Financial results for Pacific coast ports in 2005 ....................................... 56
Exhibit 31 Sources of port investments ...................................................................... 58
viContainer Capacity Expansion Plans at Pacific Coast Ports Hanam Canada Corporation
January 2007
Executive Summary
This report provides an overview of expansion plans and issues at all the major container
terminals along the Pacific Coast of North America. It includes a review of the major
trends, forecasts of container trade and capacity to the year 2020, and a competitive
analysis. It was prepared over the period November to December 2006 based upon
interviews with representatives of the major shipping companies, railways, container port
authorities, terminal operators and other stakeholders. Our key findings are:
1. Planning is underway for a 53% increase in capacity.
The 12 ports and 14 operators of 37 container terminals in the study area plan 55
expansion projects to handle 22 million twenty foot equivalent units per year with an
investment of $6.8 billion.
2. Increased trade, larger ships will create attractive expansion opportunities at
Delta and inland
• Increasing Asia Pacific imports
• Increased containerization of Canada’s bulk exports
• Shipping companies are consolidating and using larger ships
• Terminals are becoming larger, more productive
• Leading ports are restoring wetlands
• Expansions at Roberts Bank will be fully utilized
• Increased opportunities for forest and agricultural products shipped in containers.
• Greater water depth, increased dock storage, and larger rail yards are needed.
• Rail overpasses near Deltaport would be useful.
• Small terminals face competitive challenges.
• There may be similar opportunities in Delta.
3. Containerized imports and exports for Canadian Pacific ports are forecast to
grow conservatively to 5.6 million TEUs per year by the year 2020
Canada’s Pacific Coast container terminals 1000 TEUs per year
IMPORTS EXPORTS EMPTIES TOTAL
Furniture & bedding 380 Pulp, paper & waste paper 290
Machinery & parts 180 Lumber & wood products 160
Toys, games & sports equip. 120 Agricultural crops 90
Home & building products 100 Metals & metal scrap 80
Electronic & electrical equip. 60 Pet & animal feed 70
Other 260 Other 180
Total 2006 1,100 870 330 2,300
2010 1,500 1,200 400 3,100
2020 2,700 2,300 600 5,600
viiContainer Capacity Expansion Plans at Pacific Coast Ports Hanam Canada Corporation
January 2007
4. Terminals in Delta, Los Angeles and Long Beach are the current container
market leaders.
• Highest productivity per terminal, berth and crane.
• California ports creating new wetlands, parks, and public waterfront access.
• Most efficient rail and truck access.
• Congestion mitigation policies- Reduced gate fees and bonuses in Los Angeles
and Long Beach encourage container transport and receiving during off-peak
hours.
• About 5 % lower local delivered costs- about $2,100 per 40-foot container.
• Information suggestions that Delta has the lowest delivered costs from Shanghai
to Chicago or Toronto- $3,600 per 40-foot container.
• Container export costs are competitive with traditional bulk shipments due to low
back-rates.
• Most competition between CN, CP, BNSF and UP Railways.
5. Overall the Pacific Coast ports’ plans match forecast growth in container traffic.
OVERALL PLANS 22 Million TEUs/year $6.8 Billion
CANADA PLANS
Deltaport Berth 3 0.6 Million TEUs/year $0.3 Billion
Roberts Bank Terminal 2 1.9 Million TEUs/year $0.9 Billion
Rail corridor Grade separations To be determined
6. Large new terminal expansions can be financed and likely will be constructed
• High lease rates are achievable from major shipping companies.
• Rail overpasses have been financed in the US with federal loan guarantees and
user fees of $30 per 40-foot container.
viiiContainer Capacity Expansion Plans at Pacific Coast Ports Hanam Canada Corporation
January 2007
1. INTRODUCTION
1.1 Objectives
This report was prepared for the Policy Research Branch of Transport Canada in
Ottawa. The objectives of this study were to:
• Determine the size and scale of planned expansion (in twenty foot equivalent
units or TEUs) at major Pacific container ports in Canada, the United States,
Mexico and Panama and to identify significant development issues.
• Provide detailed data and analysis of container ports for research, competitive
analysis, and monitoring to assist Transport Canada’s understanding of
market, infrastructure, port expansion, gateway and trade corridor issues.
1.2 Scope of report
We compiled a list of stakeholder groups and have included them in a separate
Directory of Pacific Coast Container Ports, Terminals and Services
(TP 14711E). The Directory includes contacts, detailed descriptions and
pictures of each port and terminal. We gathered information on overall
container trade and economic trends from published reports, port and
company websites. We interviewed representatives of 21 container shipping
lines calling on the Pacific coast and many of the terminal, railway and Port
representatives. We also obtained information from shippers, trans-load
facilities, container yard operators, trucking companies, freight forwarders,
and major labour unions.
We prepared a forecast of container shipments by port and by terminal to
2010 and 2020. We used data from our directory and an MS Excel model to
compare productivity, competitiveness, and analyze the corporate
relationships at all Pacific coast ports. We also compiled the public financial
statements of the US and Canadian ports and compared how container port
and infrastructure expansions are financed by jurisdiction.
Some of the market intelligence was provided by Clarkson Research Services
Ltd., London England. Founded in 1852, Clarkson is one of the world’s
largest shipping services groups through its network of 14 offices throughout
the world. Following the international norm, all values reported in this study
are in US dollars unless otherwise noted.
We gratefully acknowledge information and assistance received from Nick
Strizzi, Senior Economist, Strategic Policy, Policy Branch, Transport Canada,
Ottawa, who was the Project Manager and our primary contact for this project.
1Container Capacity Expansion Plans at Pacific Coast Ports Hanam Canada Corporation
January 2007
2. ASIA-PACIFIC CONTAINER TRADE
2.1 Asia-Pacific import growth
A dramatic increase in trade is shifting economic dominance to the Asia-Pacific
Region. Container shipping worldwide increased on average 10.4% per year
between 1995 and 2005 double the 5.4% rate of growth for the world economy as
a whole.1 The total value of container trade is about $ US 413 billion for the US,
$US 45 billion for Canada and $US 19 billion for Mexico as shown in Exhibit 1.
Containerized imports are growing at 9.4% per year and containerized exports are
growing at a rate of 7.0% per year for these three countries.
Exhibit 1 Value of North American container trade 2006
United States Canada Mexico Overall Growth
5 Year Trend
$ Billion $ Billion $ Billion %
Total exports 1,008 347 189 8.8
Container exports 161 20 5 7.0
% 16 6 3
Total imports 1,931 301 247 8.6
Container imports 252 25 14 9.4
% 13 8 6
Total Trade 2,929 648 436
Container Trade 413 45 11
% 14 7 3
Source: Clarkson Research Ltd.
Note: US dollars are used throughout this report except as noted.
The US, Canada and Mexico each import about five times more in dollar value
from China as they export. In 2004, the US imported $245 billion worth of goods
from China but sold China goods worth only $ 41 billion in return.2 In 2005,
Canada imported $30 billion worth of goods but exported only $7 billion to
China.3 The trade deficit is similar in Mexico, where imports in 2004 were $9.1
billion but exports were only $1.9 billion.
World port traffic is made up of 45% liquid bulk (oil, petroleum products,
chemicals), 23% dry bulk (coal, iron ore, grain, phosphate) and 32% general
cargo most of which is containerized.4 Global container traffic is distributed as
follows: Far East 45%, Europe 23%, North America 16%, Middle East 6%,
Central and South America 4%, and Africa, 3%. Containerization of trade goods
has progressed steadily over the past 20 years and is expected to continue.
1
Clarkson Research Ltd., Container Intelligence Quarterly, 4th Quarter 2006, London, UK.
2
William Hawkins, American Economic Alert, July 18, 2006 www.americaneconomicalert.org
3
CBC News, April, 3, 2006. www.cbc.ca
4
The World Bank Group, Ports & Logistics Overview, 2002.
www.worldbank.org/html/fpd/transport/ports_ss.htm
2Container Capacity Expansion Plans at Pacific Coast Ports Hanam Canada Corporation
January 2007
Worldwide 80% of general cargo is shipped in containers. In developed countries,
containerization of cargo approaches 100%. In the US about 13% of imports are
containerized, in Canada 8% and Mexico 6%.
Most of the recent growth in container traffic volume has been from Shanghai and
Shenzhen, China, as shown in Exhibit 2. Trade from more established suppliers
including Busan, Korea, Kaohsiung, Taiwan, and Tokyo, Japan also continues to
expand in both volume and value.
Exhibit 2 Top 15 container ports in Asia Pacific region 2005
Port Throughput 5 Year Growth
Million TEUs/year Trend %
1 Singapore 23.2 6
2 Hong Kong, China 22.4 4
3 Shanghai, China 18.1 26
4 Shenzhen, China 16.2 32
5 Busan, Korea 11.8 9
6 Kaohsiung, Taiwan 9.5 7
7 Qingdao, China 6.3 24
8 Klang, Malaysia 5.5 11
9 Ningbo, China 5.2 42
10 Tianjin, Korea 4.8 23
11 Pelepas, Malaysia 4.2 58
12 Laem Chebang, Thailand 3.8 12
13 Tokyo, Japan 3.6 4
14 Priok, Malaysia 3.2 7
15 Yokohama, Japan 2.9 4
Source: Clarkson Research Ltd.
The largest source of imports is the Asia-Pacific region, accounting for about a
third of all goods imported to the Pacific Coast. Five years ago, the main source
of imports was Japan but China now accounts for almost half of the imports and
Japan has declined to about one quarter. Of the 26 million TEUs handled on the
Pacific Coast in 2006, about two thirds originated from Hong Kong, Taiwan and
Mainland China.5 Most of the growth in container traffic has been from China.
Container shipments from Chinese ports are growing at a rate of 29% per year.
Four of China’s major ports Hong Kong, Shanghai, Shenzhen, and Qingdao now
each handle more than 20 million TEUs per year.6
Hong Kong and Shanghai are expanding to a capacity of over 30 million TEUs
per year. Shanghai is investing $12 billion and this expansion in China is one of
the major drivers for the Prince Rupert and Roberts Bank Terminal 2 container
expansion projects in BC. Phase One of the Yangshan deep-water port project in
Shanghai, completed last December, opened five berths adding 2.2 million TEUs
per year of container handling capacity.
Chinese containerized exports of manufactured goods are moving up the value
chain by absorbing foreign expertise and technology. For example, China is
5
Norman Stark, President, TSI Terminal Systems Inc., Port Days, Halifax, Sept. 27, 2005.
6
Chris Jones, Railway Association of Canada, Policy Options, Jan. 2006.
3Container Capacity Expansion Plans at Pacific Coast Ports Hanam Canada Corporation
January 2007
expected to gain Canadian and US market share especially in the auto parts
market. China has become an integral part of manufacturers’ global supply
chains. With the appreciation of the Canadian dollar, Canadian manufacturers
with high labor content in their products have experienced lower prices, sales, and
profit margins in their domestic markets and are struggling to remain competitive.
Ford Motor Co. recently announced it has doubled its purchases of Chinese made
auto components to $2.8 billion for 2007.7 Ford buys about $9 billion in parts in
the entire Asia-Pacific region about 10% of its total global parts purchases.
Daimler Chrysler expects to increase its Chinese parts imports from $0.1 billion
in 2006 to $0.8 billion in 2008. Average manufacturing jobs in China pay about
10% of an equivalent unionized manufacturing job in the US and so Chinese auto
parts are helping to reduce US auto manufacturing company losses. Most
automobiles imported from Asia are shipped in roll-on roll-off vessels but more
automobiles are now being shipped in containers, especially in Europe.
Other Asian cities are also contributing to growth in container shipments. Incheon
and Pusan, South Korea, are investing $8.8 billion in port capacity. Singapore is
building four new berths capable of an additional 2.0 million TEUs per year. A
similar expansion project is underway in Malaysia. Ho Chi Minh City began work
this year on a $250 million, 1.5 million TEUs per year terminal to begin operating
in 2008.8 India’s economy is also growing strongly and could double its container
trade to 10 million TEUs per year by 2010. Asia-Pacific container terminals are
being expanded more quickly and at much larger scale increments than North
American receiving terminals.
More than half of Canadian retail imports originate from the Asia-Pacific region.
Roughly 70,000 – half of Canada’s small merchants – import the majority of their
products from Asia.9 A breakdown of the principal commodities imported is
provided in Exhibit 3. Furniture and bedding account for more than one third of
containerized imports by volume. Machinery and parts including motorcycles
account for 16%, toys, games and sports equipment 11% and home & building
products, 9%.
7
Eugene Tang, San Francisco Chronicle, Oct. 27, 2006.
8
Wendy Leung, Vancouver Sun, June, 20, 2006.
9
Markus Gaertner, South China Morning Post, 29 July 2005.
http://www.skyscrapercity.com/printthread.php?t=145456
4Container Capacity Expansion Plans at Pacific Coast Ports Hanam Canada Corporation
January 2007
Exhibit 3 Containerized imports in North America 2006
Commodity China’s Import Value11 % By % By LA & Oak- Seatle & Van- Man-
10
Penetration $/TEU Value Volume Long land Tacoma couver zanillo
Canada % Beach Lazaro
1995 2005 1000 TEUs/year
Furniture & bedding 2 8 10,600 14 34 2,600 410 540 380 200
Machinery and parts NA NA 25,800 16 16 1,200 200 250 180 100
Toys, games & sports eq. 9 21 21,200 6 11 800 130 170 120 70
Home & building products - - 16,900 6 9 700 110 150 100 60
Electronic & electrical eq. 3 15 47,900 10 5 400 70 80 60 30
Textiles & clothing 8 31 46,100 7 4 300 50 60 40 20
Ceramic goods - - 10,700 2 4 300 40 60 40 20
Footwear - - 31,200 4 3 300 40 50 40 20
Food & beverage - - 30,000 3 3 200 30 40 30 20
Other - - 26,000 29 10 700 120 160 110 60
Total 100 100 7,500 1,200 1,560 1,100 600
Source: Calculated from port and Clarkson Research data
Canadian imports from China have more than doubled in the past 10 years and
import penetration measured as the value of imports from China divided by the
value of the domestic market is likely to grow. About three quarters of machinery
and parts used in Canada are imported and more of these are now containerized
and coming from Asia. China’s participation in some of the fastest growing areas
auto parts and home building products is relatively new. The products imported at
each port are fairly similar and consist mainly of consumer goods.
Furniture and bedding have a relatively low value per unit of container volume.
Electronic equipment, textiles and clothing tend to have the highest value. The
average value of a container of goods imported from China is about $26,000.12
Imports from Korea, Hong Kong and Singapore tend to be higher in value, about
$30,000 per container. Imports from Malaysia, the Phillipines, Indonesia, and
Thailand are mainly higher value clothing and specialty foods.
Some of the destinations of containerized goods are shown in Exhibit 4. About
60% of the imported containers handled in the Port of Vancouver are for
destinations outside of British Columbia.13 Walmart and Home Depot are the two
largest container importers in the US and Canada. More US importers are cargo
owners and some have master agreements that cover entire import regions. Their
high volume purchases allow them to reduce their overall shipping costs. The
Bay and Canadian Tire have direct contracts with shipping companies but most of
the smaller Canadian companies contract shipping through 6 major Canadian
freight forwarders including Schenker Logistics and Panelpina. More research is
needed to provide a clearer picture of the container importers and destinations.
10
Canada’s House of Commons Standing Committee on Industry, Science & Technology,
“Challenges Facing the Canadian Manufacturing Industry”, Ottawa, 2006.
11
Robert Leachman, University of California at Berkeley, “Port and Modal Elasticity Study”, 2005.
12
Clarkson Research Services, London, UK, Container Intelligence, Fourth Quarter 2006.
13
Lynne Olver, July 13, 2005. http://www.skyscrapercity.com/printthread.php?t=145456
5Container Capacity Expansion Plans at Pacific Coast Ports Hanam Canada Corporation
January 2007
Exhibit 4 Principal destinations of containers in 2005
United States Canada
1000TEUs 1000 TEUs
Estimate
Wal-Mart 695 70
Target 371 0
The Bay, Zellers, Home Outfitters 0 60
Home Depot 335 34
Sears & K-Mart 240 -
Canadian Tire 0 20
Lowes 163 0
Costco 160 16
LG Group 127 13
Ikea 100 10
Ashley Furniture 70 0
Sony 50 5
Payless Shoes 54 5
Samsung 53 5
Matsushita 52 5
Toyota 52 5
KB Toys includes Mattel 50 5
Nike 48 5
Can Retail Shippers, Sears, Sony Others 0 800
Schenker- The Brick, others 0 500
Panelpina 0 -
- indicates no data
Sources: Forbes, July 1, 2006,14 University of California Study, and shipping company
estimates
Large centralized ports with rail yards at the container terminals, more efficient
intermodal yards and large distribution warehouses throughout the US have made
rail shipping more efficient. In the past two years 4.5 million square meters of
warehouse space was added in the Los Angeles area, 3.2 million square meters in
Chicago, and 2.0 million square meters in Atlanta.15 With all six Class-One
railroads connecting to the region, Chicago is the United States’ busiest rail hub.
Other fast growing intermodal centers are Central, NJ, Houston and Dallas, TX,
Memphis, TN, Seattle, WA. and Miami, FL. CN Rail has invested $100 million
to establish a large new intermodal center in Memphis. Washington State’s Kent
Valley between the Ports of Seattle and Tacoma is experiencing rapid growth of
large new multi-functional facilities with cross docks for quick turnaround of full
containers as well as storage space for longer term inventory.
About half of the imports at Vancouver, Los Angeles and Oakland are for distant
markets and leave the ports by rail. In Seattle and Tacoma 70% of the containers
move by rail to Midwest US cities mainly Chicago and only about 30% of the
imports are for local markets. At Deltaport 55% of the containers leave by rail
14
Forbes, www.forbes.com/logistics/2006/07/01 quoting data from US Department of
Commerce Port Import and Export Reporting Service
www.piers.com/maritime/maritime_globalcontainerreport_purchase.asp
15
Cushman & Wakefield, “New Age of Trade”, New York, June 2006.
www.cushmanwakefield.com
6Container Capacity Expansion Plans at Pacific Coast Ports Hanam Canada Corporation
January 2007
whereas at Vanterm and Centerm only 43% leave by rail. In Mexico and Panama
almost all of the containers leave by rail to larger population centers.
2.2 Canada’s containerized exports
Canada’s western provinces have taken advantage of empty containers and low
return shipping rates by increasing the containerization of forest and agricultural
products. For example, CN recently opened a $4 million plant in Edmonton to
load specialty grains and other crops such as lentils, beans, peas, malt, and alfalfa
pellets into containers.16 Fewer containers from Canada return empty as compared
to the US as shown in Exhibit 5. Only 14% of the containers passing through
Vancouver are empty compared with 29% for the Pacific Coast as a whole.
Exhibit 5 Inbound, outbound and empty containers in
North America
Inbound Outbound Empty Total
Delta, Vancouver & Surrey % 48 38 14 100
Seattle & Tacoma 48 26 26 100
Portland 58 22 20 100
Los Angeles & Long Beach 49 20 31 100
Ensenada 59 21 20 100
Manzanillo & Lazaro 47 33 20 100
Pacific Coast 49 22 29 100
Source: Port Websites 2006
The principal containerized exports from Pacific Coast ports are pulp, paper and
waste paper, agricultural products, metals and metal scrap as shown in Exhibit 6.
These three categories make up more than 80% of the export volume. Paper
products including waste paper are the leading containerized exports from the
Port of Los Angeles. In Vancouver, pulp and paper are also the leading
containerized exports followed by lumber and other wood products. A growth
area for Canada is specialty grains. Increasingly customers prefer to know the
origin of their food grains rather than buying them in bulk. The shipping time
from the farm to the customer for Canadian wheat is about 21 days in containers
compared with the average of 97 days for bulk shipments.17 Crops such as
sunflower seeds, hops, beans, peas and lentils are almost all containerized
whereas they used to be shipped in bulk.
16
CN Rail, News Release, Nov. 16, 2006. www.cn.ca
17
Kimberly Vachal, North Dakota State University & Heidi Reichert, US Department of
Agriculture, “Identity Preserved Grain, Logistical Overview” Jan 27, 2003.
www.farmfoundation.org
7Container Capacity Expansion Plans at Pacific Coast Ports Hanam Canada Corporation
January 2007
Exhibit 6 Containerized exports from North America 2006
Commodity Value % By % By LA & LB Oakland Seattle & Van- Manzanillo
$/TEU Value Volume Tacoma couver & Lazaro
1000 TEUs/year
Pulp, paper & waste paper 20,800 24 35 700 120 240 290 0
Agricultural crops 30,000 21 22 580 90 150 90 300
Metals & metal scrap 18,000 15 25 520 90 150 80 0
Pet & animal feed 20,000 11 16 370 60 100 70 0
Machinery & equipment 25,800 4 5 160 30 30 40 0
Food, drinks, meat & fish 40,000 6 5 150 30 30 50 100
Lumber & wood products 30,000 5 5 50 20 34 160 0
Textiles, fabric & yarn 46,100 4 2 200 10 0 0 0
Electronic & science eq. 47,900 1 0 0 0 30 0 0
Other 26,000 10 11 340 40 60 90 20
Total 100 100 3,070 490 840 870 420
Source: Calculated from port data
Another trend is the trans-loading of bulk grains such as wheat and barley into
containers. For example, WestNav Container Services, near Fraser Surrey Docks,
unloads bulk grain rail cars into containers. The back haul container shipping
rates are competitive with bulk shipping rates because shipping companies need
to bring the containers back to their origin. About 26 tonnes of wheat or peas, and
23 tonnes of barley fit in a 40 foot long container. Importers increasingly prefer
the convenience of container deliveries.
Columbia Containers and Coastal Containers near Vanterm, receive malt by
hopper cars and load it into containers for export to Japan. Similarly lumber is
stuffed into shipping containers by companies such as Coast 2000, Westrans, and
Lynnterm for shipments to Asia. Coast 2000, Richmond, one of the largest
container handling and stuffing companies stuffed 25,000 40 foot containers this
year and is budgeting for a 60% increase next year. Smelter products such as
nickel are also stuffed into containers in Richmond for export to Asia.
2.3 Shipping company consolidation
Representatives of the 21 major container ship operators serving the Pacific Coast
listed in Exhibit 7 were interviewed to determine trends and priorities. There are
96 service routes, 621 vessels, and 2.6 million TEUs of capacity now serving the
Transpacific container trade. All of the companies are international in scope and
almost all operate in both Canada and the US. The main lines serving the Pacific
Coast are based in Denmark, China, Japan, Taiwan, Korea and Singapore.
8Container Capacity Expansion Plans at Pacific Coast Ports Hanam Canada Corporation
January 2007
Exhibit 7 Shipping companies served by Pacific Coast ports
Alliances Head Office World Ship Size 1000sTEUs Trans
Ships Average Post Pacific
1000 TEUs Panamax 1000
TEUs Capacity TEUs
2006 2006 2011 2006
CKYH Cosco China 384 2,006 165
K-Line Japan 264 3,919 165
Hanjin Korea 353 3,604 89
Yang Ming China 221 3,172 128
Subtotal 8,200
New World APL (NOL Group) Singapore 337 3,448 92
Mitsui OSK Japan 283 3,819 151
Hyundai MM Korea 165 148
Subtotal 5,800
Grand Nippon Kusen (NYK) Japan 320 3,094 202
Orient Overseas (OOCL) Hong Kong 278 4,990 147
Hapag-Lloyd Germany 446 3,749 96
Subtotal 5,600
Maersk Maersk (Denmark) Denmark 1,761 4,111 797 4,200
CPN Evergreen (incl. Hatsu) Taiwan 536 3,275 208 3,100
CMA CGM France 650 3,590 149 2,000
China Shipping China 381 3,283 134 2,000
Zim Israel 233 3,366 600
Mediteranean Shipping Switzerland 947 3,300 241 560
Hamburg Sud Germany 203 3,307 89 360
Wan Hai Taiwan 115 1,817 280
CSAV-Norasia Chile 200
Pacific Int’l Lines (PIL) Singapore 137 1,261 200
Maruba Argentina 100
Other 1,596 1,100
Total 4,583
Total all sizes 11,200 12,386 34,300
Source: Clarkson Research Services, 2006
In late 2006, most shipping companies were losing money. Shipping rates have
declined whereas costs for fuel, security and labor have gone up. Except for K-
Line and Hanjin, whose share price stayed level, 19 other major public shipping
companies have seen a decline in their share prices in 2006.18 Share prices for
most shipping companies quadrupled from 2002 to 2005 but for the first three
quarters of 2006 fell by an average 23%. However some companies have seen
improved share prices during the last quarter of 2006.
Time charter rates declined this year by 7.4% to $31,500 per day for a 4,400 TEU
ship but now seem stable. Worldwide, some shipping companies are willing to
expand service routes and their representatives continue to hold a positive view of
demand growth. Average revenues per container shipped increased by 18% from
2001 to 2005 but fell 7.5% in 2006. The most dramatic declines were in the
European service routes out of China. The Trans-Pacific service routes did not
decline as quickly but are on a gradual downward price trend.
18
Clarkson Research Services, London, UK Container Intelligence Quarterly, 4th Quarter, 2006.
9Container Capacity Expansion Plans at Pacific Coast Ports Hanam Canada Corporation
January 2007
Most company representatives said their container shipping growth in Canada is
limited mainly by rail space allocations. Their annual growth estimates for the
next three years ranged from a 4% decline to 12% growth. The biggest companies
expect the highest growth. Companies serving Europe and Latin America forecast
the least growth. The forecast average growth for the next three years weighted by
the volume of business is 7.9% and 6% beyond 2010.
Container ship operators said their two most important service priorities are:
schedule reliability and freight rate.19 To maintain reliable frequent schedules
shipping companies have organized their services into routes between the various
ports. Different ships within the various shipping alliances can meet the trade
requirements on a particular route. Some route names are indicated by the letters
in the left column of Exhibit 8. The main services or routes provide regular
shipments of goods for the major suppliers and customers. Each shipping service
calls at the same ports at a predictable date and time. Service routes are changed
only with input from all Alliance partners, freight forwarders and major customers
For example at Deltaport, Evergreen Shipping provides 3 regular service routes.
The New Grand Alliance and the CKHY alliance provide 4 regular service routes
to Vanterm. This use of regular routes is one reason why small ports have not
succeeded in attracting container ships. There is not enough business at a small
port to get all members to agree to a new stop.
Exhibit 8 Shipping services or routes to BC ports in 2006
Service or Route Name Alliance Shipping Company
Deltaport
WAE - Evergreen, Maersk
CPN - Evergreen, CMA-CGM,
TPS - Evergreen
- - ZIM
- - CMA-CGM, CSAV-Norasia
Vanterm
JCX New Grand NYK, OOCL, Hapag, Lloyd
PNW CKYH Cosco, K-Line, Yang Ming, Hanjin
HPNX CKYH Hanjin, K-Line, Cosco, Yang Ming
KPNW CKYH K-Line, Yang Ming, Hanjin, Cosco
Centerm
New World APL, MOL, Hyundai
Fraser Surrey Maruba, Hamburg Sud
Source: Terminal brochures
Shipping alliances have most of the shipping berth time and rail capacity booked
in advance. Therefore with high demand for terminal capacity, it is difficult for a
new entrant to get service at Deltaport. Vessels may be delayed due to weather,
pilotage, tug, berth, and crane availability and each delay can affect cumulative
port time and costs. Upsets at one terminal affect the schedule at the other
terminals on the route. For example, Deltaport berths have an occupancy rate of
19
John Vickerman, TranSystems Inc., Norfolk, Virginia “Emerging Canadian Port & Intermodal
Opportunities: A Capacity Assessment” 2006.
10Container Capacity Expansion Plans at Pacific Coast Ports Hanam Canada Corporation
January 2007
75% and only a two-day window for ship arrival times. If there are problems at
one port on the route, there may be costly waits at the following ports.
Shipping companies are using increasingly sophisticated Internet accessible
computer tracking of shipments from the point of origin to the final destination.
Paperless trading systems such as “Bolero” are used to monitor and reduce the
time containers spend at terminals thus increasing capacity.
To maintain competitive freight rates shipping companies are using larger
container ships. The average size of fully cellular container ships is now 4,113
TEUs, up about 5% on 2005 and 16% larger than vessels in 2001 as shown in
Exhibit 9.20 Ships that just fit through the Panama Canal are called Panamax
vessels. But now many of the bigger ships do not fit through the canal. For the
Transpacific trade, there are 105 Panamax and 65 Post-Panamax vessels on order
for 2007 and 2008.21 Post Panamax vessels with an average size of 6,416 TEUs
now make up about one third of the entire containership fleet capacity.
Exhibit 9 Trends in container ship sizes in 2006
Type TEUs World Growth % Transpacific
Trade Pacific
Average Average
Size Size
FeederContainer Capacity Expansion Plans at Pacific Coast Ports Hanam Canada Corporation
January 2007
TEUs ship is 46 by 325 meters. It is expected that ships of 12,000 TEUs capacity
53 by 400 meters and 15 meters draft will be common by 2015. This is the limit
of the Suez Canal and proposed Panama canal expansion.
The trend to larger ships is shifting trade to larger, deeper draft ports with ample
container storage space, rail yard, and warehouse capacity.23 The average vessel
size at Deltaport is forecast to increase from 4,065 TEUs in 2003 to 4,650 TEUs
by 2012 with the largest ships about 10,000 TEUs. 24 The ships calling on Fraser
Surrey Docks, with shallower draft restrictions are smaller, between 1,500 to
2,500 TEUs.
2.4 Larger and more productive terminals
There is a trend towards centralizing of container business in fewer larger
terminals with higher quality service, better productivity, and lower costs. In Los
Angeles and Long Beach several adjacent terminals are being combined into
several larger ones. It is recognized that ocean shipping and rail transportation
can be just as important in the productivity of the overall supply chain. For
example, the most productive terminals handle the largest container ships.
The ports’ container terminals are ranked by several productivity indicators in
Exhibit 10. The values shown are averages for a port but the newest terminals
such as Hanjin, Long Beach, APM, Los Angeles and APL, Oakland are more
productive than the average. Deltaport, Los Angeles and Long Beach have the
most through put per terminal, berth and crane. They have the most on dock
space, the best rail access, and most convenient hours of service. The lower
ranking terminals Ensenada, Portland and Surrey are vulnerable to competition.
Tacoma, Oakland and Lazaro Cardenas’ low productivity is partly due to recent
expansions and excess capacity and may be temporary.
23
Mongelluzo, Bill, Landslide Lagjam: New Generation of big ships will force ports, railroads to
change operations, Journal of Commerce, Feb. 28, 2005.
24
Vancouver Port Authority, Environmental Assessment Application for the Deltaport Third
Berth Project, January, 2005. http://www.eao.gov.bc.ca
12Container Capacity Expansion Plans at Pacific Coast Ports Hanam Canada Corporation
January 2007
Exhibit 10 Productivity comparisons 2006
1000TEUs/ 1000TEUs/ 1000TEUs/ 1000TEUs/ Hours Lifts Useful
y y y y / / Excess
Terminal Berth Crane Hectare Year Hou Capacit
r y
1 Delta 1,078 539 180 17 3,188 24 0.2
2 Los Angeles 1,169 273 106 12 6,096 23 0.8
3 Long Beach 896 184 80 12 6,096 25 1.2
4 Balboa 500 250 167 59 8,760 0.2
5 Manzanillo 450 225 113 38 8,592 0.4
6 Seattle 556 185 72 9 2,146 22 0.2
7 Vancouver 504 252 92 17 3,188 19 0.4
8 Lazaro 375 375 188 25 8,760 0.1
9 Oakland 347 128 76 9 2,322 23 1.0
10 Tacoma 310 172 65 7 2,045 25 1.5
11 Surrey 200 100 50 7 2,250 0
12 Portland 196 65 28 4 2,146 0
13 Ensenada 109 109 27 8 8,760 0
Average 657 276 121 12 3,650 6.0
Source: Calculated from Port data
At most terminals, container ships are serviced 24 hours per day 7 days a week
and rail cars are also loaded and unloaded continuously. Shipping companies rate
the railroad efficiency by the number of days a container spends on the dock, an
average of 3 days at Deltaport and 4 days at Vancouver terminals. However
sometimes containers stay at Vanterm for 10 to 16 days because of space
constraints or the lack of allocations for space on CP Rail cars. For example a
terminal operator may notice a shipping line is bringing in 200 containers on a
ship but their rail allotment is only 100 cars. Sometimes they have left the extra
containers on board. But if the company stores them, they may get left for a week
or more until the shipping line is allotted space on the train to take them away.
Truck pick-up and deliveries are made only during posted gate hours or by
reservation after the posted times. Some truckers and lumber exporters
complained they must book two days ahead to get appointments. When larger
ships are unloaded sometimes the in-bound lanes and truck reservations are
closed. Deltaport achieves about 1,150 gate transactions per day; Vanterm, about
1,000; and Centerm about 550. The average wait time for truckers at all three
terminals is about the same, two hours. One container yard operator reported that
they currently need 60 trucks to handle a volume of 100 containers per day where
previously they needed only 25 due to increased waits at the terminal and more
traffic congestion. Trucking representatives stated that a reasonable wait time
would be one hour and a proposed engineering standard is thirty minutes.25
The largest terminals in Los Angeles and Long Beach compete to reduce unit
costs and improve throughput capacity and service. For example, 500 truckers
who serve these two ports are regularly surveyed about terminal quality and
service. APL’s, Los Angeles container terminal has repeatedly won the award
25
Michael Ircha, University of New Brunswick, Oct. 24, 2005 Atlantic Institute For Market
Studies. www.aims.ca
13Container Capacity Expansion Plans at Pacific Coast Ports Hanam Canada Corporation
January 2007
“Fastest and Best Overall Marine Terminal”. Speed is determined by the amount
of time truckers spend at the terminal discharging one container and collecting
another. The overall rating includes variables such as professionalism, courtesy,
competence, and the quality of container handling equipment.26
In Los Angeles and Long Beach the PierPass not-for-profit company was created
to reduce congestion and improve air quality by offering night and weekend gate
openings. Of the truck drivers surveyed most, 71% reported reduced traffic on the
freeways and roads leading to the terminals, and 43% confirmed they were
making more trips per shift.27 Off peak night hours are 6 PM to 3 AM, Monday
through Thursday and 8 AM to 6 PM on Saturday. A fee on daytime traffic paid
in advance by the shipper provides the financial incentive to use off peak hours.
Shipping companies typically compare labour productivity by the lifts per crane
per hour. Delta achieves 24 lifts per crane per hour comparable to Los Angeles
whereas the Vancouver ports achieve about 19. Japanese ports operate at about
35 lifts per hour.28 In Vancouver and Delta, workers are represented by
International Longshore Workers Union. Members will handle containers at any
time provided they are given 24 hours notice. However the terminal operators do
not see enough business during afternoon and night shifts. Although the
Vancouver and Delta terminals have been open Tuesday, Wednesday and
Thursday evening for the past two months, truckers’ representatives report they
are not getting enough loads on the afternoon shift to pay for their costs.
Trucking company representatives suggested some of the following reasons for
this lower productivity during the afternoon:
• Export customers are not set up to handle containers during the afternoon shift
so trucker can not get a container to take back to the terminal.
• Labour contracts at some warehouses may not include afternoon openings.
• Truckers need to pick up an extra chassis to get an import container since the
other chassis has been left at the delivery point.
• Shorter shift from 5 PM to midnight and a ½ to 1 hour transition time at
terminal shift change when truckers can not get service.
• Container storage yards not open. Coast 2000 is open till 9 PM and Delco to 8
PM but the rest are closed.
• Shipping company offices are closed at night.
The available storage space at a terminal and off-site is a major factor in terminal
productivity. At present companies get 4 days free container storage at Vanterm
and Deltaport and 5 days at Centerm. After that they have to pay $200 per day for
storage. Some storage company representatives suggested the free time could be
26
APL Press Release, March 15, 2006. www.apl.com
27
Richard Steinke, Port of Long Beach, August, 2006.
http://www.pierpass.org/press_room/releases/?id=38
28
John Vickerman, Transystems, Norfolk, VA, Canada Asia Maritime Conference Notes, 2006.
14Container Capacity Expansion Plans at Pacific Coast Ports Hanam Canada Corporation
January 2007
reduced to 2 days. Some container terminals are trying to improve the stacking
density of their terminals by using more rubber tired gantry cranes. Conversely,
others maintain more ground storage making it easier for truckers to pick up
containers. The storage density at a few Pacific Coast container terminals is
compared in Exhibit 11. Stacked three high without space in between, the
maximum would be 2,040 TEUs per acre. The actual storage is about a quarter of
this maximum.
Exhibit 11 Container storage capacity 2006
Hectares Storage Storage TEUs/
Grounded Total Hectare
TEUs TEUs
Cal United, Long Beach 38 14,400 43,200 1,135
Seaside, Oakland 23 5,898 17,694 762
Hutchison, Ensenada, Mexico 13 6,500 507
Pacific Container, Long Beach 102 15,317 45,951 450
SSAT, Long Beach (Matson) 28 4,000 12,000 427
Centerm, Vancouver 29 12,000 410
TSI, Delta 64 24,000 375
SSAT Long Beach 68 24,000 352
APM Terminals, Tacoma 54 4,700 14,100 260
Terminal 6, Portland 80 7,700 97
Source: Terminal brochures and port websites
2.5 Port related wetland restoration
The leading US ports, Los Angeles, Long Beach, Oakland and Tacoma have been
proactive in providing wetland habitat compensation to gain support for port
development. For Port of Oakland expansions, US Federal government agencies
played a leading role in projects to provide public amenities, restore waterfowl
and wildlife habitat throughout the Bay area. The Bay Conservation and
Development Commission helped to open 320 kilometers of shoreline to the
public while retaining mudflats and restoring degraded marshes. The San
Francisco Bay National Wildlife Refuge and the San Pablo Bay National Wildlife
Refuge were established to further protect the Bay.
Oakland’s harbour-deepening project included 100% beneficial reuse of dredge
material for restoration of Bay area wetlands, the creation of a new waterfront
park, and increased public access to the shoreline. State law requires ships to
exchange ballast water at sea in order to prevent foreign organisms from
contaminating San Francisco Bay. The Port of Oakland has developed and
implemented a storm water pollution prevention program that goes beyond the
minimum requirements of regulations.
The Port of Los Angeles has also been proactive in wetlands restoration. In 1996,
a 40 hectare project was completed at a cost of $57 million to restore halibut and
sea bass habitat. Several threatened and endangered bird species are nesting in
record numbers and shorebirds are feeding on the newly created mud flats. These
15Container Capacity Expansion Plans at Pacific Coast Ports Hanam Canada Corporation
January 2007
projects have received enthusiastic public support. The Port of Long Beach
through agreements with the U.S. Fish and Wildlife Service and other natural
resource agencies, acquires and restores coastal wetlands in Southern California
in exchange for the right to develop Port property. Tacoma has also completed
habitat restoration projects with each of their terminal construction projects.
To reduce air emissions, the Port of Long Beach has a program underway to
convert to shore based electrical power and a 15% reduced dockage rate if ships
travel at less than 12 knots within 20 miles of the coast.29 Ship generators must
use fuel with less than 0.2% sulfur. The Port of Los Angeles has attached a “no
net emission increase standard” to its expansion plans.30
In Mexico, the Instituto Nacional del Ecologia is responsible for environmental
issues including the major container port expansion at the Balsas River estuary in
Lazaro Cardenas. Industrial development has been kept on the north arm of the
estuary whereas the south arm of the river remains relatively natural.
In Canada, the Fraser River Estuary Management Program is a partnership of
governments and port authorities to protect the estuary. The budget is $356,000
per year with all partners contributing $45,000 per year.31 The Greater Vancouver
Regional District has developed a biodiversity strategy for the region including
the vicinity of Roberts Bank.32 It has been suggested that land and covenants
could be purchased on Brunswick Point and Westham Island for about $60,000
per hectare33 Groups such as the Pacific Estuary Conservation Program have
already purchased 300 hectares of land in Delta and some purchases allow
continued farming while protecting bird habitat.34 Transport Canada, provided
$6.0 million for habitat acquisition and a $3.0 million endowment to compensate
for the expansion of the Vancouver airport in 1995.35
29
Port of Long Beach http://www.polb.com/environmen/air_quality/vessels/default.asp
30
Port of Los Angeles. Working Draft: No Net Increase Strategy with Preliminary
Recommendations Subject to Legal and Economic Review. March 15, 2005.
http://www.portoflosangeles.org/DOC/NNI_Strategy_March_2005.pdf
31
Anna Mathewson, Manager FREMP & BIEAP, Burnaby, BC Dec. 29, 2006.
32
Greater Vancouver Regional District, Biodiversity Conservation Strategy Workshop, July 13,
2006 www.gvrd.bc.ca/growth/biodiversity/
33
Ken Brock, Head of Habitat, Canadian Wildlife Service, Environment Canada, Jan. 2, 2006
34
Stephen Leahy, Conservator, Deal in Delta, March 26, 2005
www.ducks.ca/about/duc/news/conservator/263/delta.pdf
35
Theresa Duynstee, Policy & Planning, Regional Biodiversity Strategy, Greater Vancouver
Regional District, Vancouver, Dec. 29, 2006.
16You can also read