Investor Presentation - April 2017 - Centerview Capital
←
→
Page content transcription
If your browser does not render page correctly, please read the page content below
Investor Presentation
April 2017
Disclaimer
About this Presentation
This presentation contemplates the purchase by Conyers Park Acquisition Corp. (the “Company”) of Atkins Nutritionals, Inc. (“Atkins”) which is contemplated to involve a series of mergers by which Atkins
and the Company will become subsidiaries of The Simply Good Foods Company (“Simply Good Foods”).
No Offer or Solicitation
This announcement is for informational purposes only and is neither an offer to purchase, nor a solicitation of an offer to sell, subscribe for or buy any securities or the solicitation of any vote in any
jurisdiction pursuant to the proposed transactions or otherwise, nor shall there be any sale, issuance or transfer or securities in any jurisdiction in contravention of applicable law. No offer of securities shall
be made except by means of a prospectus meeting the requirements of Section 10 of the Securities Act of 1933, as amended.
Forward Looking Statements
This presentation includes “forward-looking statements” including project financial information regarding the Company, Atkins, and The Simply Good Foods Company that reflect current views and
information currently available. This information is, where applicable, based on estimates, assumptions and analysis that the Company, Atkins, and Simply Good Foods believe, as of the date hereof, provide a
reasonable basis for the information contained herein. Forward-looking statements can generally be identified by the use of forward-looking words such as “may”, “will”, “would”, “could”, “expect”, “intend”,
“plan”, “aim”, “estimate”, “target”, “anticipate”, “believe”, “continue”, “objectives”, “outlook”, “guidance” or other similar words, and include statements regarding the plans, strategies, objectives, targets and
expected financial performance. These forward-looking statements involve known and unknown risks, uncertainties and other factors, many of which are outside the control of the Company, Atkins, and
Simply Good Foods and their officers, employees, agents or associates. Actual results, performance or achievements may differ materially and potentially adversely from any projections and forward-looking
statements and the assumptions on which those forward-looking statements are based. There can be no assurance that the data contained herein is reflective of future performance to any degree. Readers
are cautioned not to place undue reliance on forward-looking statements as a predictor of future performance as projected financial information, cost savings, synergies and other information are based on
estimates and assumptions that are inherently subject to various significant risks, uncertainties and other factors, many of which are beyond our control. All information herein speaks only as of (1) the date
hereof, in the case of information about the Company, or (2) the date of such information, in the case of information from persons other than the Company. None of the Company, Atkins, or Simply Good
Foods undertakes no duty to update or revise the information contained herein, publicly or otherwise. Forecasts and estimates regarding the industry are based on sources we believe to be reliable, however
there can be no assurance these forecasts and estimates will prove accurate in whole or in part.
Non-GAAP Financial Measures
This presentation includes certain financial measures not presented in accordance with generally accepted accounting principles (“GAAP”) including, but not limited to, EBITDA (Earnings before interest,
taxes, depreciation and amortization), Adjusted EBITDA and certain ratios and other metrics derived there from. These non-GAAP financial measures are not measures of financial performance in
accordance with GAAP and may exclude items that are significant in understanding and assessing financial results. Therefore, these measures should not be considered in isolation or as an alternative to net
income, cash flows from operations or other measures of profitability, liquidity or performance under GAAP. You should be aware that the presentation of these measures may not be comparable to
similarly-titled measures used by other companies.
A reconciliation of Adjusted EBITDA to Net Income, the nearest GAAP measure, is set forth on page 38. The Company, Atkins, and Simply Good Foods believe (i) these non-GAAP measures of financial
results provide useful information to management and investors regarding certain financial and business trends relating to the financial condition and results of operations of Atkins Nutritionals; and (ii) that
the use of these non-GAAP financial measures provides an additional tool for investors to use in evaluating ongoing operating results and trends in and in comparing financial measures with other similar
companies, many of which present similar non-GAAP financial measures to investors. These non-GAAP financial measures are subject to inherent limitations as they reflect the exercise of judgments by
management about which expense and income are excluded or included in determining these non-GAAP financial measures.
Use of Projections
This presentation contains financial forecasts with respect to projected financial results, including Net Sales and Adjusted EBITDA. Independent auditors have not audited, reviewed, compiled or performed
any procedures with respect to the projections for the purpose of their inclusion in this presentation, and accordingly, they did not express an opinion or provide any other form of assurance with respect
thereto for the purpose of this presentation. These projections should not be relied upon as being necessarily indicative of future results. The assumptions and estimates underlying the prospective financial
information are inherently uncertain and are subject to a wide variety of significant business, economic and competitive risks and uncertainties that could cause actual results to differ materially from those
contained in the prospective financial information. Accordingly, there can be no assurance that the prospective results are indicative of the future performance of the combined company or that actual results
will not differ materially from those presented in the prospective financial information. Inclusion of the prospective financial information in this presentation should not be regarded as a representation by any
person that the results contained in the prospective financial information will be achieved.
Third Party Marks
All rights in third party marks are owned by third parties and such marks and related marks are used herein merely for information purposes. The parties claim no rights in or to such marks and related
marks, nor any endorsement or approval or any message herein by such third parties.
Participants in the Solicitation
Atkins Nutritional, Conyers Park, and Simply Good Foods and their respective directors and executive officers may be deemed to be participants in the solicitation of proxies from Conyers Park’s
shareholders in connection with the proposed business combination. Information about Conyers Park’s directors and executive officers is set forth in Conyers Park’s Annual Report on Form 10-K for the
fiscal year ended December 31, 2016, which was filed with the SEC on March 31, 2017. These documents are available free of charge at the SEC’s web site at www.sec.gov. Information regarding the persons
who may, under SEC rules, be deemed participants in the solicitation of proxies to Conyers Park’s shareholders in connection with the proposed business combination will be set forth in the registration
statement for the proposed business combination when available. Additional information regarding the interests of participants in the solicitation of proxies in connection with the proposed business                  1
combination will be included in the registration statement that Conyers Park and Atkins intend to cause the Simply Good Foods to file with the SEC.
Today’s Participants
Conyers Park Atkins Nutritionals
Jim Kilts Dave West Brian Ratzan Joe Scalzo Shaun Mara
Executive Chief Executive Chief Financial Chief Executive Chief Financial
Chairman Officer Officer Officer Officer
Founded Centerview Joined Centerview Joined Centerview Joined Atkins Joined Atkins
Capital in 2006 Capital as a partner in Capital as a partner in Nutritionals in 2013 Nutritionals in 2014
Former Vice Chairman 2016 2014 Formerly President Formerly CFO of
of Procter & Gamble Former CEO and Previously Head of and COO of Dean Dean Foods
Former Chairman, President of Big Heart U.S. Private Equity at Foods (led Previous senior finance
CEO and President of Pet Brands (fka Del Pamplona Capital transformation of positions at Wrigley
The Gillette Company Monte Corporation) Management and Head WhiteWave) and The Gillette
Former CEO and of the Consumer Previous senior Company
Former CEO and Group at Vestar
President of Nabisco President of The management positions Prior experience also
Hershey Company Capital at The Gillette
Former head of Kraft includes Staples and
Previous senior 20 years of private Company, Coca-Cola KPMG
Foods and General equity experience and P&G
Foods (Worldwide Food management positions
Group at Philip Morris) at Nabisco and Kraft B.A. from University of B.S. from University of
Foods Michigan, MBA from Notre Dame
B.A. from Knox Harvard Business
College, MBA from B.S. from Bucknell
University School
University of Chicago
2
Today’s Agenda

1.   Key Messages / Introduction

2.   Atkins Nutritionals Business Overview

3.   Atkins Nutritionals Growth Strategy

4.   Atkins Nutritionals Financial Overview

5.   Atkins Nutritionals Transaction Details

                                               3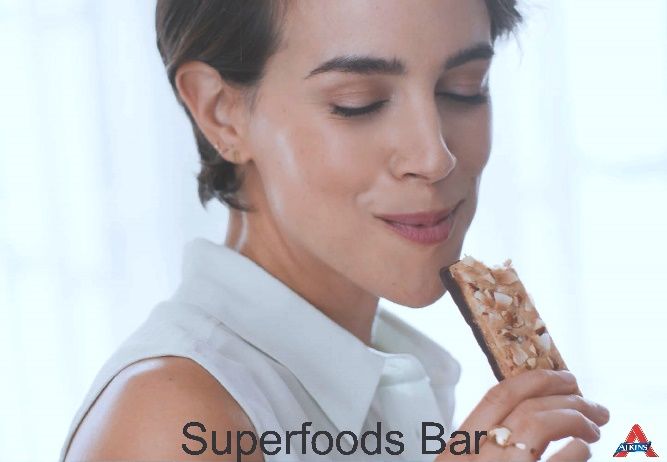
Key Messages / Introduction
                     Section 1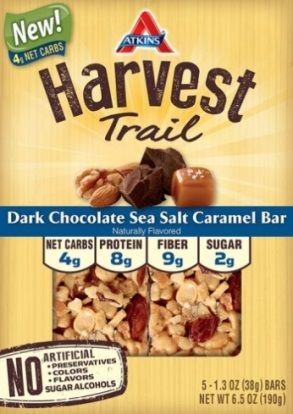
Situation Overview
Conyers Park was formed to create an attractive, scale player in the CPG space we have
found the first piece and will review it with you today
Atkins Nutritionals (“Atkins”) is a leading developer, marketer and seller of branded
nutritional foods and snacking products
– The Company sells nutrition bars, ready-to-drink shakes, snacks and other confectionary products
– Calendar year 2017E net sales and EBITDA of $411mm and $74mm, respectively(1)
Atkins is an attractive asset for Conyers Park
– $600mm brand at retail(2) consistent with our history of growing large brands in a public company
setting
– Tailwind trends of snacking, convenience, meal replacement and health & wellness
We are confident in our ability to add value to the business
– Conyers Park along with Atkins’ management team will “run our playbook” continue to grow the
business organically via improved positioning, marketing and distribution
– Build a large-scale platform via M&A to create significant value for our shareholders
(1) Calendar year net sales and EBITDA estimated based on 2017E and 2018E fiscal year net sales of $402mm and $428mm (respectively) and EBITDAs of $72mm and 5
$78mm (respectively).
(2) Fiscal year 2016 (ended August). Based on U.S. Multi-Outlet IRI data for Atkins U.S. snacking and frozen meals. Company reported net sales for international.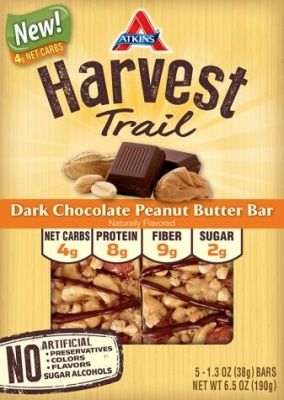
Three Reasons We Really Like the Business
1 Unique Consumer Idea
Atkins defines “low carb”, “low sugar”, “protein rich” nutrition
Loyal, growing consumer base underpins strong consistent growth
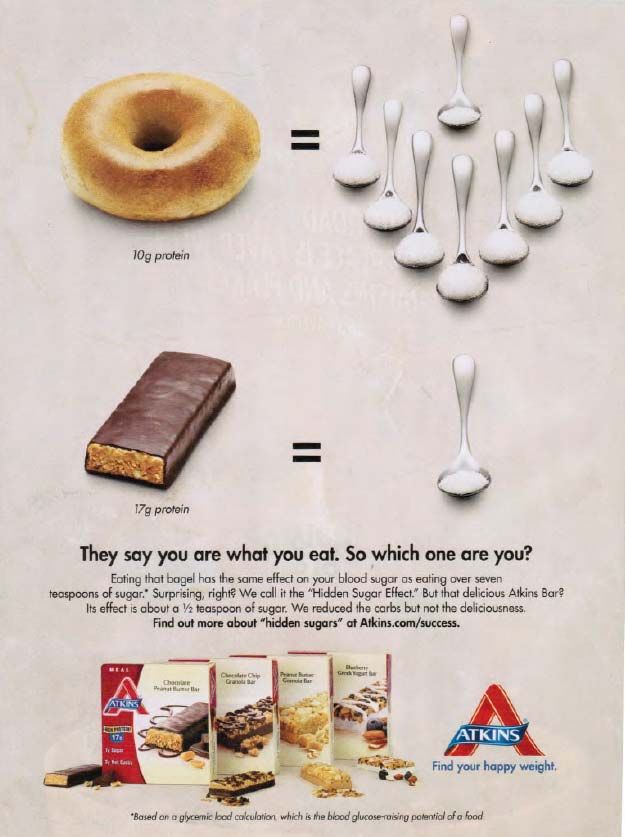
“Hidden sugars” is an emerging breakthrough concept
2 Advantaged Business Model
$600mm scale brand at retail
Premium-priced products based on quality ingredients
Important to retailers with strong trade margins
Leadership in section of store with ~40% share-of-shelf(1)
Attractive margins gross margin of ~47% and EBITDA margin of ~18% (with ~10% of net sales in
marketing investment)(2)
Asset-lite model high free cash flow and strong return on assets
3 Compelling Growth Opportunity
Opportunity to expand target audience 4x
Improve quality / quantity of marketing and innovation behind new consumer idea
Bolt-on acquisitions (e.g. SimplyProtein®) can quickly add scale
We remain a good Reverse Morris Trust partner for large strategics
6
(1) Based on Management estimates.
(2) Based on 2017E pro forma forecast.
Our Investment Thesis
Atkins is a well positioned, growing $600mm brand (at retail, including frozen meals)
– Stands for “low carb”, “low sugar”, “protein rich” nutrition for many consumers
– Important to retailers due to leadership position in the nutrition and wellness aisle
Strong business performance and financial metrics
– 8 consecutive years (from 2008 to 2016) of U.S. snacking point-of-sale takeaway growth (16% CAGR)(1)
– EBITDA margins approaching 20%
– Asset-lite business model generating high free cash flow
Well positioned to take advantage of consumer mega trends
– Convenience and snacking
– Meal replacement
– Health & wellness
– “Clean eating”
Platform for future M&A
– Well positioned as a Reverse Morris Trust partner for large strategics
– December 2016 acquisition of Wellness Foods, Inc. (developer, marketer and seller of the SimplyProtein brand)
in-line with our snacking roll-up strategy (opportunity to add snack adjacencies: nuts, meat snacks, bars, etc.)
Strong management team that we’ve worked with in the past
– Jim Kilts has worked with Joe Scalzo (the CEO of Atkins Nutritionals) at The Gillette Company
• We know him as a leader that is grounded in our key managerial practices practices that have led to
our track record of shareholder value creation
7
(1) Total U.S. Multi-Outlet IRI data, excluding frozen meals.
Transaction Consistent With Attributes Highlighted During IPO
Market and / or cost leadership positions
High margins
Investment Strong free cash flows
Attributes
We Like Potential for revenue, cost structure, market share and / or distribution improvements
Platforms for future acquisition
Operational stability through economic cycles
Health & wellness
Snacking
Convenience-oriented products
Consumer Ongoing e-commerce penetration
Industry
Trends Organic, locally-sourced products
Brands with broad, multi-cultural appeal
Outsourcing of critical CPG-related services
Affordable luxury products
8
Opportunity to Leverage Our Significant Brand Building Experience…
Over their careers, Conyers Park’s principals have helped build or revitalize some of the most
recognized brands in the consumer industry

                                                                                                 9
…And Augment Atkins’ Experienced Leadership Team
90+ year track record of building and revitalizing Private and public company experience across
brands multiple branded consumer products, food and
nutrition categories
Leadership has delivered ~$50bn of value
creation for shareholders
Management has years of experience working with Jim Kilts and applying his management principles
Combined expertise in branded food, nutrition and snacking
Strong public company capabilities and experience with executing growth strategies and integrating M&A
10Transaction Overview
Enterprise value of $856mm
– Compelling valuation at 11.6x CY’17E EBITDA of $74mm(1) and 11.8x CY’17E EBITDA less CapEx of
$73mm (CapEx of $1mm)
Selling shareholders to be paid $628 million cash consideration and issued approximately 10mm rollover
shares at $10.00 per share valuation at close
$628mm cash consideration and ~$25mm of estimated transaction costs will be funded with the following:
– Common stock private placement in the amount of 10mm shares at $10.00 per share, or $100mm in total
• Common stock private placement investors include large institutional investors such as: certain funds
managed by Fidelity Management and Research Company or its affiliates, one or more funds managed by
Capital Research and Management Company, and funds and accounts advised by T. Rowe Price
Associates, Inc.
– $402.5mm cash from Conyers Park trust
– $150mm of new net debt
Company to enter into a tax sharing arrangement with selling shareholders as part of the transaction
Equity value at $10.00 per share of $706mm
Jim Kilts to serve as Chairman and Dave West to serve as Executive Vice Chairman post-closing
Expected transaction closing by end of June
11
(1) Calendar year EBITDA estimated based on 2017E and 2018E fiscal year EBITDAs of $72mm and $78mm, respectively.Atkins Nutritionals Business Overview
Section 2Powerful Brand With Strong Consumer Equity
~$600mm Brand Strong Brand Attributes
Fiscal Year 2016 Sales(1) − 85% aided brand awareness(4)
− Stands for “low carb”, “low sugar”, “protein
Frozen Meals rich” nutrition
$105mm
− Proven track record in promoting effective
18% weight loss
International
$40mm 7%
Number of Servings Per Year, Per Buyer(5)
75%
U.S. Snacking
$443mm 62
Atkins U.S. Snacking POS CLIF Bar 46
Dollar Sales Growth(2)
− Fiscal 2015: +5.0% QuestNutrition 38
− Fiscal 2016: +6.6%
− YTD fiscal 2017(3): +6.9% KIND 23
(1) Source: U.S. Multi-Outlet IRI data for Atkins U.S. snacking and frozen meals. Company reported net sales for international.
(2) Total U.S. Multi-Outlet IRI data. Fiscal years ending August.
(3) Fiscal year to date as of February 26th. 13
(4) Among U.S. consumers; Aided awareness statistic – sourced from MWW Brand Tracking Study.
(5) 2015 IRI panel report.Atkins is Aligned with Consumer Mega Trends
Health Concerns Consensus Building ...Leading Consumers to Shift to Lower
Continue to Grow… on Nutrition... Carbs,
Carbs,Lower
LowerSugar,
Sugar,Higher
HigherProtein
Protein(3)
U.S. Obesity Rate(1)
Over 100 scientific studies 73% of consumers are
78mm
U.S. Adults showing benefits of the Atkins lowering carbohydrates(3)
approach to eating lower
~38% carbs
~22% 22% 17%
Media Attention: 23%
1990 2014 48%
U.S. Diabetes Rate(2) 55%
29mm 34%
A Call for a Low Carb Sugar and Carbs, Not
U.S. Adults
Diet That Embraces Fat Physical Inactivity,
(86mm Prediabetes) Behind Surge in Obesity
~13% USDA US Consumer
~8% Recommended Preferred Nutrition
FDA Seeks to Redefine Sugar is Now Enemy
‘Healthy’ Number One in the
Nutrition Balance Balance
Western Diet
Carbohydrates Protein Fat
1990 2014
Source: CDC Division on Diabetes, U.S. Department of Health & Human Services, WHO. IRI, MULO, Health Focus International, Nielsen Global Health & Wellness Support and
MWW Brand Tracking Study.
(1) Defined as BMI greater than or equal to 30. Reflects adults 20+ years of age in the United States. 14
(2) Reflects adults 20+ years of age in the United States.
(3) Health Focus International, An In-depth Look at Consumer Views on Protein & Carbohydrates.Atkins is a Leader in the Fast Growing Nutritional Snacking Space
Highly Focused Snacking Portfolio
Category Leader (Total Nutritional Snacking)(1)
of 60 SKUs(2)
% Market Share
11.7% Bars
CLIF Bar 10.9%
KIND 9.2%
Drinks
Premier Protein 6.8%
Muscle Milk 4.8%
Treats
Special K 3.5%
QuestNutrition 3.4%
Simply
Atkins is the Only Scale Player Protein
in Both Bars and Drinks
(1) Total Nutritional Snacking is a custom database created for Atkins by IRI comprised of multiple product categories including nutritional snacks and drinks. Source: U.S. Multi-Outlet IRI 15
data, last 12 weeks ending February 26th, 2017.
(2) U.S. Atkins bars and shakes SKUs.Atkins is the Leader in Its Aisle
16Consumer and Customer Strength Generates Track
Record of Growth
$443
$415
$396
$378
$333
$267
$213 $215
$201
$166
$137
2008 2009 2010 2011 2012 2013 2014 2015 2016 YTD YTD
2016(2) 2017(2)
Source: Nielsen FDMx and Retail Link for years 2008 – 2011. Total U.S. Multi-Outlet IRI, excluding frozen meals, for 2012 onwards. 17
(1) Calendar years ending December for 2008 – 2013 and fiscal years ending August for 2014 – 2016.
(2) Fiscal year to date as of February 26th.Atkins Nutritionals Growth Strategy
Section 3Atkins Brand Evolution Over Time
1980’s – 1990’s 2000 – 2007 2008 – 2015 Today / Future
Better Weight For a Low Carb Craze and Balanced Approach to Healthier Approach
Healthier Heart Massive Product Weight Loss through to Eating
Proliferation Healthier Snacking
19Significant Opportunity to Expand Consumer Base as Identified
By Proprietary Research
Historically
Targeted By Atkins
Segment Approach Atkins? Buyer?
Historical target:
Branded
Program 8mm open to low carb
Currently 21mm (19%) 3mm Atkins buyers(1) Opportunity
Trying to 38% Atkins penetration to expand
Lose Weight New target opportunity: target
Self Directed 31mm open to low carb audience 4x
77mm (71%) 3mm Atkins buyers
Addressable
Population
108mm 10% Atkins penetration
(U.S. Adults (64%)
25-64) Other
11mm (10%)
168mm Low Carb
Not Trying to 42% of Atkins dieters then adopt a low
Lose Weight Eating
carb lifestyle
Currently 7mm (11%)
60mm All Other
(36%) 53mm (89%)
Expand target from 8mm low carb program dieters to include 31mm self directed consumers
20
Source: 2016 Diet Incidence study and IRI data.
(1) Includes active and previous program dieters.Self Directed Healthy Eaters Can Be Huge Source of Volume
Atkins Consumer Mix Purchasing Behavior
Active dieters are most loyal, profitable, and
Active Atkins frequent purchasers driving our 2007 – 2015
Dieters growth
15%
Retention of past dieters is still quite strong
Self Directed
52% Healthy
Eaters 52% of Atkins buyers are self-directed despite
Previously on 33%
no historical marketing towards them
Atkins Diet
Program
21
Source: IRI panel report.…And Present a Number of Incremental Growth Areas That
We Are Just Beginning to Tap
1 Improved advocacy, education and activation for the core program dieter
2 Communication to target self-directed low carb-ers
Product innovation / portfolio expansion to meet consumer demands for cleaner labels,
3
higher protein and new product forms
4 Expand distribution into “white space”
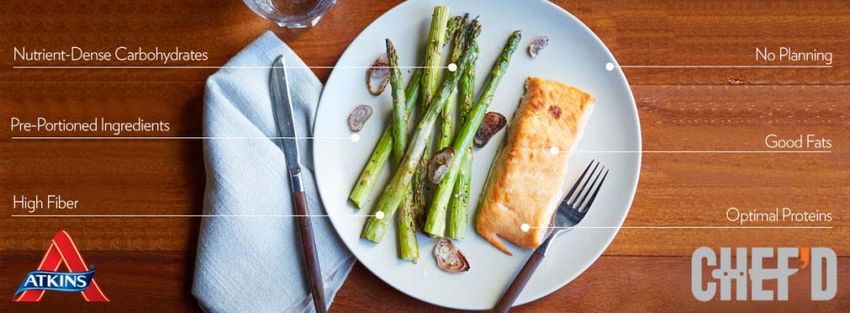
22Improved Advocacy / Education / Activation for Core Consumers
“Happy Weight” Communication Social Media
Chef’d Initiative Improved Website and Mobile App
23New Communication to Reach the Self-Directed Low Carb-ers
and Expand Base
“Hidden Sugar” Communication Food Focused TV Advertising “Cleaner” Labels
Before
After
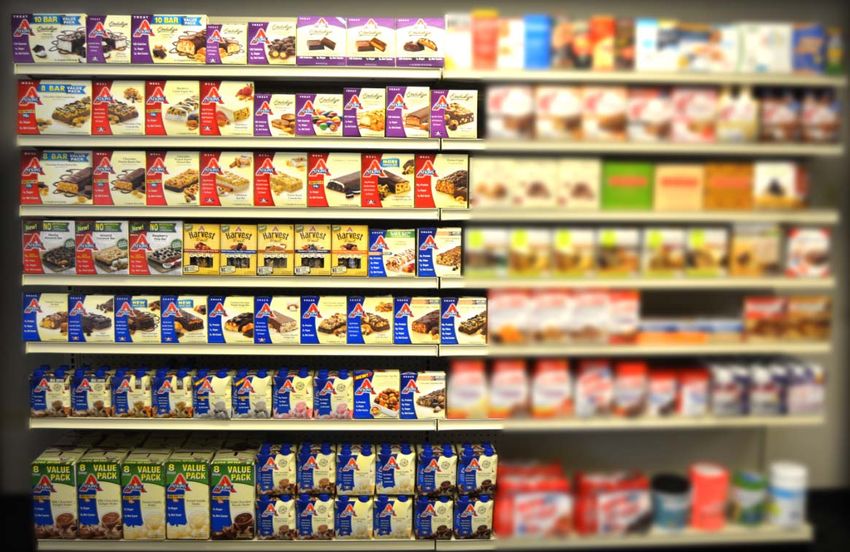
24Portfolio Expansion to Attract New Users / Occasions
Atkins Harvest Trail SimplyProtein Super Foods Bar
Launch Date: Q1 Fiscal 2016 Acquired: December 2016 Launch Date: Q2 Fiscal 2017
Brand Focus: Brand Focus: Brand Focus:
Natural / simple ingredients Delicious “clean” protein “Cleaner” Atkins bar with super
food ingredients
Adds a nut and fruit bar to Atkins’ Products include bars, drinks and
product portfolio chips
Product extension opportunity 25White Space an Opportunity for Distribution Gains
2016 U.S. Snacking Gross Sales By Channel White Space Opportunities
Drug E-Commerce E-commerce opportunity significant
Club 5% 2%
10% C-store and club underpenetrated
46% Mass
Significant natural and specialty channel
opportunity with SimplyProtein
Grocery 37%
26Scalable M&A Platform
Atkins is a leader in nutritional Broader Food / RMT
snacking the brand stands for
low carb, low sugar, protein rich Better-for-You Eating
Snacking / Convenience
Adjacent
Conyers Park / Atkins team has
Healthy Snacking
deep expertise in brand building,
merchandising
and product development
as well as snacking, nutrition
Core Atkins
and health & wellness
Strong customer relationships
with key FDM players
Experienced team that has
managed and integrated
multi-billion dollar businesses
27Atkins Nutritionals Financial Overview
Section 4Summary Financials
Consistent, proven growth track record
Net Sales Gross Profit (and % Margin) EBITDA (and % Margin)
5% CAGR 6% CAGR 9% CAGR
$428
$201
$78
$402
$188
$72
$380 $176
$366 $166
$161 46.9% $64
$353
46.7%
$59
46.2%
45.7% $54
45.4% 18.2%
17.8%
16.9%
16.1%
15.4%
2014A 2015A 2016A 2017E 2018E 2014A 2015A 2016A 2017E 2018E 2014A 2015A 2016A 2017E 2018E
Growth: 3.6% 3.9% 5.8% 6.3% 3.0% 5.7% 6.9% 7.0% 8.0% 8.9% 12.0% 8.7%
Note: Dollars in millions. Financial metrics presented on August fiscal year ends and are pro forma for the licensing of the frozen meals business, estimated incremental public company related
costs and the acquisition of SimplyProtein (for all presented periods). Financial metrics do not include the impact of purchase accounting or other impacts from the consummation of this 29
transaction. SimplyProtein financial metrics are based upon actual / estimated results (also do not contain any adjustments as a result of applying purchase accounting). The pro forma
financial metrics presented are a non-GAAP measure, please see a reconciliation to GAAP financials shown in the appendix.First Half of 2017E Consistent with Overall Growth Outlook
Net Sales Gross Profit (and % Margin) EBITDA (and % Margin)
5% Year-Over-Year 7% Year-Over-Year 15% Year-Over-Year
Growth Growth Growth
$205 $97
$195 $90 $40
47.2% $35
46.4%
19.6%
18.0%
1st Half 1st Half 1st Half 1st Half 1st Half 1st Half
2016A 2017E 2016A 2017E 2016A 2017E
Note: Dollars in millions. Financial metrics presented for September – February periods (based on August fiscal year ends) and are pro forma for the licensing of the frozen meals business,
estimated incremental public company related costs and the acquisition of SimplyProtein (for all presented periods). Financial metrics do not include the impact of purchase accounting or 30
other impacts from the consummation of this transaction. SimplyProtein financial metrics are based upon actual / estimated results (also do not contain any adjustments as a result of
applying purchase accounting). The pro forma financial metrics presented are a non-GAAP measure.Highly Attractive Cash Flow Characteristics
Asset-lite business model with strong cash flow generation
– Capital expenditures of $1mm projected for 2017E and 2018E
– Working capital needs of 10% – 11%
Capital Expenditures as % of Net Sales Working Capital(1) as % of Net Sales
Minimal Annual
Modest Working
Capital Expenditure
Capital Requirements
Needs of ~$1mm
11.2%
0.4% 10.3%
9.6%
0.2%
0.1%
2014A 2015A 2016A 2014A 2015A 2016A
31
Note: Financial metrics presented on August fiscal year ends and represent actual reported metrics by the company for the presented periods.
(1) Working capital defined as accounts receivable + inventories + prepaid expenses – accounts payable – accrued expenses.Atkins Nutritionals Transaction Details
Section 5Transaction Overview
Enterprise value of $856mm (11.6x CY’17E EBITDA of $74mm(1))
– Pro forma net debt of $150mm
– Common stock private placement in the amount of 10mm shares at $10.00 per share, or $100mm in total
– Selling shareholders to be paid $628mm cash consideration and issued 10mm rollover shares at close
• Company to enter into a tax sharing arrangement with selling shareholders as part of the transaction
Jim Kilts to serve as Chairman and Dave West to serve as Executive Vice Chairman post-closing
Through a series of mergers, Conyers Park and Atkins will be owned by The Simply Good Foods Company
upon consummation of the transaction
Cash Sources and Uses
Transaction closing expected in June 2017
Conyers Park Cash in Trust Account $403
Cash Common Stock Private Placement 100
Pro Forma Valuation Sources New Net Debt 150
Illustrative Conyers Park Share Price $10.00 Total $653
(2)
Pro Forma Shares Outstanding (in Millions) 70.563 Cash Consideration to Selling Shareholders $628
(3)
Equity Value $706 Cash Uses Conyers Park Estimated Transaction Costs 25
Total $653
Net Debt 150
Enterprise Value $856 Pro Forma Equity Ownership(2)
Valuation (1)
11.6x Selling Shareholders
CY'17E EBITDA Multiple 15%
Multiples CY'17E EBITDA
(1)
Less CapEx Multiple 11.8x
Conyers Park
14%
Founders
Conyers Park Public
71% Shareholders
Note: Dollars in millions, except per share data.
(1) Calendar year EBITDA estimated based on 2017E and 2018E fiscal year EBITDAs of $72mm and $78mm, respectively.
(2) Pro forma share count includes 50.250mm of Conyers Park public shares (including 10mm shares sold in the common stock private placement), 10.063mm of Conyers Park founder
shares, and10.250mm of rollover shares issued to selling shareholders. Based on a nominal share price of $10.00. Excludes 20.117mm of outstanding warrants (with an exercise price of 33
$11.50).
(3) Estimated transaction costs include new debt financing fees, private placement fees, original deferred underwriting discount and other advisory and diligence related fees.Operating Benchmarking to Peers
20.0%
15.7% Peer Set Median: 1.8%
15.0%
Fiscal
2016–2018E 10.0% 7.9%
Net Sales 6.1%
CAGR 5.0% 3.5% 3.2%
1.9% 1.8% 1.8% 1.8% 1.6% 0.9% 0.6% (0.7%)
0.0%
Amplify Hostess Atkins McCormick J&J Snack Post B&G Foods Lancaster Pinnacle Snyder's- Flowers Large Cap J. M.
Foods Colony Lance Foods Index(1) Smucker
15.0%
Peer Set Median: 6.1%
Fiscal 10.4% 10.0%
9.1%
10.0%
2016–2018E 7.6% 7.5% 7.3%
6.1%
Adjusted 5.8%
4.5%
5.0% 3.7%
EBITDA 3.3% 2.7%
CAGR 1.1%
0.0%
Atkins Snyder's- Hostess Amplify McCormick Pinnacle Lancaster J&J Snack Flowers Large Cap Post B&G Foods J. M.
Lance Colony Foods Foods Index(1) Smucker
40.0%
Fiscal 2017E EBITDA Margin EBITDA – CapEx Margin
EBITDA Margin
30.3% Peer Set Median: 18.8% Peer Set Median: 17.0%
Adjusted 30.0% 26.0%
EBITDA - CapEx Margin
EBITDA 22.9% 22.4% 22.1% 22.0%
18.8% 18.5% 18.3%
Margin and 20.0% 25.9% 17.8%
15.8% 14.9%
22.3%
Adjusted 19.7% 19.8% 18.3% 17.6% 17.0% 17.6%
11.6%
EBITDA 10.0% 14.7% 14.4%
11.1% 10.7%
Less CapEx 9.1%
0.0%
Margin Hostess Amplify J. M. B&G Foods Pinnacle Large Cap Lancaster Post McCormick Atkins J&J Snack Snyder's- Flowers
Smucker Index(1) Colony Foods Lance Foods
Source: Equity research, Capital IQ and company filings. 34
Note: Estimates as of 4/4/17. Fiscal years used for Atkins (ending August) and all peers (each peer using its respective fiscal year-end).
(1) Large Cap Index metrics take the median of Campbell Soup Company, Conagra, General Mills, Hershey, Hormel, Kellogg, Kraft Heinz, Mead Johnson, and Mondelez.Valuation Benchmarking to Peers
At $10.00 per share value, Atkins is valued at a discount to the majority of its peers
– A more meaningful discount is implied on the EBITDA less CapEx basis
20.0x
Peer Set Median: 13.7x
16.7x
15.5x 14.9x 14.4x 14.2x 13.7x
15.0x 13.6x
11.8x 11.8x 11.7x 11.6x 11.4x 11.0x
CY’17E 10.0x
EBITDA
Multiple 5.0x
0.0x
McCormick Snyder's- Lancaster Hostess J&J Snack Pinnacle Large Cap Amplify B&G Foods J. M. Atkins(2) Post Flowers
Lance Colony Foods Index(1) Smucker Foods
25.0x
21.5x 21.2x Peer Set Median: 16.4x
20.2x
20.0x
16.8x 16.6x 16.5x 16.4x
14.0x 14.0x
CY’17E 15.0x 13.9x 13.7x 13.3x
11.8x
EBITDA
10.0x
Less CapEx
Multiple 5.0x
0.0x
Snyder's- McCormick J&J Snack Hostess Pinnacle Large Cap Lancaster Post Flowers J. M. Amplify B&G Foods Atkins (3)
Lance Foods Index (1) Colony Foods Smucker
Source: Equity research, Capital IQ and company filings.
Note: Estimates as of 4/4/17. Atkins and peers adjusted to reflect a calendar year (December) year-end.
(1) Large Cap Index metrics take the median of Campbell Soup Company, Conagra, General Mills, Hershey, Hormel, Kellogg, Kraft Heinz, Mead Johnson, and Mondelez. 35
(2) Calendar year 2017E Adjusted EBITDA of $74mm, estimated based on 2017E and 2018E fiscal year Adjusted EBITDAs of $72mm and $78mm, respectively.
(3) Calendar year 2017E Adjusted EBITDA – Capital Expenditure of $73mm, estimated based on 2017E and 2018E fiscal year Adjusted EBITDA – CapEx’s of $71mm and $77mm, respectively.Appendix
Pro Forma Financials Reconciliation
                                                                                               Atkins Nutritionals:

                                                                                                            Annual Financials (August Fiscal Year End)                    1st Half Financials

                                                                                                                 Historicals (Filed in                                   Historicals (Filed in

                                                                                               Historicals         Proxy Statement)              Projections               Proxy Statement)

                                                                                                 2014A            2015A       2016A           2017E       2018E           2016A        2017A

            Adjusted Net Sales (As Defined Per Filed Proxy Statement)                               $401             $419       $430            $393        $417             $220        $202

              Frozen     Removal of Frozen Meals Related Net Sales                                    (58)             (65)        (63)              –           –             (31)           –
              Meals      Licensing Income Adjustment                                                    4                4            4              –           –               2            –
            Licensing    Net Frozen Meals Licensing Adjustment                                      ($54)            ($61)      ($59)                –           –           ($29)            –
Net Sales

            Normalized Adjusted Net Sales (As Defined Per Filed Proxy Statement)                    $347             $358       $371            $393        $417             $191        $202

            SimplyProtein Related Net Sales (Pre-Acquisition)                                           6                8            9             10          11               4            3

            Pro Forma Net Sales (Figures Used in This Presentation)                                 $353             $366       $380            $402        $428             $195        $205

            Adjusted EBITDA (As Defined Per Filed Proxy Statement)                                   $55              $59        $64              $72         $78             $36         $40

              Frozen     Removal of Frozen Meals Related EBITDA                                        (4)              (4)         (4)              –           –               (2)          –

              Meals      Licensing Income Adjustment                                                    4                4            4              –           –               2            –
            Licensing    Net Frozen Meals Licensing Adjustment                                       ($0)             ($0)         $0                –           –             ($0)           –
 EBITDA
            Normalized Adjusted EBITDA (As Defined Per Filed Proxy Statement)                        $55              $59        $64              $72         $78             $35         $40

            SimplyProtein Related EBITDA (Pre-Acquisition)                                              1                1            2              1           –               1            1

            Incremental Public Company Costs (For Pre-Closing Time Periods)                            (2)              (2)         (2)             (1)          –               (1)         (1)

            Pro Forma EBITDA (Figures Used in This Presentation)                                     $54              $59        $64              $72         $78             $35         $40

Note:   Dollars in millions. Financial metrics presented on August fiscal year ends. Financial metrics do not include the impact of purchase accounting or other impacts from the consummation of 37
        this transaction. SimplyProtein financial metrics are based upon actual / estimated results for historical periods (also do not contain any adjustments as a result of applying purchase
        accounting).
Non-GAAP Reconciliation
Atkins Nutritionals:
53 / 52 Weeks Ended 26 Weeks Ended
August August February February
29, 2015 27, 2016 27, 2016 25, 2017
Net Sales (As Defined Per Filed Proxy Statement) $419 $428 $220 $202
Net Sales Recall Receivable Reserve – 2 – –
Adjusted Net Sales (As Defined Per Filed Proxy Statement) $419 $430 $220 $202
Net Income (As Defined Per Filed Proxy Statement) $9 $10 $8 $10
Income Tax Expense 6 8 6 7
Interest Expense 28 27 14 14
Depreciation and Amortization 11 10 5 5
Stock Based Compensation 1 3 1 1
(1)
Management Fees 2 2 1 1
EBITDA Restructuring Charges
(2)
0 2 0 0
Transaction / IPO Readiness Expenses (One-Time in Nature) 1 0 0 1
Recall Receivable Reserve – 2 – –
Frozen Licensing Media (One-Time in Nature) – – – 0
Legal Costs (One-Time in Nature) – – – 0
(3)
Other Charges 2 1 0 1
Adjusted EBITDA (As Defined Per Filed Proxy Statement) $59 $64 $36 $40
Note: Dollars in millions.
(1) Historical management fees paid to selling shareholders. 38
(2) One-time costs of restructuring activities largely due to the elimination of costs as part of the licensing of the frozen meal business.
(3) Other charges consist principally of exchange impact of foreign currency transactions as well as one-time legal costs and minor impacts of channel inventory returns.You can also read