COOK ISLANDS MARINE PARK - Marae Moana
←
→
Page content transcription
If your browser does not render page correctly, please read the page content below
COOK ISLANDS MARINE PARK
Coral reef survey of Aitutaki, Manuae, Mitiaro, Takutea, and Atiu
                  in the southern Cook Islands

                                                                     Graham McDonald

                                                                      Teina Rongo
                                                                Jacqueline Evans
                                                                   Kelvin Passfield
                                                                    Jessica Cramp
                                                                    Mareike Sudek
                                                                        Ben Tautu
                                                               Graham McDonald
                                                            Teariki Charles Rongo
                                                               Barbara Hanchard

                               0                                       2013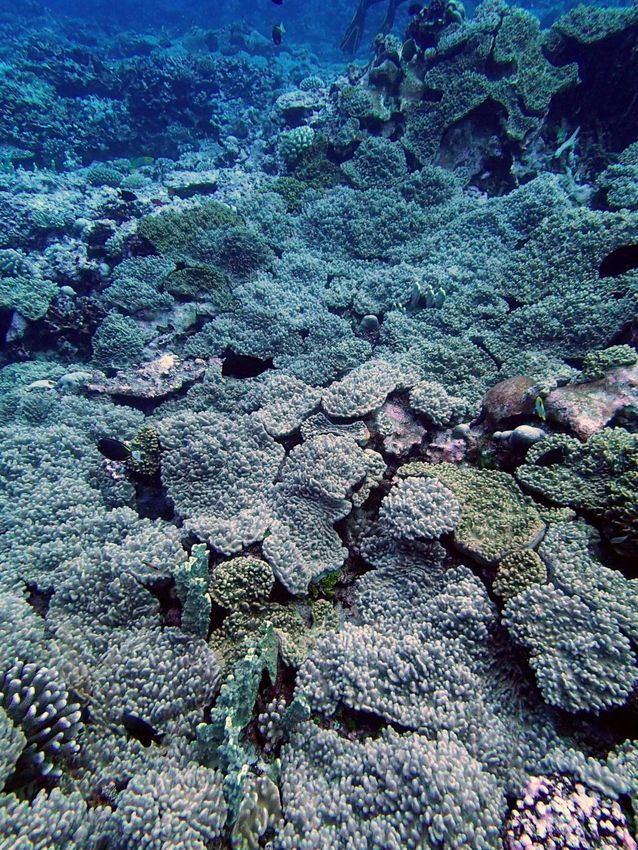
COOK ISLANDS MARINE PARK
                          Coral reef survey of Aitutaki, Manuae, Mitiaro, Takutea, and Atiu
                                                             in the southern Cook Islands

This research was a collaboration between the Office of the Prime Minister of the Cook Islands (Climate Change Division), Te Ipukarea Society, Oceans 5,
Waitt Institute, Pacific Islands Conservation Initiative, Cook Islands National Environment Service, Secretariat of the Pacific Community, European Union,
and the Global Climate Change Alliance.

                                                                           1
How to cite this report:

Rongo, T.*, Evans, J., Passfield, K., Cramp, J., Sudek, M., Tautu, B., McDonald, G., Rongo, T.C., & B. Hanchard. 2013.
Cook Islands Marine Park: coral reef survey of Aitutaki, Manuae, Mitiaro, Takutea, and Atiu in the southern Cook Islands.
Government of the Cook Islands. 64 p.

*Corresponding author: Office of the Prime Minister, Private Bag, Avarua, Rarotonga, Cook Islands; teina.rongo@cookislands.gov.ck.

                                                                          2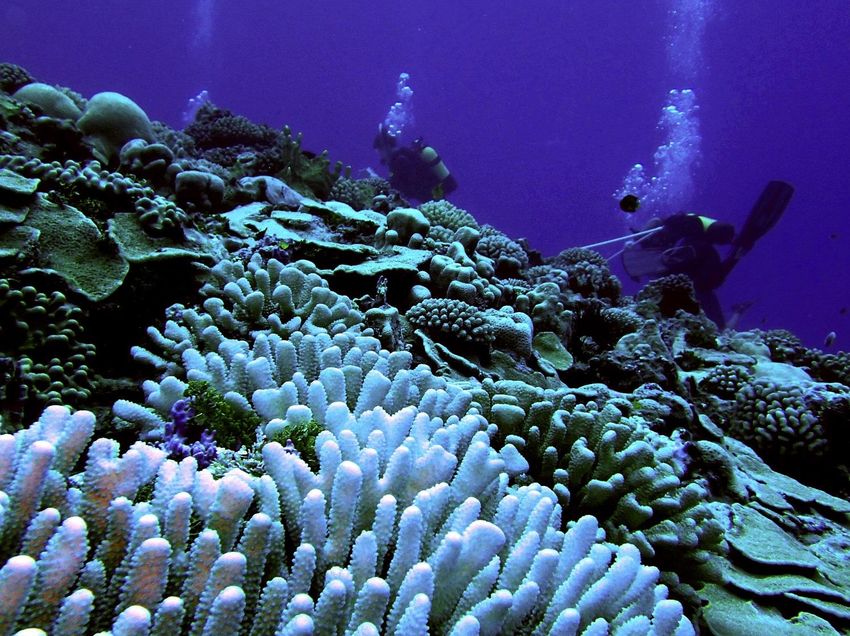
TABLE OF CONTENTS

EXECUTIVE SUMMARY.................................................................................................................................................... 4
       1. INTRODUCTION............................................................................................................................................. 5
                  1.1. PRIMARY OBJECTIVES ............................................................................................................ 8
                  1.2. EXPEDITION TEAM ................................................................................................................... 8
                  1.3. MATERIALS AND METHODS..................................................................................................... 9
                                  1.3.1. Sites ........................................................................................................................... 9
                                  1.3.2. Transect deployment ................................................................................................. 9
                                  1.3.3. Biological surveys ...................................................................................................... 9
                                                  1.3.3.1. Coral communities................................................................................... 9
                                                  1.3.3.2. Coral colony size..................................................................................... 9
                                                  1.3.3.3. Macro-invertebrates & fish....................................................................... 10
                                                  1.3.3.4. Biological diversity................................................................................... 10
                                  1.3.4. Data analysis.............................................................................................................. 10
                                                  1.3.4.1. Percent cover calculations....................................................................... 10
                                                  1.3.4.2. Colony size calculation............................................................................ 11
                                                  1.3.4.3. Average density....................................................................................... 11
                                                  1.3.4.4. Species diversity...................................................................................... 11
                                                  1.3.4.5. Statistical analysis................................................................................... 11
       2. PROFILE AND RESULTS BY ISLAND.......................................................................................................... 12
                  2.1. AITUTAKI...................................................................................................................................... 12
                                  2.1.1. Site characteristics..................................................................................................... 12
                                  2.1.2. Benthic communities.................................................................................................. 13
                                  2.1.3. Macro-invertebrate communities................................................................................ 13
                                  2.1.4. Discussion.................................................................................................................. 14
                  2.2. MANUAE.......................................................................................................................................18
                                  2.2.1. Site characteristics..................................................................................................... 18
                                  2.2.2. Benthic communities.................................................................................................. 19
                                  2.2.3. Macro-invertebrate communities............................................................................... 22
                                  2.2.4. Fish communities....................................................................................................... 23
                                  2.2.5. Discussion.................................................................................................................. 25
                  2.3. MITIARO....................................................................................................................................... 28
                                  2.3.1. Site characteristics..................................................................................................... 28
                                  2.3.2. Benthic communities.................................................................................................. 29
                                  2.3.3. Macro-invertebrate communities................................................................................ 31
                                  2.3.4. Fish communities....................................................................................................... 32
                                  2.3.5. Discussion.................................................................................................................. 33
                  2.4. TAKUTEA..................................................................................................................................... 34
                                  2.4.1. Site characteristics..................................................................................................... 34
                                  2.4.2. Benthic communities.................................................................................................. 35
                                  2.4.3. Macro-invertebrate communities................................................................................ 37
                                  2.4.4. Fish communities....................................................................................................... 38
                                  2.4.5. Discussion.................................................................................................................. 39
                  2.5. ATIU.............................................................................................................................................. 40
                                  2.5.1. Site characteristics..................................................................................................... 40
                                  2.5.2. Benthic communities.................................................................................................. 41
                                  2.5.3. Macro-invertebrate communities................................................................................ 44
                                  2.5.4. Fish communities....................................................................................................... 46
                                  2.5.5. Discussion.................................................................................................................. 47
       3. OVERALL COMPARISON.............................................................................................................................. 48
                  3.1. BENTHIC COMMUNITIES........................................................................................................... 48
                  3.2. MACRO-INVERTEBRATE COMMUNITIES................................................................................ 53
                  3.3. FISH COMMUNITIES................................................................................................................... 54
       4. SUMMARY...................................................................................................................................................... 56
       5. ACKNOWLEDGEMENTS............................................................................................................................... 58
LITERATURE CITED.......................................................................................................................................................... 59
APPENDICES..................................................................................................................................................................... 60

                                                                                         3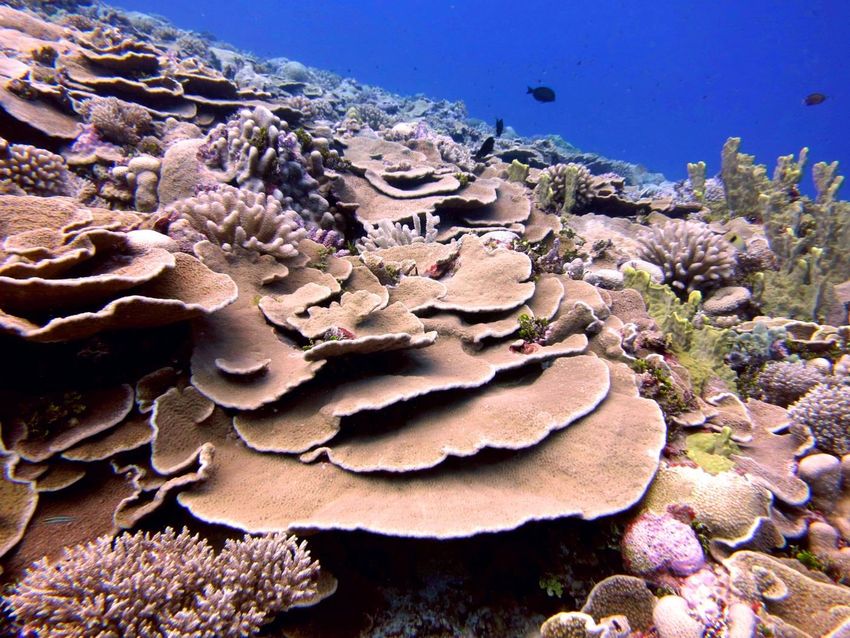
EXECUTIVE SUMMARY

         From 28 July – 9 August 2013, a research team consisting of individuals from the Office of the Prime
Minister of the Cook Islands, Te Ipukarea Society, Oceans 5, Pacific Islands Conservation Initiative, Cook
Islands National Environment Service, and local volunteers travelled aboard the vessel Plan B of the Waitt
Institute to conduct a rapid marine assessment of the fore reefs of the islands of Aitutaki, Manuae, Mitiaro,
Takutea, and Atiu in the southern Cook Islands –– for the purpose of assessing the health of coral reefs within
the proposed Cook Islands Marine Park.
         The results of this assessment showed that coral communities on the fore reefs of Manuae, Mitiaro,
Takutea, and Atiu were relatively healthy with good coverage of hard corals. Indicators of healthy reefs on these
islands also included the dominance and high abundance of the coral-associated fish family Pomacentrids, high
cover of crustose coralline algae, and low cover of macro-algae. Coral communities were very similar on these
islands in terms of species composition (except Atiu), attributed to the dominance of a few species of hard coral
–– such as the platy coral Astreopora expansa on steeper reef slopes –– which thus far appear to be unique to
these islands. Despite low abundance of herbivorous fish species noted, this was unlikely the result of
overfishing as human population is low on these islands and fishing activities have declined overall. On the other
hand, Aitutaki’s reefs showed a significant decline in coral health, particularly on the fore reef.
         Interestingly, coral reef disturbance (i.e., COTS infestation and coral disease) and recovery (based on
coral colony size information) appear to have some geographical pattern, with both occurring in a southeastward
direction from Aitutaki towards Manuae, Mitiaro, Takutea, and Atiu. Though limited historical information and
baseline data exists for this chain of islands, seemingly these islands have gone through a cycle of disturbance
with recovery well underway. Yet, a subsequent round of disturbance has commenced in this southeastward
direction, with Aitutaki showing a significant decline in coral cover since the last fore reef survey in 2008, and
Manuae (the next island in the chain) showing signs of stress related to coral disease and COTS predation.
         Based on this pattern, we suggest that an outbreak of COTS and perhaps the prevalence of coral
disease on Aitutaki could potentially cascade down the rest of the island chain. Hydrodynamic studies also
support this pattern, particularly from December to March during the spawning months for most marine
organisms in the region, where the predominant current flow is south to southeastward. In this regard, a bottom-
up control of nutrients in Aitutaki may reduce the impact of anthropogenic stressors such as COTS and coral
disease on islands to the southeast. A more detailed study of coral disease and other diseases (i.e., Coralline
Lethal Orange Disease recorded on Aitutaki) would be critical to elucidate the causes and the extent of the
damage and distribution in this group of islands. Indeed, connectivity studies and information from regular
monitoring of these reefs will certainly help us understand how these islands influence each other, which would
feed into an effective management plan for these delicate ecosystems within the Cook Islands Marine Park.

                                                           4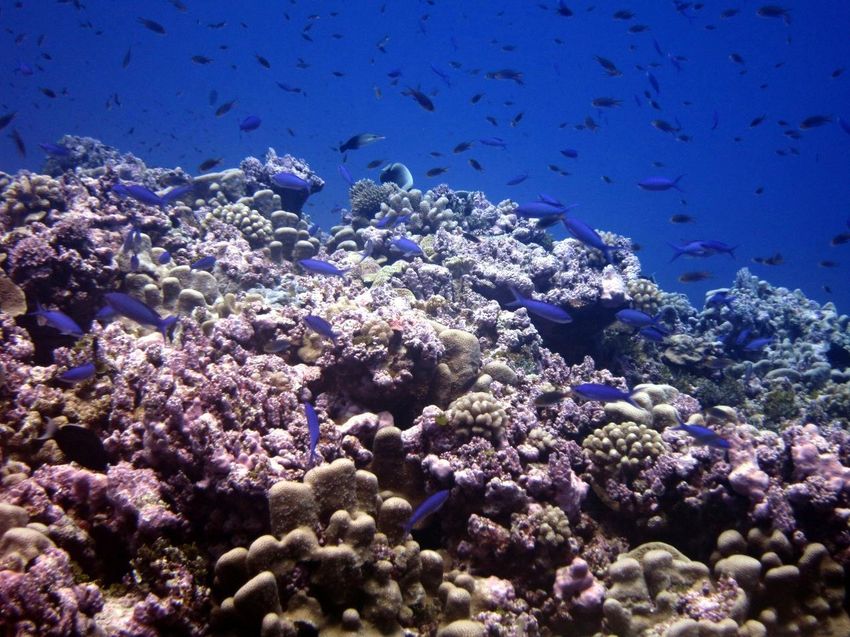
1. INTRODUCTION

         Coral reefs are structurally important for the protection of low-lying coastal areas from strong wave
action and erosion. Reefs also provide food, recreational opportunities, medicinal products, and are a major
attraction for the tourism industry. However, there is mounting evidence that marine resources, as well as marine
ecosystems around the world, are heading towards a downward trajectory (Jackson et al., 2001; Pandolfi et al.,
2003). A report on the status of the reef by the Global Coral Reef Monitoring Network indicated that about 30% of
the world’s reefs have been degraded, and another 30% is predicted to have the same fate within a few decades
(Wilkinson, 2002). Major contributors to the degradation of marine ecosystems are global climate change and
other related anthropogenic activities, which threaten ecosystems through changes in ocean chemistry,
increased incidence of coral disease, coral bleaching events, ocean acidification, eutrophication, and increased
sedimentation (Hoegh-Guldberg, 1999; Kleypas et al., 1999; Lapointe, 1997; Rogers, 1990). These impacts will
cause fundamental changes to reef habitats, including reduced coral cover, changes to the composition of coral
assemblages and reduced structural complexity (Hughes et al., 2003, Aronson & Precht, 2006; Hoegh- Guldberg
et al., 2007). A meta-analysis of coral reefs reveal that over the past 30 years, coral cover on reefs in Southeast
Asia, Australia, and the western Pacific Ocean have decreased by around 40% relative to the early 1980s; about
16% of the corals around the world disappeared during the 1998 bleaching event alone (Bruno & Selig, 2007).
         In the Cook Islands (Figure 1 top), natural disturbances play a major role in influencing the state of coral
reef ecosystems. For example cyclones, which have been linked to the El Niño Southern Oscillation (Figure 2), is
critical in determining the fate of coral reefs in the southern Cook Islands (Rongo & van Woesik, 2013). Crown-of-
thorns starfish (COTS; Acanthaster planci), a common coral-eating predator to these reefs and arguably an
anthropogenic-induced disturbance (e.g., Birkeland, 1982; Brodie et al., 2005), also play an important role in
shifting reef communities in this region from coral-dominated to less desirable states (Figure 3). For example, in
the last 40 years, Rarotonga has experienced two major COTS outbreaks (one in the early 1970s and the other
in the 1990s), which severely decimated its reefs (Rongo & van Woesik, 2013).
         It is important to understand that for the Cook Island’s 1.9 million km2 of total territory area within its
Exclusive Economic Zone (Figure 1 bottom), over 99.9% is ocean. Yet very little effort in terms of research has
been dedicated to understanding how this large area of ocean influences the near shore communities in this
group of islands and vice versa. According to the National Sustainable Development Plan 2011 - 2015 for the
Cook Islands, the development of this country must achieve its national vision, which is “to enjoy the highest
quality of life consistent with the aspirations of our people and in harmony with our culture and environment”. The
Government’s declaration of half of its Exclusive Economic Zone (~1 million km 2) as a Cook Islands Marine Park
(CIMP) in 2012 (see Figure 1 bottom) recognizes these global, regional, and local threats, and intends to ensure
that these ecosystems and its resources are properly managed to increase not only their resiliency to these
threats, but also that of the Cook Islands people that rely on them for food security and economic development.

                                                         5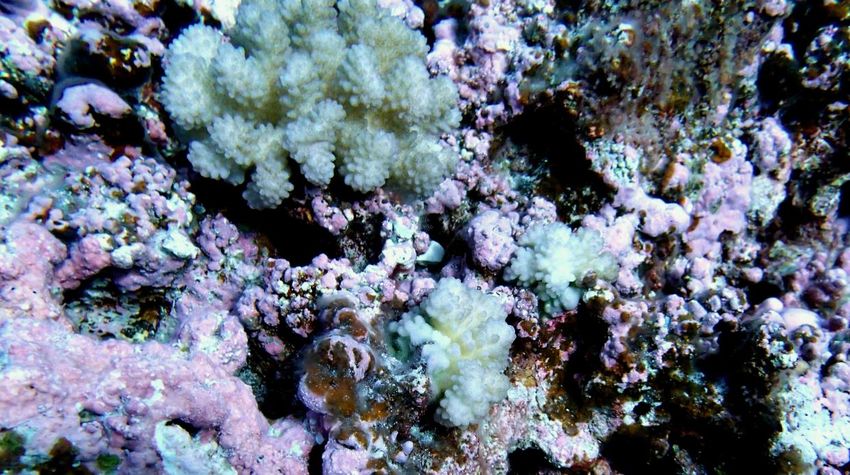
Figure 1. Top: Map of the Pacific with the location of the Cook Islands indicated in the boxed region. Bottom: the Cook
Islands’ Exclusive Economic Zone in the shaded grey region, with the red-lined zone indicating the proposed Cook Islands
Marine Park encompassing the southern Cook Islands group. Map generated by the Cook Islands Government.

                                                           6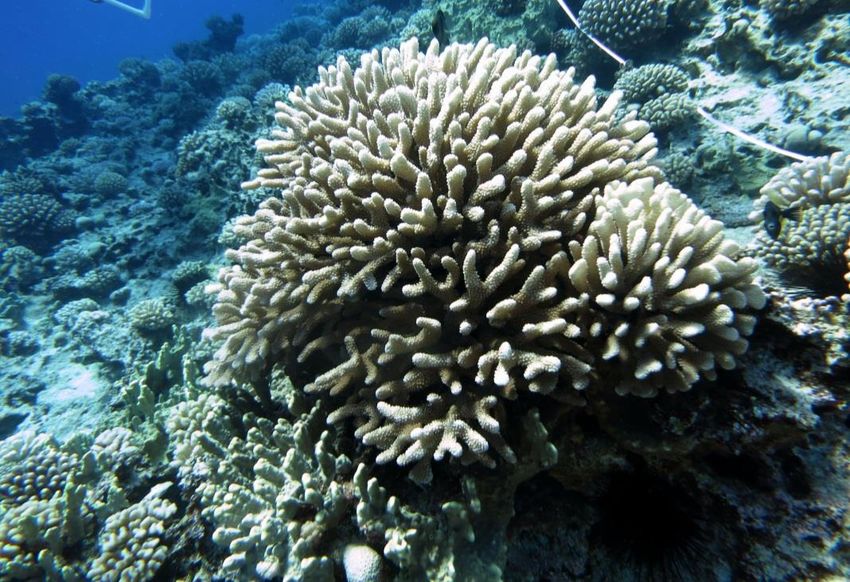
Figure 2. Generalized
    tracks of 104 cyclones in
    the Cook Islands, 1820–
    2006. The origin of
    cyclones tracking from west
    of 175ºW longitude is not
    shown, and many cyclones
    tracked east or south out of
    the map area before
    decaying or undergoing
    extratropical     transition.
    Solid blue line delineates
    the Exclusive Economic
    Zone of the Cook Islands.
    Dashed red line indicates
    the boundary of the Cook
    Islands Marine Park at
    15ºS. Figure modified from
    de Scally (2008).

       Figure 3. The crown-of-
       thorns            starfish,
       Acanthaster         planci,
       feeding on a fore reef
       coral in Amuri, Aitutaki in
       2008. About a dozen
       starfish were noted at
       depths around 7 – 12 m
       in an area where the
       coral community was
       healthy during this
       period. Photo taken by
       Teina Rongo.

7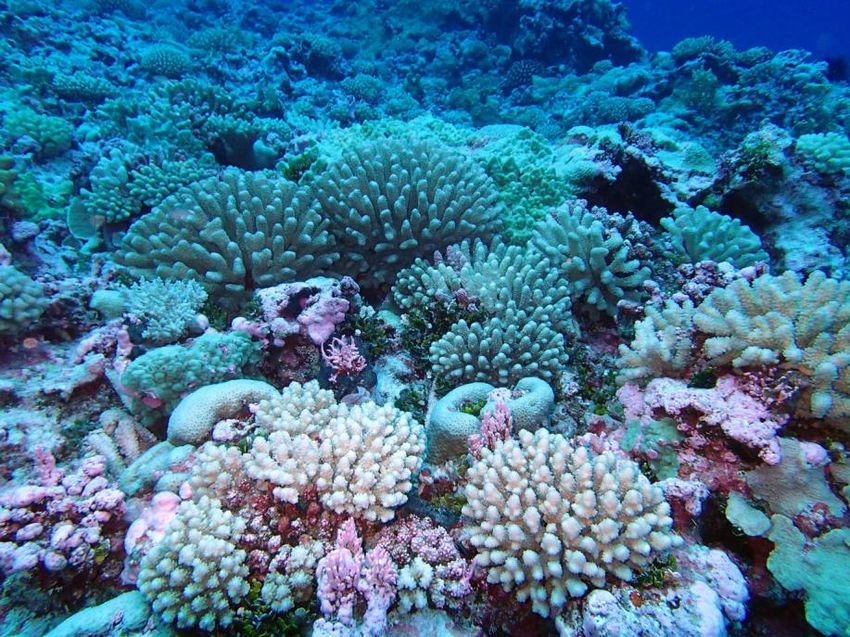
1.1. PRIMARY OBJECTIVES
         The objectives of this study were to carry out rapid marine assessments on the fore reefs of five islands
in the southern Cook Islands – Aitutaki, Manuae, Mitiaro, Takutea, and Atiu (Figure 4 top) – as well as to explore
a shallow seamount named Te Uapuakaoa located around 200 nautical miles west of Rarotonga, and a
supposed shallow reef system named Winslow Reef located east of Te Uapuakaoa. The research expedition
took place from 28 July – 9 August 2013, with the research team travelling aboard the vessel Plan B to first
search for the seamount and Winslow Reef, albeit unsuccessfully (Figure 4 bottom), before returning to the
southern Cook Islands to conduct reef surveys. The marine assessments largely focused on 1) collecting
information on coral reef biodiversity (i.e., fish, macro-algae, corals, and other macro-invertebrates), 2) assessing
the status of coral reefs on each island, and 3) establishing reef baseline information for some of the islands.
This information will enable stakeholders such as resource managers, political decision-makers, and the general
public to plan and make informed decisions pertaining to the management of the CIMP based on scientifically
valid, quantitative data. The Office of the Prime Minister of the Cook Islands, Non-Government Organizations Te
Ipukarea Society (who coordinated this survey) and Pacific Islands Conservation Initiative, and the National
Environment Service were supported by Oceans 5 and the Waitt Institute who generously provided funding and
their research vessel, crew, and expertise respectively.
                                                                  Figure 4. Top: Map of islands in the southern Cook
                                                                  Islands. Yellow names indicate islands surveyed on
                                                                  this 2013 expedition. Map modified from Google
                                                                  Earth. Bottom: screenshot of Plan B’s navigation
                                                                  screen indicating the search pattern for Te
                                                                  Uapuakaoa seamount; the depth sounder was limited
                                                                  to 600 m, but no seamount was found within this
                                                                  range. Winslow Reef was also not found, perhaps
                                                                  because it was incorrectly charted. Photo provided by
                                                                  Kelvin Passfield.

                                                                  1.2. EXPEDITION TEAM
                                                                           The     CIMP     research     team     was
                                                                  composed of individuals from the relevant
                                                                  ministries within the Cook Islands Government
                                                                  (i.e., Climate Change Division and the National
                                                                  Environment Service) as well as from the Non-
                                                                  Government Organizations Te Ipukarea Society
                                                                  and Pacific Islands Conservation Initiative.
                                                                  There were also local avid divers who
                                                                  volunteered their assistance with the field work.

                                                           8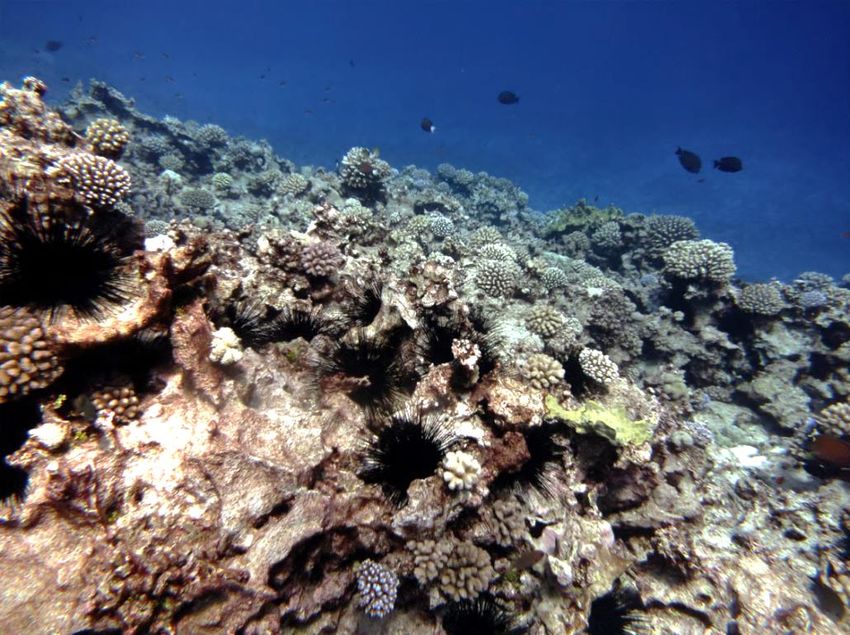
1.3. MATERIALS AND METHODS

1.3.1. Sites
         The number of sites and locations surveyed at each island were determined based on accessibility.
Because of rough sea conditions experienced during this expedition, most sites were located on the leeward
exposure of islands. Sites established in previous reef surveys for Aitutaki (Rongo, 2008), Manuae (Rongo et al.,
2005), and Mitiaro (Lyon, 2002) were revisited. For islands that have not been previously surveyed (i.e., Takutea
and Atiu), this survey provided baseline information for future monitoring. Appendix A provides the Global
Positioning System coordinates of sites on each island surveyed during this expedition.

1.3.2. Transect deployment
         Three 50-m transects (replicates) were deployed at all sites along the fore reef. Transects were placed
following the reef contour at depths around 7 – 10 m parallel to shore and laid consecutively at intervals of 10 m.

1.3.3. Biological surveys
         The survey methods used were selected because they are widely accepted protocols for rapid marine
assessments. Validation of these methods is their publication in peer-reviewed scientific journals. For example,
Houk et al. (2005) contains methodology for coral community and benthic surveys. In addition, the methods
selected complement those of previous fore reef surveys conducted in Rarotonga (Miller et al., 1994; Ponia et
al., 1999; Rongo et al., 2006, 2009; Rongo & van Woesik, 2013), Aitutaki (Rongo, 2008), Mitiaro (Lyon, 2002),
and Manuae (Rongo et al., 2005). A brief description of each general biota or coral survey is described below.

1.3.3.1. Coral communities
         Coral population structure and relative abundance are influenced by disturbances (Bak and Meesters,
1998). The point-quadrat method is used to collect data for coral community analysis (Houk et al., 2005). Along
each 50-m transect deployed, two teams consisting of four divers used the point-quadrat method to record the
benthos with a 1-m2 quadrat frame tossed haphazardly every 5 m. A total of 20 quadrats (10 per team) were
tossed per transect (60 quadrats per site). The quadrat used to record the benthos was partitioned into 25
sections with string, providing 16 points of intersection. The reef benthos under each intercept was recorded to
the genus level. The benthic survey focused on measuring the percent cover of hard coral, crustose coralline
algae (CCA), pavement (mainly turf algae < 1 cm in height [Steneck, 1988], and carbonate substrate), and
macro-algae (>1 cm in height [Steneck, 1988]).

1.3.3.2. Coral colony size
         At every 20 m interval, a quadrat was tossed haphazardly to record coral communities for a total of six
quadrats per site. Coral colony sizes were measured within each 1-m2 quadrat. The surface area of a coral within
the quadrat was obtained by measuring the maximum length and width (perpendicular to length) along the

                                                         9
general contour of each colony. A coral was only included in the quadrat if at least half of the colony fell within
the edges of the quadrat frame. Information obtained from this method included population densities and
geometric diameters. For geometric diameter (cm), colonies were grouped into four size classes (see Section
1.3.4.2 below); class A colonies were considered new recruits for this survey.
1.3.3.3. Macro-invertebrates & fish
Macro-invertebrates were surveyed using a belt size of 2 m along the 50-m transects (1 m on each side
of transect). A belt size of 5 m (2.5 m on each side of transect) was used for fish surveys. Identifications were
made to the highest taxonomic resolution possible (i.e., genus and species). Common names were obtained
from the Cook Islands Biodiversity website where possible.
1.3.3.4. Biological diversity
For each island, an identification checklist was generated for all coral, macro-invertebrates, and fish
identified. Identifications were made to the highest taxonomic resolution possible (i.e., genus and species) for
the purposes of adding to the species inventory for the Cook Islands. Photographs were taken of all species
when possible, and some samples collected for identification purposes using taxonomic references or outside
taxonomic expertise. Species identification were verified using Randall and Myers (1983), Myers (1989, 1999),
Veron (2000), Randall (2005), photographs provided by Gustav Paulay, and www.fishbase.com. In addition to
the above-mentioned surveys, the team also carried out algal sampling to examine the abundance and
distribution of ciguatoxic dinoflagellates among these islands; results of this sampling will be presented in a
separate report.
1.3.4. Data analysis
Microsoft Excel spreadsheet, PivotTable, and PivotChart were used for basic computations. PRIMER 6
and STATISTICA 12 software were used for graphical and comparative analysis.
1.3.4.1. Percent cover calculations
For benthic communities, the total number of points recorded for each category identified using the
Point-quadrat method was divided by 160 (total number of intersects per quadrat x 10 quadrats), and multiplied
by 100 (see Eq. 2).
(2) Percent cover = Category sum per transect x 100%
160
An average percent cover for each site was calculated from the replicates.
101.3.4.2. Colony size calculation
The area of each colony was calculated using Eq. 3a, b and c:
(3a) Geometric diameter = (length · width)1/2
(3b) Colony area = π · (Geometric diameter/2)2
(3c) Population density (colonies per m2) = n/6 m2
where n is the total number of colonies of any given species and 6 m2 is the total area surveyed using 6 quadrat
tosses per site.
Size classes were sorted into four categories based on geometric diameter: A (< 4 cm), B (4 to < 8 cm),
C (8 to < 16 cm), D (16 to < 32cm), and E (≥ 32 cm).
1.3.4.3. Average density
Average density for macro-invertebrates and fish were calculated for each site using Eq. 7:
(7) Average density = Number of individuals per site / number of replicates
Belt area (100 m2 for invertebrates and 250 m2 for fish)
1.3.4.4. Species diversity (see Clark and Warwick, 1994 for details).
Species diversity for corals and fish were measured using the Shannon – Weiner index (H`), seen in Eq. 4:
(4) H` = - ∑i pi (log pi)
where H` is the index of species diversity, and pi is the proportion of total count belonging to the ith species.
Margalef’s species richness (d) is a measure of the number of species present, making some allowance for the
number of individuals. Species richness is calculated using Eq. 5 (S = number of species; N = number of
individuals):
(5) d = (S - 1)
log (N)
Pielou’s evenness (J`) is a measure of equitability or how evenly individuals are distributed among
different species. Evenness is calculated using Eq. 6:
(6) J` = H`
log (S)
PRIMER 6 software was used to generate these indexes.
1.3.4.5. Statistical analysis
Comparative analysis was carried out on benthic categories, macro-invertebrates, and fish communities
to determine relationships between sites. PRIMER 6 was used to generate a Principal Component Analysis
(PCA), vector plots, and ordination of data using 2D plots. Bubbles on 2D plots were used for graphical
representation of the respective categories. Mean error plots were generated using STATISTICA 12.
112. PROFILE AND RESULTS BY ISLAND
2.1. AITUTAKI
2.1.1. Site characteristics
Aitutaki (Figure 5) is located around 18º 53’ S and 159º 46’ W, and approximately 263 km north of
Rarotonga. In 2011, the total population was 2,038, which has remained relatively stable in the last 10 years;
Aitutaki is the second most populated island in the southern Cook Islands after Rarotonga, who has a population
of 13,095 (Cook Islands Census, 2011). Geologically, the island is an almost-atoll around 18 km2 in area, with a
substantial residual volcano about 124 m high aged ~8.1 million years. The mainland is about 16 km2 in area with
a moderate-sized lagoon and 15 small islands (motu) around its perimeter. This predominantly sandy lagoon,
which hosts a range of marine organisms, is one of the most beautiful lagoons in the world that provides many
benefits to the people of Aitutaki. These benefits include food resources, recreational activities, and ecotourism.
Increasing development in the last twenty years to meet the demand of the tourism industry, along with reef
disturbances (e.g., global warming, COTS outbreaks, coral disease, and cyclones), pose threats to the existence
of this delicate ecosystem.
Over the last 20 years, several coral reef surveys have been conducted in Aitutaki that have been
critical in our understanding of temporal changes on these reefs. During the 1990s, the reefs of Aitutaki went
through several natural disturbances; a bleaching event in the early 1990s followed by a COTS outbreak, which
degraded the reef to its current state (Rongo, 2008; Bruckner, 2013). On the CIMP research team’s visit to
Aitutaki on 29 July 2013, two of the sites surveyed in 2008 were re-surveyed to serve as a practice for the team.
Aitutaki was not a focus on this trip because a previous research team from the Living Oceans Foundation had
extensively surveyed the fore reefs of Aitutaki a few months prior to our visit in May (although the majority of their
information has not yet been submitted to the relevant ministries in the Cook Islands Government). Only benthic
communities and macro-invertebrate data from the research team’s practice surveys were included in this report.
Figure 5. Map of Aitutaki with yellow dots indicating the
two sites surveyed during this expedition; these two
sites were established in 2008 (see Rongo, 2008).
Green area near motu Maina indicates the area where
the team conducted a snorkeling tour as part of the
survey preparation. Taken from Google Earth.
122.1.2. Benthic communities
Hard coral cover and crustose coralline algae (CCA) in this survey were compared with results from two
sites established in the 2008 survey (Rongo, 2008). A significant decline in hard coral cover was noted when
compared with survey data from 2008 (Figure 6); cover at Site 1 declined from 34 % ± 0.01 (SE) to < 1 % ± 0.16
(SE) in 2013, while Site 2 declined from 14 % ± 1.44 (SE) to 1 % ± 0.55 (SE) in 2013. However, CCA at both
sites did not show a significant change over time.
120
CCA Mean; Whisker: Mean±0.95 Conf . Interv al
Average percent cover (%)
100 Hard coral
80
60
40
20
0
Site 1 (2008) Site 1 (2013) Site 2 (2008) Site 2 (2013)
Site
Figure 6. Comparison of the average percent cover of crustose coralline algae (CCA) and hard coral from two fore reef sites
surveyed in Aitutaki in 2008 (see Rongo, 2008), and resurveyed in 2013. Site 1 is off of Pacific Resort and Site 2 is off of
the Alexander wreck.
2.1.3. Macro-invertebrate communities
Site 1 had significantly higher densities of the pale burrowing urchin (Echinometra mathaei) when
compared with Site 2 (Figure 7). The giant clam (Tridacna spp.) was uncommon on the fore reef, with the
average density < 1 individual per 100 m2 at Site 2. The average density of the great worm-snail (Dendropoma
maxima) was 14 ± 8 (SE) individuals per 100 m2 at Site 2, and 8 ± 3 (SE) individuals per 100 m2 at Site 1. Other
invertebrates not plotted because of low numbers on the transects included trochus (Tectus niloticus), COTS
(Acanthaster planci), and flatworms (Pseudobiceros spp.).
200
Mean; Whisker: Mean±0.95 Conf . Interv al
180
Average density (indiv./100 m 2)
160
140 Tridacna maxima
Dendropoma maxima
120
Echinometra mathaei
100
80
60
40
20
0
Ait 1 Ait 2
Site
Figure 7. Average density of macro-invertebrates from two fore reef sites surveyed in Aitutaki in 2013. Ait 1 is a site off of
Pacific Resort, and Ait 2 is a site off of the Alexander wreck.
132.1.4. Discussion
While the 2008 survey indicated that Aitutaki’s reefs were recovering from previous reef disturbances in
the 1990s and 2000s (Rongo, 2008), recovery appeared to be limited to shallow fore reef slopes (< 10 m) and
reefs on the deeper slopes (> 15 m) had not recovered. The average coral cover at Site 1 (referred to as the
Pacific Resort in 2008) was reported at 34% (Rongo, 2008), but declined to < 1% in 2013. Figure 8 shows a
much healthier coral community in 2008 (top left) than that observed in 2013 (top right); most corals at this site
were destroyed with the exception of a few encrusting type species. This decline in coral cover was likely a result
of the impact of Cyclone Pat in 2010, and to a larger extent COTS infestation over the years (Rongo, 2008;
Bruckner, 2013). The lagoon area of Aitutaki close to the main island was observed to be dominated by a variety
of algal species (Figure 8 bottom left); extensive areas of the lagoon around Arutanga and the habour site were
dominated by the green alga Boodlea spp. (Figure 8 bottom right). Also, coral species that thrive in turbid
environments were commonly observed within the lagoon (Figure 9 left). In support, Total Suspended Solids
(TSS; a parameter to measure water clarity; data obtained from MMR) were above the threshold level considered
detrimental to coral reefs (e.g., Larcombe et al., 1995; see also George et al. [2007] and reference therein) in
most of the coastal waters around the main island of Aitutaki (Figure 9 right); high TSS were likely attributed to
past dredging activities within the lagoon of Aitutaki.
2008 2013
Figure 8. Top: Fore reef site off of Pacific Resort (Site 1), photographed in 2008 and 2013 by Teina Rongo. Note: pictures
were not taken from the same location, but were from the same general area. Bottom left: algal assemblages of a variety of
algae that dominated the benthos in well-flushed lagoon areas around the harbor in 2013. Bottom right: a Porites coral
getting overgrown by a green alga, Boodlea spp.; this alga covered an extensive area within the lagoon that was relatively
sheltered in 2013. Photo taken by Teina Rongo.
14Mean; Whisker: Mean±0.95 Conf. Interval
20 Pacific Resort
Arutanga Wharf
Maina Sunset
Waste Management
16 Tautu Wharf
TSS (mg/L)
Tepaki
12
8
4
0
2008 2009 2010 2011 2012
Year
Figure 9. Left: Coral communities consisting of species that thrive in turbid environments. Photo taken by Teina Rongo.
Right: Total Suspended Solids (TSS [mg/L]) recorded for selected sites along the coast of the Aitutaki main island monitored
by the Ministry of Marine Resources; dotted red line indicates the threshold level of TSS (4 mg/L) considered detrimental for
coral reefs.
Incidentally, Coralline Lethal Orange Disease (CLOD) was noted occasionally on coralline algae at Site
2 (Figure 10). CLOD was first identified in Aitutaki in 1992 by Littler and Littler (1995), which was reported to
have affected an extensive area of Aitutaki’s reef slopes. Crustose coralline algae (CCA) was the most dominant
substrate on the fore reef at Site 2 in 2008 as well as in 2013; this is an indication that conditions are set for
recovery to occur (e.g., Harrington et al., 2004). However, CLOD is a concern given the role that CCA plays in
cementing together sand, dead corals, and debris to create a stable substrate for coral recruits. Furthermore,
Littler and Littler (1995) indicated that reefs affected by CLOD have a tendency to shift from being CCA- and
coral-dominated to being dominated by turf and fleshy algae. Because of time constraints, the team was unable
to examine the severity of CLOD on Aitutaki during this trip. It would be useful to carry out a follow-up study on
this disease, not only on Aitutaki but also the other islands in the southern Cook Islands group.
Dead tissue
Live tissue
Figure 10. Coralline Lethal Orange Disease (CLOD) found on the fore reef of Aitutaki; in both photos, white area indicates
dead tissue of the coralline algae Porolithon onkodes, with the orange band indicating the active area of the disease. Photos
taken by Mareike Sudek.
15A recent reef survey conducted in Aitutaki by the Living Oceans Foundation in May 2013, indicated that
COTS predation has decimated fore reef corals on the leeward side of Aitutaki and advanced to the windward
side. In our observations, the COTS damage appeared to be limited to the fore reef. A few COTS were noted
(Figure 11) in a brief snorkel tour into the lagoon area along the entire western back reef (see Figure 5; near
Maina). However, healthy reef communities still exist in the lagoon (Figure 12), which could serve as source
populations for the recovery of fore reef areas around the island. COTS in the lagoon may become problematic
in the future, therefore the people of Aitutaki should continue to physically remove them from areas where
healthy coral communities still exist.
Figure 11. Crown-of-thorns starfish (Acanthaster planci) were found within the back reef area of Maina on the western side
of the Aitutaki lagoon during a brief snorkel trip conducted by the team. Photo taken by Barbara Hanchard.
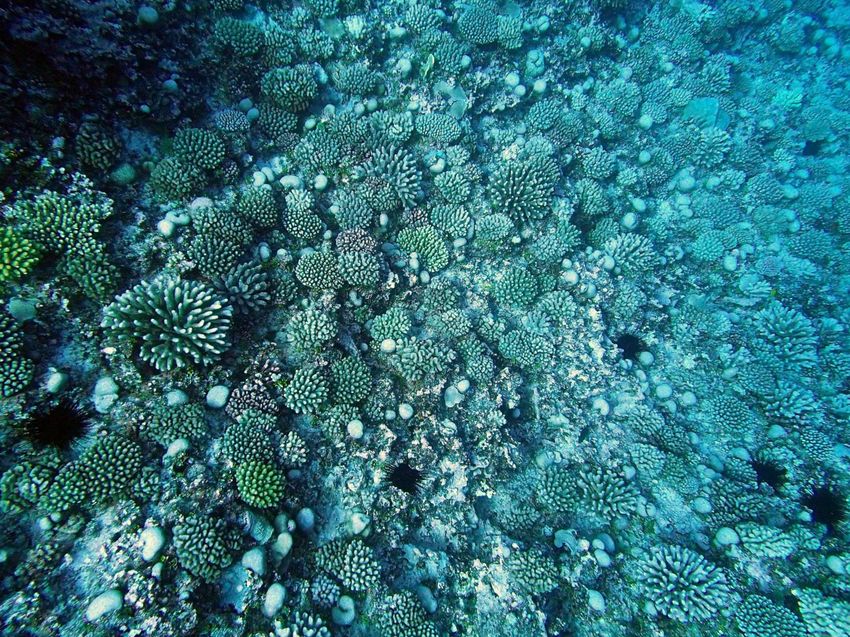
16Figure 12. Back reef of the Maina area. Top: branching Acropora spp. with clouds of blue-green chromis (Chromis viridis)
and some humbug dascyllus (Dascyllus aruanus) hovering above the coral colonies. Photo taken by Graham McDonald.
Bottom: diverse community of branching coral Acropora spp. Photo taken by Teina Rongo.
172.2. MANUAE
2.2.1. Site characteristics
Manuae (Figure 13) is a small atoll approximately 16 km2, located about 87 km southeast of Aitutaki
(19º 16’S 158º 57’W). Although Manuae is currently uninhabited with minimal anthropogenic stresses, the island
in the earlier part of the 1990s was inhabited and exporting copra. The pristine coral reef ecosystem on Manuae
invites the development of the island as a tourist destination. As an effort to develop Manuae for ecotourism, a
dirt airstrip that could cater for small aircraft was established. However, this idea did not come to fruition. Today,
the island’s marine resources (in particular reef fishes and marine invertebrates) are intermittently exploited by
local fishing parties from Aitutaki and, to lesser extent, from Rarotonga. Manuae is now the only remaining
island in the southern Cook Islands with very high densities of Tridacna clams.
Several reef surveys have been carried out on Manuae. The Ministry of Marine Resources conducted
an assessment from 1994 – 1997 (Ponia et al., 1998a) to identify ideal sites for establishing Marine Protected
Areas on the island, while the National Environment Service carried out a coral reef survey in 2005 to establish
baseline information for the island (Rongo et al., 2005). According to the 2005 report, Manuae’s fore reefs were
depauperate of corals (e.g., 7% and 8% cover on windward and leeward exposures respectively). However, the
complexity of reef structure — particularly on the leeward exposure — suggested that a much healthier and
diverse reef community existed here in the past, possibly destroyed by COTS outbreaks. Because the prevailing
ocean current around Manuae is westward (towards Aitutaki), it was suggested that Manuae is a potential source
population for Aitutaki, and its establishment as a Marine Protected Area may be critical for the recovery of
Aitutaki’s reefs (see Rongo et al., 2005).
Previous studies examined both the fore reef and the lagoon areas of Manuae, however this survey was
limited to fore reef areas due to accessibility issues into the lagoon from the research vessel. In addition, much
of the survey was limited to the leeward exposure of the island because of large swells experienced during the
visit. Consequently, only one of the two fore reef sites established in 2005 (Rongo et al., 2005) was resurveyed
(Site 1 in Figure 13).
Figure 13. Map of Manuae with yellow dots
indicating the fore reef sites surveyed
during this expedition. Green star indicates
one of the fore reef sites established in
2005 (Rongo et al., 2005) that could not be
resurveyed in 2013 due to rough conditions
on this expedition. Taken from Google
Earth.
182.2.2. Benthic communities
Average hard coral cover on Manuae ranged from 28% ± 2 (SE) at Site 5 to 41% ± 4 (SE) at Site 1
(Figure 14). Halimeda spp. (Figure 15) was the most common macro-algae recorded, with large patches of this
species reported at Site 5. The average cover for macro-algae ranged from 3% ± 1 (SE) at Site 3 to 16% ± 4
(SE) at Site 5. Although filamentous turf algae were not recorded in a separate category (grouped into the
‘pavement’ category in this survey), turf algae were particularly common at Site 4, where corals recently killed by
the yellow-band disease and COTS predation were recorded.
60
Mean; Whisker: Mean±0.95 Conf. Interval
CCA
50 Macro-algae
Hard coral
Average percent cover (%)
40
30
20
10
0
Man 1 Man 2 Man 3 Man 4 Man 5
Site
Figure 14. Average percent cover of crustose coralline algae (CCA), macro-algae, and hard coral from five fore reef sites
surveyed in Manuae in 2013.
Figure 15. Halimeda spp.,
the most common macro-
algae on the fore reefs of
Manuae. Photo taken by
Teina Rongo at Site 5.
19At Site 1, average hard coral cover of 41% ± 5 (SE) in this survey was significantly higher than the 10%
± 2 (SE) recorded in 2005 (Figure 16). On the contrary, pavement (called turf algae in 2005) showed a
significant decline from 80% ± 1 (SE) to 24% ± 5 (SE) in 2013, while CCA cover showed no significant difference
between 2005 and 2013.
90 Mean; Whisker: Mean±0.95 Conf. Interval
Hard coral
80
Average percent cover (%)
Pavement
70 CCA
60
50
40
30
20
10
0
Site 1 (2005) Site 1 (2013)
Site
Figure 16. Comparison of the average percent cover of hard coral, pavement, and crustose coralline algae (CCA) from one
fore reef site surveyed in Manuae in 2005 (Rongo et al., 2005), and resurveyed in 2013.
A total of 25 species of hard corals representing 8 families were recorded (Appendix B). Because of
rough conditions, only Site 2, 4, and 5 were used to gather information on coral diversity (i.e., total number of
species, number of individuals, species richness, evenness, and species diversity). All categories were the
highest at Site 5 (Table 1). Acropora schmitti (Figure 17 a,b) was one of the most common coral species on
shallow fore reef slopes of Manuae; A. schmitti is a more fragile coral species, and broken branches reattaching
to the substrate were observed in some areas. The ability of this species to reproduce via fragmentation may
explain its high density at some locations on Manuae. Astreopora expansa was the dominant coral species on
steeper reef slope areas (Figure 17 c,d).
Table 1. Species diversity of hard corals at Sites 2, 4, and 5 in Manuae surveyed in 2013. S is the total number
of species; N is the number of individuals; d is the Margalef’s species richness; J` is Pielou’s evenness; H` is the
Shannon-Wiener diversity index. Red number indicates highest in each category
Site S N d J' H'(loge)
Man 2 21 137 4.065 0.8392 2.555
Man 4 22 146 4.214 0.8547 2.642
Man 5 25 149 4.796 0.8556 2.754
20a b
c d
Figure 17. a & b) Acropora schmitti, one of the most common coral species on the shallow fore reef slopes of Manuae; c & d) Astreopora expansa, a hard coral that was
dominant on the steeper reef slope areas. Photos taken by Teina Rongo.
212.2.3. Macro-invertebrate communities
Although highly variable, the giant clam (Tridacna maxima) were frequently recorded on the fore reef.
The average density of Tridacna clams ranged from 8 ± 6 (SE) individuals per 100 m2 at Site 4 to 36 ± 6 (SE)
individuals per 100 m2 at Site 5 (Figure 18). With the exception of Site 5 where the average density of the pale
burrowing urchin (Echinometra mathaei) was recorded at 88 ± 32 (SE) individuals per 100 m2, urchins were not
common at all sites. Interestingly, COTS (Acanthaster planci) were observed at Site 4, with a dozen recorded in
a 5-minute swim at depths of around 12 – 20 m. Other invertebrates recorded but not plotted because of low
numbers include the great worm-snail (Dendropoma maxima), the Christmas-tree worm (Spirobranches spp.),
the spider conch (Lambis lambis), the esculator urchin (Echinostrephus aciculatus), and the daytime octopus
(Octopus cyanea) (Appendix C).
Mean; Whisker: Mean±0.95 Conf. Interval
240 Echinometra mathaii
Echinothrix diadema
220 Diadema savignyi
Tridacna spp.
Average density (indiv./100 m 2)
200
180
100
80
60
40
20
0
Man 1 Man 2 Man 3 Man 4 Man 5
Site
Figure 18. Average density of macro-invertebrates from five fore reef sites surveyed in Manuae in 2013. Only the common
invertebrates were included in the plot. Note: a break in the y-axis was implemented between 100 and 170 individuals per
100 m2.
222.2.4. Fish communities
A total of 66 fish species representing 17 families were recorded on Manuae (Appendix D). Site 1 had
the highest number of species, number of individuals, and species richness. Site 3 had the highest evenness and
Site 5 had the highest diversity index (Table 2). Pomacentrids were most abundant, with average density ranging
from 56 ± 10 (SE) individuals per 250 m2 at Site 3 to 617 ± 9 (SE) individuals per 250 m2 at Site 1 (Figure 19).
Average density of Labrids ranged from 15 ± 1 (SE) individuals per 250 m2 to 44 ± 15 (SE) individuals per 250
m2. Average density of Acanthurids ranged from 0 to 19 ± 6 (SE) individuals per 250 m2. Average density of
Cirrhitids were below 14 individuals per 250 m2 at all sites. Bigeye trevally (Caranx sexfasciatus) was one of the
larger schooling fish species observed on Manuae at Site 1 (Figure 20 top); a similar school was also reported at
this site in 1995, but not in 2005. The purple queen anthias (Pseudanthias pascalus) were also very common,
particularly on steeper fore reef slopes (Figure 20 bottom).
Table 2. Species diversity of fish at sites surveyed in Manuae in 2013. S is the total number of species; N is the
number of individuals; d is the Margalef’s species richness; J’ is Pielou’s evenness; H’ is the Shannon-Wiener
diversity index. Red number indicates highest in each category.
Site S N d J’ H’(loge)
Man 1 41 2152 5.212 0.4467 1.659
Man 2 36 1135 4.976 0.4091 1.466
Man 3 14 258 2.341 0.7143 1.885
Man 4 38 1582 5.023 0.4185 1.522
Man 5 31 886 4.420 0.5491 1.886
800
Mean; Whisker: Mean±0.95 Conf. Interval
Average density (indiv./250 m2)
700 POMACENTRIDAE
LABRIDAE
600 ACANTHURIDAE
CIRRHITIDAE
500
400
300
200
100
0
Man1 Man 2 Man 3 Man 4 Man 5
Site
Figure 19. Average density of fish by family (Pomacentridae, Labridae, Acanthuridae, and Cirrhitidae) from five fore reef
sites surveyed in Manuae in 2013.
23Figure 20. Top: Bigeye trevally (Caranx sexfasciatus) at the main passage at Site 1. A similar school of this size was
observed in 1995, but not recorded in the 2005 survey. Bottom: Aggregates of the purple queen anthias (Pseudanthias
pascalus) at Site 5. Photos taken by Graham McDonald.
242.2.5. Discussion
Due to rough sea conditions experienced on Manuae, the team could not survey the windward exposure
of the island. However, spot checks indicated that hard coral cover was similar to that of the leeward side, with
Astreopora expansa dominant particularly on steeper fore reef slopes. A comparison with the 2005 survey
indicated a 30% increase in coral cover, which suggests that this reef has been recovering. A compilation of
surveys from 2,667 Indo-Pacific coral reefs showed that average hard coral cover was 22.1% in 2003 (Bruno &
Selig, 2007); Manuae’s average coral cover at all sites ranged from 28% to 41%, which is considered above
average based on this Indo-Pacific study.
Pomacentrids were the most abundant fish family on the fore reefs of Manuae, which was comparable
to the average density estimated in 2005 (see Rongo et al., 2005). In 2005, Pomacentrids averaged over 500
individuals per 250 m2 at Site 1, while the current survey estimated over 600 individuals per 250 m 2 at the same
site. However, there was a noted difference in Acanthurid abundance where the average density was
approximately 44 individuals per 250 m2 at Site 1 in 2005, but decreased to around 16 individuals per 250 m2 in
2013. These changes in Acanthurid abundance may be attributed to changes in reef state that has seen a
significant increase in hard coral cover and decrease in turf algal cover (see Figure 16).
Interestingly, Tridacna clam density seemed to have increased at fore reef sites in 2013 compared with
2005 (Rongo et al., 2005). For example, clam density at Site 1 was estimated at 4 individuals per 100 m 2 in
2005, which increased to 21 individuals per 100 m2 in 2013. However, the results of this survey are not enough
to suggest that clam density on the fore reef has increased significantly since 2005, considering that only one
site was resurveyed. A brief snorkel trip into the lagoon around the main channel entrance indicated that T.
maxima were abundant (Figure 21). In 2005, there were concerns raised that marine resources on Manuae may
be experiencing heavy fishing pressure from frequent visits by Aitutaki fishermen (Rongo et al., 2005). Ciguatera
poisoning may have prompted these visits in the mid-1990s to 2000s as ciguatera was problematic in Aitutaki
during this period, and Manuae’s reef fish were unaffected. However, these visits may have declined in recent
years due to the decline in the incidence of ciguatera in Aitutaki (Rongo & van Woesik, 2013), considering that
trips to Manuae are risky and expensive.
Despite the improvement of Manuae’s reefs since 2005, there were signs of stress in 2013 that could
potentially be a serious concern. For example, an extensive area at Site 4 was observed to have coral disease
(likely yellow-band disease; Figure 22 a ̶ d) and COTS. While the disease was more apparent on the most
dominant species Astreopora expansa, it was also found on other corals (i.e., Millepora platyphylla, Acropora
schmitti, Montastrea curta, Acropora humilis, Pocillopora meandrina, Pavona maldivensis, and Cyphastrea
chalcidicum). This site also had the highest number of COTS noted during a 5-minute swim (covering an area of
approximately 5000 m2) where nine starfish were counted (approximately 1800 starfish per km2), which may be
an indication of an outbreak occurring. For example, Moran & De`ath (1992) suggested that a density of 1500
starfish per km2 is an indication of an outbreak.
25The loss of coral on Manuae prior to 2005 is unknown, and there are no reliable records of any major
outbreaks of COTS in the past. Considering that COTS outbreaks and, in particular, coral disease are normally
associated with anthropogenic influences (e.g., Ward & Lafferty, 2004; Brodie et al., 2005), with Manuae being
uninhabited it will be critical at this point to carry out a more detailed survey on COTS and coral disease to help
us understand the natural variables that are causing it.
Figure 21. High densities of the small giant-clam (Tridacna maxima) were observed within Manuae’s lagoon.
Photo taken by Teina Rongo.
26a b
c d
Figure 22. Coral disease was noted at Site 4 on Manuae, where an extensive area was affected. Disease lesions were apparent on large, platy Astreopora colonies (a & c). Other species were also
infected, such as Millepora platyphyla (b) and Acropora spp. (d) where turf algae have overgrown the recently killed colony. Red arrow indicates area of the disease. Photos taken by Teina Rongo.
272.3. MITIARO
2.3.1. Site characteristics
Mitiaro (Figure 23), located at 19º 52’S 157º 41’W, is one of three sister islands in the southern group
that includes Mauke and Atiu, with the three commonly referred to as Ngaputoru. This sunken island, dated
around 12.3 million years old, was uplifted by tectonic activity associated with the formation of Rarotonga. During
this period of uplift, the raised coral island, or makatea, reached a maximum elevation of around 11 m. The reefs
of Mitiaro are fringed with places partially overlain by a sequence of late Pleistocene reef limestone. The total
land area of the island is approximately 22 km2 and the circumference of the bench reef is approximately 18 km.
Mitiaro has a population of under 300 people, residing mainly in the village of Taka`ue.
To date there has been limited amount of marine research that has been conducted on Mitiaro. In 1998,
a baseline assessment was carried out by the Ministry of Marine Resources (Ponia et al., 1998b) to quantify
exploitable marine resources on the reef flat area. In 2002, a coral reef assessment was conducted on the fore
reef (Lyon 2002) as part of an Environmental Impact Assessment undertaken by the National Environment
Service for a proposal by Government to upgrade the harbour. Both surveys were important in providing some
baseline information for the island.
A total of six sites were surveyed on Mitiaro on this expedition (see Figure 23). Rough sea conditions
experienced limited the survey to the leeward exposure, and only spot checks could be carried out on the
windward exposure. Sites established in 2002 were revisited (Site 3, 5, & 6) at the request of the island mayor to
assess the damage, if any, to reef communities as a result of the recent upgrade of Mitiaro Harbour in 2011.
Figure 23. Map of Mitiaro with yellow dots
indicating the sites surveyed during this
expedition. Site 3, 5, and 6 were
established in 2002 (Lyon, 2002) and were
revisited in 2013. Image taken from Google
Earth.
282.3.2. Benthic communities
The average hard coral cover on Mitiaro ranged from 24 % ± 3 (SE) at Site 3 to 42% ± 5 (SE) at Site 6
(Figure 24). Although Halimeda spp. was the most common macro-algae recorded on Mitiaro with cover ranging
from 2% ± 1 (SE) to 7% ± 2 (SE), these were not recorded at the harbour sites. Cover of CCA ranged from <
1% to 7% ± 2 (SE) at all sites.
60
Mean; Whisker: Mean±0.95 Conf. Interval CCA
Macro-algae
50
Average percent cover (%)
Hard coral
40
30
20
10
0
Mit 1 Mit 2 Mit 3 Mit 4 Mit 5 Mit 6
Site
Figure 24. Average percent cover of crustose coralline algae, macro-algae, and hard coral from six fore reef sites surveyed
in Mitiaro in 2013.
Comparison of results with 2002 showed a 20% increase in hard coral cover at Site 5, and a 23%
increase at Site 6 (Figure 25); these sites are located on either side of the harbour entrance. However, no
significant change in coral cover was noted at the control site (Site 3), established on the northern exposure of
Mitiaro away from the harbour sites. Recently killed coral colonies were only recorded at the harbour sites (Site 5
and 6), with an average percent cover of 6% and 3% respectively (see Figure 25).
60 Mean; Whisker: Mean±0.95 Conf. Interval
Dead coral
Hard coral
Average percent cover (%)
50
40
30
20
10
0
Site 5 (2002) Site 5 (2013) Site 6 (2002) Site 6 (2013) Site 3 (2002) Site 3 (2013)
Site
Figure 25. Comparison of the average percent cover of hard coral and dead coral from two fore reef sites off Mitiaro Harbour
surveyed in 2002 (Lyon, 2002), and resurveyed in 2013.
29Dead coral colonies noted at the harbour sites (Sites 5 & 6) were largely from one of the most dominant
genera Pocillopora (Figure 26a) (with some species of Acropora as well) that were in close proximity to the
harbour entrance. Dead colonies at this location were covered by turf or cyanobacteria. Mats of the same
cyanobacteria were observed at shallow depths in this area, particularly around the harbour entrance.
a b
Figure 26. a) Dead coral species predominantly from the genera Pocillopora, noted in close proximity to the harbour
entrance. b) Large colonies of Pocillopora spp., which is one of the most dominant hard coral on the leeward exposure of
Mitiaro; photo taken on the northern side of the harbour by Teina Rongo.
A total of 25 species of hard corals representing 8 families were recorded on Mitiaro (see Appendix B).
Site 1 on the leeward exposure had the highest total number of species, species richness, and species diversity,
whereas Site 3 had the highest number of individuals and evenness (Table 3). Large colonies of Pocillopora spp.
(Figure 26b) were common at depths < 12 m on the western exposure, with some colonies reaching a diameter
of close to 1 m. On the steeper reef slopes (> 12 m), impressive plate-like growth forms of Astreopora expansa
were dominant. This pattern of distribution was observed at all fore-reef locations on the island.
Table 3. Species diversity of hard corals at Sites 1, 2, and 3 in Mitiaro surveyed in 2013. S is the total number of
species; N is the number of individuals; d is the Margalef’s species richness; J` is Pielou’s evenness; H` is the
Shannon-Wiener diversity index. Red number indicates highest in each category.
Site S N d J’ H’(loge)
Mit 1 22 145 4.220 0.8130 2.513
Mit 2 18 138 3.450 0.7801 2.255
Mit 3 17 206 3.003 0.8278 2.345
Astreopora expansa (Figure 27a) was the most dominant coral species on the steeper reef-slopes of
Mitiaro, forming terraces of thick plates. Figure 27b shows both A. expansa and Acropora schmitti, which are the
two most dominant coral species at the Airport site (Site 3).
30You can also read


