Mozambique Operational Plan - (COP/ROP) 2017 Strategic Direction Summary
←
→
Page content transcription
If your browser does not render page correctly, please read the page content below
Mozambique Operational Plan
(COP/ROP) 2017
Strategic Direction Summary
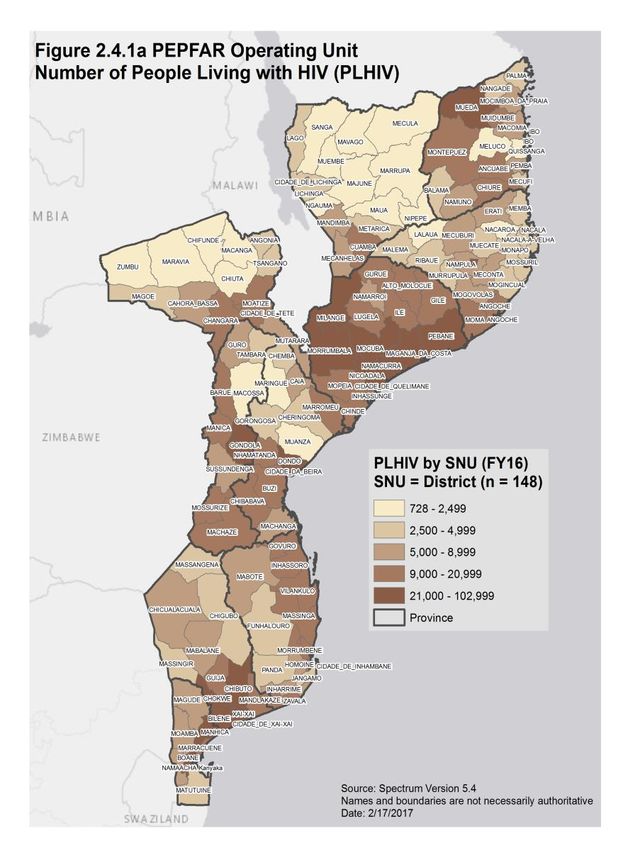
Table of Contents

1.0 Goal Statement ....................................................................................................................................... 4
2.0 Epidemic, Response, and Program Context ............................................................................................ 6
   2.1 Summary statistics, disease burden and country profile.................................................................... 6
   2.2 Investment Profile............................................................................................................................. 15
   2.3 National Sustainability Profile Update .............................................................................................. 20
   2.4 Alignment of PEPFAR investments geographically to disease burden ............................................. 20
   2.5 Stakeholder Engagement .................................................................................................................. 22
3.0 Geographic and Population Prioritization............................................................................................. 25
4.0 Program Activities for Epidemic Control in Scale-Up Locations and Populations ................................ 27
   4.1 Targets for scale-up locations and populations ................................................................................ 27
   4.2 Priority Populations Prevention ........................................................................................................ 40
   4.3 Voluntary Medical Male Circumcision (VMMC)................................................................................ 41
   4.4 PMTCT ............................................................................................................................................... 41
   4.5 HIV Testing and Counseling .............................................................................................................. 44
   4.6 Facility and Community-Based Care and Support ............................................................................ 47
   4.7 TB/HIV ............................................................................................................................................... 48
   4.8 Adult Treatment ................................................................................................................................ 50
   4.9 Pediatric Treatment .......................................................................................................................... 51
   4.10 OVC ................................................................................................................................................. 53
   4.11 Addressing COP17 Technical Considerations.................................................................................. 54
   4.12 Commodities ................................................................................................................................... 58
   4.13 Collaboration, Integration and Monitoring..................................................................................... 58
5.0 Program Activities for Epidemic Control in Attained and Sustained Locations and Populations ......... 61
   5.1 Targets for Attained and Sustained Locations and Populations ....................................................... 61
6.0 Program Support Necessary to Achieve Sustained Epidemic Control .................................................. 66
   6.1 Critical Systems Investments for Achieving Key Programmatic Gaps............................................... 66
   6.2 Critical Systems Investments for Achieving Priority Policies ............................................................ 67
   6.3 Proposed system investments outside of programmatic gaps and priority policies. ....................... 67
7.0 Staffing Plan .......................................................................................................................................... 68

2|Page
APPENDIX A: Prioritization .......................................................................................................................... 70
APPENDIX B: Budget Profile and Resource Projections .............................................................................. 75
APPENDIX C: Tables and Systems Investments for Section 6.0 .................................................................. 77
APPENDIX D: Zambezia Action Plan (ZAP) .................................................................................................. 78
APPENDIX E: Preliminary Revised PLHIV Estimates ................................................................................... 87
APPENDIX F: Acronym List .......................................................................................................................... 90

3|Page
1.0 Goal Statement
The overarching goal of the United States Government (USG) for the President's Emergency Plan
for AIDS Relief (PEPFAR) in Mozambique is to support country efforts to achieve epidemic
control by 2020 through evidence-based policies and interventions to drive progress and save
lives.

PEPFAR will achieve this goal by working with the Mozambican National HIV/AIDS Control
Program and with the National AIDS Council (CNCS), Global Fund (GFATM), UNAIDS, civil
society, and other multilateral and implementing partners to design, implement, coordinate, and
monitor a cohesive, ambitious strategy to achieve epidemic control.

Analysis of available data and consultations between the National HIV/AIDS Control Program
and PEPFAR resulted in ambitious targets and a focus on the provinces and districts with the
highest unmet need for HIV services. COP17 includes targets to enroll 375,202 new people living
with HIV (PLHIV) into care and treatment services and to maintain 1,262,208 PLHIV on
treatment. In this COP, PEPFAR-Mozambique has reclassified priority districts based on
estimates of progress in achieving adequate coverage for epidemic control. There are 85 Scale-Up
districts as compared to 78 for COP16, 27 of which were reclassified as Aggressive Scale-Up to step
up the efforts in Gaza, Inhambane, Maputo Province, Niassa, Sofala and Zambezia. All Scale-Up
districts will receive focused support to expand access to and utilization of HIV prevention and
care and treatment services.

In addition to geographic shifts, tailored programming will be delivered to populations who are at
elevated risk for HIV acquisition and are currently under-served. Efforts will reach young people
in high-burden districts aged 15 – 29, retain pregnant women and children on treatment, improve
EID access and linkage, expand programming for key populations (MSM, FSW, prisoners, PWID)
and priority populations (miners, clients of sex workers, etc.), and reduce the gap between the
proportion of men and women initiating ART.

The Government of the Republic of Mozambique (GRM) has made a commitment to evidence-
based policies essential to achieving epidemic control, including nationwide implementation of
Test and Start (T&S) in 2018, differentiated service delivery approaches, and routine viral load
testing. Simultaneously, PEPFAR is committed to intensive management of implementing
partners, with improved onsite monitoring, more frequent analysis of program data, and in-depth
regular engagements with partners to discuss implementation progress and facilitate sharing of
best practices.

Zambezia has the largest number of PLHIV in all of Mozambique and has long contended with
the lowest coverage. For this reason, COP17 includes a Zambezia-specific plan (Zambezia Action
Plan – ZAP) that will focus resources through interagency investment to rapidly improve early
case identification, linkage, treatment initiation, retention, viral suppression, quality of services,
infrastructure, information systems, and supply chain/laboratory logistics.

4|Page
Finally, PEPFAR recognizes the vital and increasing role that communities and civil society have
in addressing the epidemic in Mozambique. They have a direct stake in the success of these
endeavors and provide invaluable perspective on the daily realities of the epidemic. PEPFAR will
continue to strengthen these partnerships to ensure programming that is both relevant and
effective, focused on the health needs of Mozambicans.

5|Page
2.0 Epidemic, Response, and Program Context
2.1 Summary statistics, disease burden and country profile1

Mozambique is a country of approximately 29 million people2 challenged by a generalized HIV
epidemic. National HIV prevalence is estimated at 13%, with substantial variation in provincial
prevalence ranging from 5% in Tete Province to 24% in Gaza Province.3 At the end of 2016, there
were an estimated 1.9 million PLHIV, with a higher prevalence among women, 15% vs. 10% among
men.4 Prevalence among adolescent girls 15-19 is estimated at 6% and among young women 20-24
is estimated at 13%, compared to 2% and 5% among adolescent boys and young men.5 Additional
sub populations have higher prevalence, please see table 2.1.1. Of the estimated number of PLHIV,
45% are currently on ART. The HIV epidemic has contributed to a reduced life expectancy of 55
years, and there are approximately 2 million orphaned children, of whom 800,000 were orphaned
by HIV.

Despite encouraging economic growth, estimated at over 7% over the last three years,
Mozambique's economy suffered a major blow following the discovery of nearly $2 billion in
government-backed hidden debt in 2015 and 2016, which contributed to rapid inflation, a
depreciating national currency, and reduced growth rates falling from 6.6% in 2015 to an
estimated 4.5% to 3.7% in 2016. While the economy is expected to rebound slightly in 2017, the
Human Development Index ranks Mozambique 180 out of 187 countries.6 Sixty percent of
Mozambicans live on less than $1.25/day with a gross national income of $600 per capita.7 Seventy
percent of Mozambicans are estimated to be poor and 37% destitute with substantial variation by
region and province (see Figure 2.1.1).8

1
  A new HIV prevalence survey (Inquérito de Indicadores de Immunização, Malãria e HIV/SIDA em Moçambique – IMASIDA) is
currently in draft. Preliminary prevalence estimates were generously provided by GOM for calculation of PEPFAR COP17 targets. These
preliminary estimates are included here and are reflected in the PLHIV estimates described throughout the text but will be replaced by
official GOM estimates later this year.
2
  UNDATA, 2016
3
  INSIDA, 2009
4
  EPP SPECTRUM Version 5.4.2014; 2015 estimate
5
  AIDS Indicator Survey INSIDA, 2009
6
  Human Development Report, 2015, UNDP
7
  World Bank, 2014
8
  Oxford Poverty and Human Development Initiative (2016). “Mozambique Country Briefing”, Multidimensional Poverty Index Data
Bank. OPHI, University of Oxford. Available at: www.ophi.org.uk/multidimensional-poverty-index/mpi-country-briefings/

6|Page
Figure 2.1.1: Global Multidimensional Poverty Index* in Mozambique by Province

The MPI, developed in 2010 by UNDP, is calculated by combining the incidence of poverty multiplied by the average intensity of
poverty. Intensity of poverty is assessed across three dimensions: health, education and living standards.

Several key health indicators show some key improvements. Antenatal care (ANC) coverage,
defined as at least one ANC clinic visit, increased to 93% with 70% of women delivering in a
health facility.9 Under-five child mortality was 90/1,000 live births, declining from 103/1,000 live
births in 2010.10 Malaria, acute respiratory infections, and vaccine-preventable diseases are the
main causes of child mortality, with malaria contributing to one-third of deaths. Forty-three
percent of children-under-the-age of 5 years are stunted.

The Gender Inequality Index synthesizes gender-based inequalities in three dimensions –
reproductive health, empowerment, and economic activity – on which Mozambique ranks 135 of
155 countries. Mozambique has high rates of early marriage, 60% of women age 25-49 were
married before age 20, and 40% of Mozambican women become pregnant before the age of 20.
The adolescent pregnancy rate is 137.8 births per 1,000 live births and the risk of death among
pregnant teenagers is four times higher than for women above the age of 20. Only 1.5% of adult
women have reached at least a secondary-level of education compared to 6% of men.11

Population-level data from 2009 estimated 10% of all cohabiting heterosexual couples were

9
   IMASIDA, 2015
10
    Mozambique DHS, 2011 & UNICEF, 2012
11
   Human Development Report 2014, UNDP

7|Page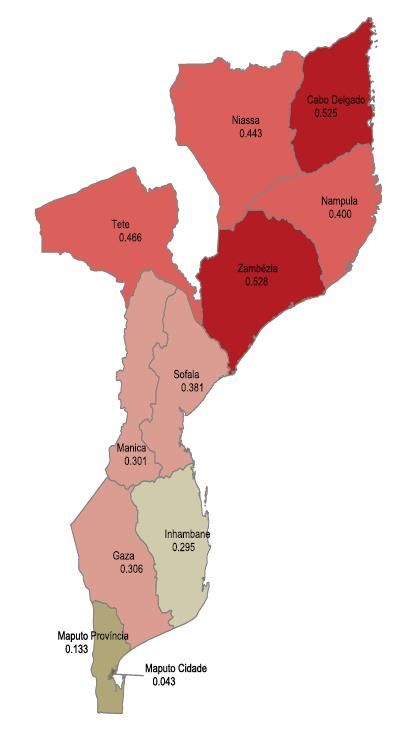
serodiscordant and 58% of PLHIV did not know their HIV status. Among women age 15-49 who
had sexual intercourse in the last 12 months, 8% reported using a condom during last intercourse
(19% urban, 3% rural). The proportion increased to 16% among similar aged men (33% urban, 7%
rural). Male circumcision (MC) is reported at 63%, with geographic variations ranging from 9% in
Tete Province and 95% in Niassa Province.

A Modes of Transmission Model conducted in 2013 shows that 29% of new infections were among
sex workers, their clients and men who have sex with men (MSM), and 26% of new infections
occur among people in stable sexual relationships, due in large part to high rates of
serodiscordance and low rates of condom use among couples. People in multiple concurrent
partnerships contributed to 23% of new adult infections. Mobile and migrant workers such as
miners, agricultural workers, prison populations, the military, and truck drivers also constitute
priority populations.12

Mozambique has low national retention rates. Twelve month retention among PLHIV newly
initiating ART was 70% at APR16. Rates are even lower in pregnant women, children under 15, and
adolescents 15-19 (61%, 69% and 69% respectively at APR16). PEPFAR Mozambique is currently
planning and implementing innovations at the facility and community level to retain and track
PLHIV on treatment (additional details in Section 4).

The health system contends with major challenges, including limited funding, insufficient
infrastructure, and a critical shortage of human resources. Over 90% of Mozambicans live in an
underserved primary health care area defined as over a one hour walk from a primary health care
center (Figure 2.1.2).13 Overall, the ratio of population per hospital bed is 1 bed per 1,038 persons,
with substantial variation across the country.14 Human resources for health (HRH) are severely
constrained with 7.8 doctors, 26.8 nurses, and a total of 100.2 health care workers (HCW) per
100,000 people.15 Together with uneven geographic distribution and limited supervision, there are
an inadequate number of trained and competent HCW in all cadres.

The GRM is responsible for the oversight of policies and regulations, as well as the coordination of
services. Information systems and monitoring and evaluation (M&E) efforts are heavily supported
by external funding and are challenged to provide timely and accurate health data. Supply chain
and commodities management is fragile and is an area where PEPFAR provides substantial
technical assistance (TA). The laboratory network to support HIV care and treatment (C&T) also
requires significant investment to expand diagnostic capacity; at present only 344 of 1,438 health
units that have laboratories.

12
   Military – Seroprevalence and Behavioral Epidemiology Risk Survey in the Armed Forces of Mozambique 2010
13
   Luis & Cabral, Geographic accessibility to primary healthcare centers in Mozambique, 2016
14
   MISAU/MOH – DRH. Relatório Anual dos Recursos Humanos. Maputo, Abril 2014
15
   MOH/MISAU, 2016. WHO (2006) estimates 230 medical professionals per 100,000 people as a minimum threshold necessary to
provide essential health interventions.

8|Page
Figure 2.1.2: Walking Time (in minutes) to Primary Healthcare Centers in Mozambique
(Luis & Cabral, 2016)

Despite these challenges, there has been remarkable progress. Since 2011, the number of people on
ART has increased threefold, with dramatic change since the launch of the MOH’s national HIV
and AIDS Response – Strategic Acceleration Plan for Mozambique 2013-2017. The number of health
facilities offering ART increased from 255 in 2011 to 1,149 by the end of 2016. In 2016 alone, 292,224
adults newly initiated ART. Based on data from MOH and PEPFAR, approximately 900,000 adults
were estimated to be on ART at the end of 2016. 16

16
 MOH estimated 934,357 PLHIV on ART at the end of calendar year 2016; using PEPFAR data in sites supported by PEPFAR and MOH
data from sites that were not it was estimated that approximately 872,593 were on treatment at the end of FY16 (September 30, 2016).

9|Page
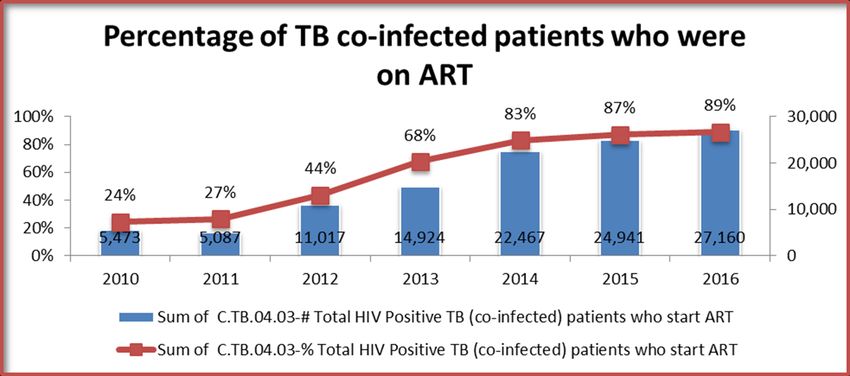
Figure 2.1.3: National and PEPFAR Trend for Individuals Currently on Treatment

There has also been remarkable progress in T&S for pregnant women attending ANC clinics. ART
coverage increased from 12% of all HIV-infected pregnant women in 2012 to 93% in 2016. Progress
among children has been slower. The total number of children on treatment was 62,396 at the
end of 2016, approximately 41% of the total estimated pediatric PLHIV (see Table 2.1.2).

In February 2016, the MOH announced its decision to adopt the UNAIDS 90-90-90 goals and the
revised WHO guidelines released September 30, 2015. Mozambique initiated ART for all patients
at CD4
Table 2.1.1 Host Country Government Results
Table 2.1.1 Host Country Government Results (continued)
                                                                                          Total
                                                                                                                                                                    Source, Year
                                                                         N                                      %
Notified TB cases (Yr)                                                 61,559                                                                               Global tuberculosis report 2016
# (%) of TB cases that are HIV infected                                29,827                                  51%                                          Global tuberculosis report 2016
% of Males Circumcised                                                                                         48%                                                    DHS 2011
                                                               Maputo City – 10,121
Estimated Population Size of MSM*                                  Beira – 2,624                                                                                    MSM IBBS 2011
                                                             Nampula/Nacala – 3,069
                                                                                                       Maputo City – 8.2%
MSM HIV Prevalence                                                                                         Beira – 9.1%                                             MSM IBBS 2011
                                                                                                     Nampula/Nacala – 3.7%
                                                               Maputo City – 13,554
Estimated Population Size of FSW                                   Beira – 6,802                                                                                   FSW IBBS 2011-2
                                                                Nampula – 6,929
                                                                                                       Maputo City – 31.2%
FSW HIV Prevalence                                                                                        Beira – 23.6%                                            FSW IBBS 2011-2
                                                                                                         Nampula – 17.8%
                                                             Maputo City – 1,684****
Estimated Population Size of PWID                                                                                                                                  PWID IBBS 2013
                                                               Nampula – 520****
                                                                                                    Maputo City – 50.3%****
PWID HIV Prevalence                                                                                                                                                PWID IBBS 2013
                                                                                                      Nampula – 36.8%****
Estimated Size of Priority Populations -
Adolescent Girls & Young Women (15-24)
                                                                          2,844,271                                                                                  Census 2017
Priority Populations Prevalence - Adolescent
Girls & Young Women (15-24)
                                                                                                                              11%                                   INSIDA 2009
*15-49 year olds
**0-11 year olds
***2017 PLHIV estimates from preliminary Spectrum files developed by MOH, UNAIDS & PEPFAR for use in COP17 planning – Preliminary Estimates, 2015 National Survey, Spectrum
v.5.4, provincial (not regional), CD4500 + TS ; prevalence estimates are not yet official and are not being released until sometime after April 16, 2017.
****Preliminary data

12 | P a g e
Table 2.1.2: Preliminary revised 90-90-90 cascade: HIV diagnosis, treatment and viral suppression
HIV Testing and Linkage to ART
Epidemiologic Data HIV Treatment and Viral Suppression
Within the Last Year
Total ART
Estimated On ART Tested for Initiated
Population HIV PLHIV Coverage Viral Diagnosed
Total PLHIV (Sept., HIV on ART
Size Estimate Prevalence diagnosed (estimated Suppression HIV Positive
(2017) 2016) (FY16) (FY16)
(2017)# national)
(#) (%) (#) (#) (#) (%) (%) (#) (#) (#)
Unofficial estimates of PLHIV based on new preliminary results of 2015 National PEPFAR data, sites with coarse age
PEPFAR / MOH combined data for FY16**
Survey* disaggregations***
Total
27,843,933 UNK 1,925,519 UNK 872,593 45% UNK 4,614,766 335,276 227,576
population
AgeTable 2.1.2 90-90-90 cascade: HIV diagnosis, treatment and viral suppression (continued)
HIV Testing and Linkage to ART
Epidemiologic Data HIV Treatment and Viral Suppression
Within the Last Year
ART
Total Diagnosed
Estimated Total PLHIV Coverage Viral Tested for Initiated
Population Size HIV Prevalence On ART HIV
PLHIV diagnosed (estimated Suppression HIV on ART
Estimate^ Positive
national)
(#) (%) (#) (#) (#) (%) (%) (#) (#) (#)
Maputo City – Maputo City – Maputo City -
10,121 8.2% 830
MSM Beira – 2,624 Beira – 9.1% Beira - 239 UNK UNK UNK UNK UNK UNK UNK
Nampula/Nacala Nampula/Nacala Nampula/Nacala
– 3,069 – 3.7% - 114
Maputo City – Maputo City – Maputo City –
13,554 31.2% 4,229
FSW Beira – 6,802 Beira – 23.6% Beira – 1,605 UNK UNK UNK UNK UNK UNK UNK
Nampula – 6,929 Nampula – 17.8% Nampula – 1,232
Maputo City – Maputo City – Maputo City –
1,684^ 50.3%^ 847^
PWID UNK UNK UNK UNK UNK UNK UNK
Nampula –
Nampula – 520^ Nampula – 191^
36.8%^
Priority
Pop –
2,844,271 11.10% 134,035 UNK UNK UNK UNK UNK UNK UNK
Adolescent
Girls
^Preliminary data
14 | P a g e2.2 Investment Profile
National Health Budget. The GRM’s total budget allocated to health in 2016, the most recent
year for which data are available, was US $343 million, representing 7.7% of the total national
budget.17 Twenty three percent was dedicated to the central ministry level, 54% to the Provincial
Directorates of Health (Direcção Provincial de Saúde - DPS), 7% to central hospital of Maputo, and
16% to the Central Medical Stores (Central de Medicamentos e Artigos Médicos – CMAM) inclusive
of medicines.18
HIV Expenditures. The 2014 National AIDS Spending Assessment (NASA) showed a 28%
increase in HIV expenditures from US $260.3 million in calendar-year (CY) 2011 to US $332.5
million in CY14 (74% PEPFAR). PEPFAR and GFATM finance the bulk of the HIV response. The
GRM is the third-largest individual source of funding, with US $16.2 million allocated to HIV in
2014. Despite having doubled from 2004 to 2014, domestic public sector HIV expenditure
represented only 5% of overall HIV expenditures in 2014. The latest data from the Global AIDS
Monitoring Report 2016 indicate total HIV expenditures remained stagnant at US $341 million in
2015 and US $333 million in 2016. USG and Global Fund represented 87% of the total HIV
expenditure for each of those years. 19
Expenditure towards Health System Strengthening. In 2013, US $292 million was invested in
health systems (52% domestic public resources, 23% PROSAUDE and 24% from other external
partners). According to NASA, in 2014 US $137.6 million was spent in HIV-specific HSS funding,
including expenditure for laboratories (US $16.1 million); SI, surveys, and surveillance ($24.2
million); and others not specified (US $43.6 million).
Expenditure by Cost Category. The financing landscape changed significantly from 2014 to 2016,
although most commodities for HIV continue to be financed by international partners. In 2014,
100% of ARVs were procured through international mechanisms such as the Pooled Procurement
Mechanism and the Supply Chain Management System (SCMS) and financed by international
donors, including PEPFAR (52%), the GFATM (45%), and UNITAID (3%). GFATM became the
major financing mechanism during 2016 for key HIV/AIDS commodities like ARVs, CD4 and
RTKs. UNITAID (implemented by CHAI) no longer funds pediatric ARVs, testing, and other
diagnostics such as PIMA CD4 and conventional EID PCR.
The GRM pays HCW salaries (estimated at US $12 million in 2011)20 and costs related to
implementation (facility maintenance, transport, etc.). According to the 2014 NASA, 40% of labor
costs for HIV treatment in 2011 were supported by the state budget, with an additional 8% from
Mozambique’s Common Health Sector Common Fund (PROSAUDE).
17
MISAU DAF REIO, 2016
18
MISAU DAF REIO, Table 3.1, 2016
19
CNCS GAM, 2017
20
MISAU/MOH, Plano Estratégico para TB
15 | P a g eIt is estimated that 11% of the MOH recurrent expenses are allocated to HIV and TB. Other domestic spending from MOH covers lab reagents, materials and specific services. In addition to these allocations to the MOH, the GRM also allocated funding to the CNCS for the coordination of the national HIV response and to civil society organizations for community activities. Planned Government Contributions. The GRM has committed to increase domestic public expenditure for health by an additional US $35 million between 2018 – 2020 in accordance with the Global Fund counterpart financing agreement. The MOH will continue to finance a large portion of human resources, health facility infrastructure, supply chain and the CNCS. The Ministry of Defense (Ministério da Defesa Nacional -MDN) will continue to invest in the military health care systems in support of its armed forces, civilian dependents and communities surrounding military bases. Data Availability and Estimations. Overall health sector expenditures are estimated from the MOH annual execution budget reports (Relatorios de Execução Orçamental), complemented by estimations made by WHO and the United Nations Children's Fund (UNICEF). The MOH does not track or report spending by disease category. Reporting of HIV specific funding is based on the NASA, elaborated by CNCS, which details HIV expenditure by financing source, programmatic area, beneficiary population or geographical location. Data available cover the years 2004 to 2014. HIV funding for 2015 and 2016 was estimated using the FY16 PEPFAR Expenditure Analysis, Official Development Assistance to Mozambique Database (ODAMOZ), commodity consumption data from CMAM, estimates from GRM expenditures for human resources and other donor reports. A new NASA report updated with 2017 data will be available by mid-2018. Conclusion and Next Steps. Despite positive projections, the GRM will not be able to fully cover the costs of its response to HIV (and TB and Malaria). The estimated resource gap from 2018 to 2020 will be at least US $225 million if current levels of expenditures remain constant21, representing 36% of the Government’s Health Sector Budget for the same period. Subsequent to that projection, the 2016 debt crisis resulted in significant GRM spending cuts across the board including in the health sector. Such reduced spending is expected to continue in 2017. Over the past few years the GRM has increased investment in the health sector in local currency; however the proportion of the total domestic budget allocated to health continues to fall well below the 15% commitment made in the Abuja Declaration. Given the recent fiscal crisis, additional expansion in the short-to-medium term is unlikely. Over the longer term, with significant increased state revenues from extractive industry gains expected within the next 15-20 years, the GRM can prepare to increase its investments in, and ownership of, the health sector, including the fight against HIV/AIDS. It is essential for the GRM, GFATM, and PEPFAR to work closely to create a clear and sustainable financing plan for anti-retroviral (ARV) drugs and other 21 Projections based on CNCS NSP IV projected costs 2017 and GAM 2017 indicator 8.1. The projections do not take into consideration updated HIV prevalence from IMASIDA 2015. 16 | P a g e
commodities and to execute timely disbursements. The MOH, with PEPFAR support, is
completing a Health Financing Strategy, and discussions are underway between the MOH and the
Ministry of Finance (Ministério da Economia e Finanças - MINEF) regarding implementation of
innovative financing mechanisms.

                    Table 2.2.1: HIV Expenditure by Programmatic Area in Mozambique
                                                        Total
                                                                                                          %
 Program Area                                        Expenditure      % PEPFAR       % GF        % GRM
                                                                                                         Other
                                                    (million USD)

 Clinical care, treatment and support                    90.6             68%         20%         2%         10%

 Community-based care, treatment, and support             7.9             92%         N/A         2%         6%

 PMTCT                                                   22.1             75%         10%         4%         11%
 HTC*                                                    14.2             81%         12%         4%         3%
 VMMC                                                    17.6             99%          1%         0%         0%
 Priority population prevention                           5.0             44%          7%         7%         43%
 Key population prevention**                              3.5             49%          7%         N/A        45%
 OVC                                                      6.2             84%         N/A         4%         12%
 Laboratory                                               16.1            75%          2%         9%         13%
 SI, Surveys and Surveillance***                         24.2             90%         N/A         5%         5%
 HSS                                                     43.6             89%         N/A         7%         4%
 Total                                                   250.9
 Missing:                                                81.6
  Other prevention expenditure                           28.3             43%         17%         4%         35%
  National coordination and program
 management                                              44.0             81%          2%         8%         9%
   Enabling environment & other social services           9.4             35%         16%         22%        27%
 TOTAL                                                   332.5            74%          9%         5%         12%

 * Includes VCT, PICT and blood safety (PMTCT testing included under PMTCT)
 ** Refers to prevention for vulnerable groups, accessible population and prevention for youth
 *** National M&E, operational research, surveillance, information technology, research

 Source: National Aids Spending Assessment (NASA) for the period 2014 in Mozambique, Conselho Nacional de
 Combate ao HIV/SIDA (CNCS), September 2016.

                          Table 2.2.2: Annual Procurement Profile for Key Commodities
                                                                                                   % Host           %
         Commodity Category               Total Expenditure         % PEPFAR          % GF
                                                                                                   Country        Other
 ARVs                                          $97,156,020            40.6%           59.4%           ---          ---
 Rapid test kits                               $12,641,979             33.9%          66.1%           ---          ---
 Other drugs                                    $11,170,128           40.4%           22.8%         36.9%          ---
 Lab reagents                                  $10,470,839            20.8%           79.2%           ---          ---
 Condoms                                        $3,583,884             75.7%            ---           ---         24.3%
 Viral Load commodities                        $13,836,072             96.1%           3.9%           ---          ---
 VMMC kits                                      $3,278,158             100%             ---           ---          ---
 Total                                        $152,137,080              47%            52%            ---          1%
Table 2.2.2 is filled out based on the commodities arriving in Mozambique in FY17.

17 | P a g e
Table 2.2.3: USG Non-PEPFAR Funded Investments and Integration
Total USG Non-PEPFAR # CoFunded PEPFAR COP
Non- Resources IMs CoFunding
Funding Source
PEPFAR CoFunding Contribution Objectives
Resources PEPFAR IMs
Supply chain and improved systems strengthening;
strengthened quality and safety of priority medicines;
improved pharmaco-vigilance and rational use of drugs;
expand coverage and improve quality of community health
USAID MCH $14,050,000 $10,450,000 4 $266,000 activities; improved the health status for women of
childbearing age, particularly pregnant and lactating women
and children under five year of age; training CHWs
including immunization, prevention and management of
preterm, intrapartum complications and infections.
Supply chain management by improving quantification,
USAID TB $4,500,000 $300,000 1 --- procurement and timely distribution of TB drugs.
Supply chain and improved systems strengthening,
improved the health status for women of childbearing age,
USAID Malaria $28,522,760 $18,173,110 3 --- particularly pregnant and lactating women and children
under five year of age; improved health behavior.
Increased access to and use of voluntary FP contraceptive
methods; commodities purchased including condoms,
essential medicines, and diagnostics; improved maternal
USAID Family Planning $11,500,000 $4,850,000 4 --- and child survival; Improved health behaviors; strengthened
quality and safety of priority medicines; improved
pharmaco-vigilance and rational use of drugs
Increased capacity of MISAU to develop and implement
nutrition-oriented policies and programs; improved positive
USAID Nutrition $5,700,000 $3,300,000 4 --- health and nutrition behaviors; support the national
malnutrition program.
Include, but not limited to: increased capacity of MOH,
NGOs, community organizations, and CHWs to prevent and
control HIV (non-PEPFAR resources pay for PC health staff
Peace Corps $7,500,000 --- 1 ---
and operations); increased capacity of MINEDH to prepare
secondary school students for academic success (non-
PEPFAR resources pay for staff and for education PCVs).
Total $71,772,760 $37,073,110 $266,000
18 | P a g eTable 2.2.4: Annual PEPFAR Non-COP Resources, Central Initiatives, PPP, HOP
Total
Non-
Total PEPFAR Total Non- PEPFAR COP
COP Co- # Co-
Funding Source Non-COP PEPFAR Co-Funding Objectives
funding Funded IMs
Resources Resources Contribution
PEPFAR
IMs
DREAMS
--- --- --- --- ---
Innovation
VMMC Central Initiative funds provide additional target-
VMMC – Central
$11,352,508 --- --- 8 $28,972,481 based funds to achieve ambitious VMMC targets.
Funds
LCI --- --- --- --- ---
Other PEPFAR
$10,000,000 --- --- 8 $4,325,595 Health Information Systems for Impact
Central Initiatives
The CDC Anadarko PPP is a public private partnership
Other Public with the natural gas corporation Anadarko for HIV testing
$124,900 $236,850 --- 1 $144,006
Private Partnership and prevention education among female sex workers and
adolescent girls and young women in Cabo Delgado.
Total
$21,477,408 $236,850 --- 17 $33,442,082
19 | P a g e2.3 National Sustainability Profile Update
The overall sustainability context in Mozambique is broadly similar to the situation outlined in
the SID review conducted for COP16. Over the past year the domestic economic situation has
made it challenging for the GRM to mobilize increased resources for the HIV response. Similarly,
there are continued issues with public access to information, private sector engagement, and
laboratory systems. PEPFAR and the GF continue to support all of these domains and there are
plans for a national laboratory strategic review during the COP 16 implementation period. One
area of marked improvement is the GRM's engagement with civil society. During the current GF
funding request development process there has been robust and transparent dialogue between
CSOs and the Government which is encouraging for future collaborations.
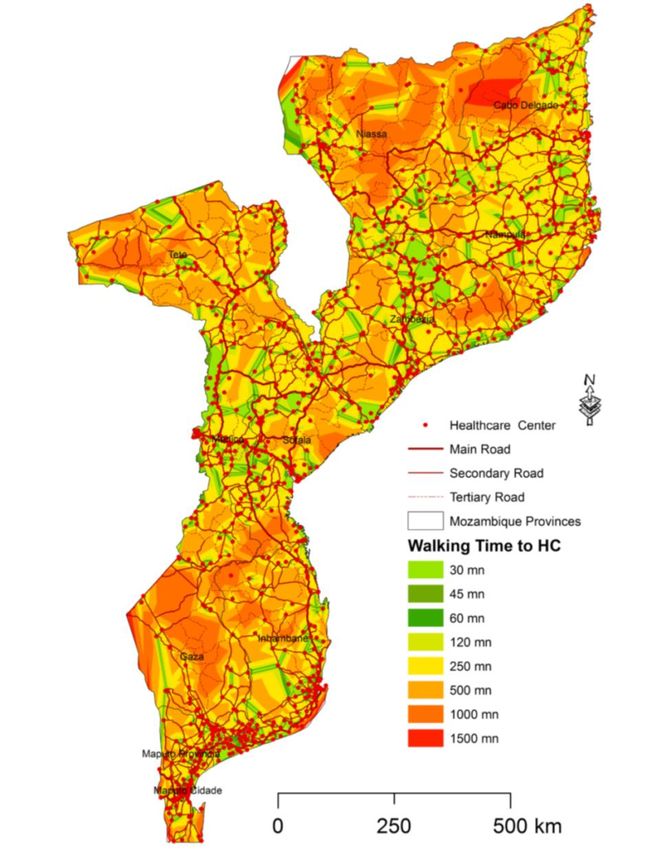
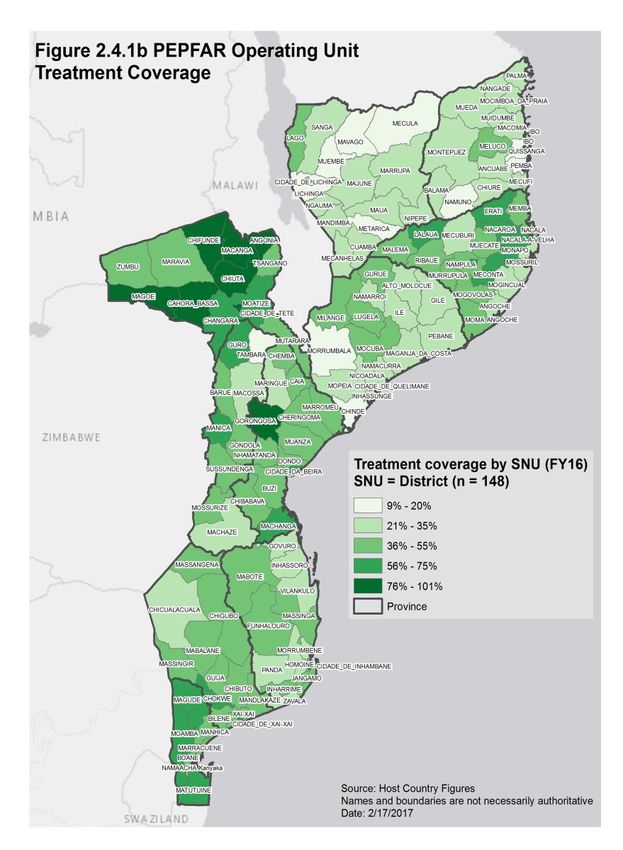
2.4 Alignment of PEPFAR investments geographically to disease burden
Newly available PLHIV estimates identified substantially greater need for investment in Zambezia
(see Figure 2.4.1). Figures 2.4.1a and 2.4.1b illustrate this need, with high disease burden and low
treatment coverage in most districts within the province. COP17 allocates 18% of the target-based
budget to Zambezia, which aligns with the percent allocation of targets. An additional 20% of the
activity-based budget is allocated to the Zambezia Action Plan (ZAP) in addition to other, existing
activities within the province (see Appendix D for details). Higher targets and thus more funding
were also directed to several districts within Cabo Delgado, Inhambane, and Niassa.
Figure 2.4.1: PEPFAR FY15 and FY16 Expenditures Compared to % PLHIV and % Unmet
Need by Province
35%
FY15 Provincial Expenditures (%)
30%
FY16 Provincial Expenditures (%)
25% % PLHIV (2016)
20% % Unmet Need (2016)
15%
10%
5%
0%
FY15 and FY16 provincial expenditures are summed from district expenditures and exclude above national, national,
commodities and military expenditures.
20 | P a g e21 | P a g e
2.5 Stakeholder Engagement

2.5.1 Host country government

PEPFAR-Mozambique is committed to strong engagement with the GRM on policy issues,
alignment with national priorities, joint planning, implementation and performance reports, data
sharing, regular coordination, communication with counterparts and, strategic discussion to
develop a shared vision for substantial country ownership.

USG leadership holds regular meetings with the Minister and Vice Minister for Health and
frequent policy and program consultations with the national directors of Planning & Cooperation,
Medical Assistance, MOH, CMAM, Human Resources and heads of programs including
HIV/AIDS, TB, PMTCT and Laboratory to ensure transparency, consistency, and to improve the
alignment between USG and GRM/MOH priorities.

PEPFAR-Mozambique has two national level Government-to-Government (G2G) Cooperative
Agreements (one with the MOH and one with the National Institute of Health), six agreements at
the provincial level and provides district level sub-agreements through implementing partners
and embedded technical advisors in the MOH. PEPFAR staff are active participants in MOH
technical working groups. PEPFAR also contributes to provincial planning and engages with DPS
to oversee program implementation and partner support through regular site visits and sharing
Quality Assurance and Quality Improvement cycle results, Site Improvement through Monitoring
Systems (SIMS) reports, and program results (Semi-Annual and Annual Reports).

PEPFAR collaborates closely with the CNCS, the National Institute of Health (INS) and the
Ministry of Gender, Child, and Social Action, Ministry of Education and Human Development,
Ministry of Defense, Ministry of Foreign Affairs, and Cooperation, Ministry of Finance, Civil
Society and Community Stakeholders.

This level of engagement has enhanced PEPFAR’s ability to participate in policy and planning,
capacity building for country ownership and advocacy on behalf of the MOH with other parts of
the GRM (especially MINEF and the Presidency).

2.5.2 Global Fund and Other External Donors

PEPFAR-Mozambique has engaged closely with GFATM, the Health Partners Group (HPG), and
other key multilateral partners throughout the development of COP17. Members of the GFATM
CCM, GF program management unit, UNAIDS, and HPG participated in a week-long COP
planning retreat and provided input on key programmatic elements throughout the planning
process.

PEPFAR-Mozambique has contributed to the on-going preparation of the GFATM funding
request for 2018 – 2020 which has allowed for deduplication of investments and strategic
alignment of activity planning. In addition, PEPFAR-Mozambique has a full-time GF Liaison who

22 | P a g e
attends all GFATM meetings in country, communicates regularly with the Fund Portfolio
Manager (FPM) in Geneva, coordinates USG technical assistance to the GFATM, and works to
harmonize the PEPFAR and GFATM programs.

GFATM staff (including the FPM), SI advisor, HSS and supply chain leads regularly meet with the
PEPFAR team in Maputo to strengthen the programmatic synergies between PEPFAR and
GFATM. In COP17, PEPFAR-Mozambique will continue to engage with GFATM to ensure both
programs leverage their respective comparative advantages and eliminate duplicative activities.
PEPFAR will continue to share information and solicit feedback before and after technical
assistance visits and quarterly reporting. PEPFAR will also continue to work closely with GFATM
to coordinate commodities planning as Mozambique progresses through phased implementation
of T&S.

Beginning in 2016, the USG became a co-chair of the HPG and the HPG commodity planning
technical working group. This has further strengthened PEPFAR-Mozambique's strategic
engagement with other bi-lateral and multilateral partners and allows for members of the donor
community to leverage their respective resources synergistically across the health sector.

2.5.3 Civil Society/Community

Over the past several years, PEPFAR-Mozambique has been engaged with the major Mozambican
civil society platform (Plataforma da Sociedade Civil para a Saúde – PLASOC) that represents a
considerable number of HIV-focused NGOs and CBOs based in the 11 provinces of the country.
This engagement has facilitated open discussion of PEPFAR’s programmatic direction, data and
results. COP17 strategic planning reflects input of civil society partners.

For COP17 development, PEPFAR-Mozambique invited and supported civil society
representatives from all the provinces to attend the COP17 retreat held January 25 - 27, 2017, as
well as UNAIDS, WHO, CNCS, GFTAM, and Medecins Sans Frontieres. This retreat created the
opportunity to exchange ideas with multiple stakeholders simultaneously about expectations for
COP planning and PEPFAR’s strategic direction. Open participation enriched the debate and
made it possible to reach broad consensus regarding the path toward epidemic control.

After participating in the retreat, civil society provided written feedback in the areas of Human
Rights & HIV Stigma and Discrimination, institutional capacity development, support to the HIV
cascade, and retention of HIV-positive patients in C&T.

The technical working group will continue to meet with the PLASOC regularly throughout the
implementation period to share information, and to solicit input into key programmatic issues
and policy decision points.

23 | P a g e
2.5.4 Private Sector

The U.S. Government Public-Private Partnership (PPP) Interagency Working Group, which
includes all Agencies operating in Mozambique, meets quarterly to provide a forum for
coordination and sharing of best practices and opportunities for leveraging private sector
resources to achieve shared development goals in Mozambique. Currently, three Agencies at Post
manage 16 active partnerships totaling $116.5 million, of which $77.1 million are private sector
contributions. Feedback from these forums was integrated into PEPFAR-Mozambique's program
planning for COP17.

24 | P a g e
3.0 Geographic and Population Prioritization
Based on the updated epidemiologic data described in Appendix E, the PEPFAR team reassessed
district prioritization categories based on 1) new coverage estimates and 2) new estimates of
disease burden. The goal was to allocate resources to the areas with the highest burden and most
unmet need.

Four provinces, Zambezia, Inhambane, Sofala, and Cabo Delgado, were noted to have
substantially higher burden of HIV than previously estimated. Of these, the largest change in
burden was in Zambezia, a province that was previously considered to have low coverage and the
highest unmet need nationally. As a result of the severity of the epidemic in Zambezia, all districts
will be categorized as Aggressive Scale-Up in COP17 with the aim of increasing the coverage from
35% in APR16 to 73% in FY19. There were six additional districts (five in Inhambane and one in
Niassa) that had a substantial increase in estimated PLHIV, low ART coverage (80% coverage overall in FY17, only
four of these (Cahora Basa, Chiuta, Gorongosa, Maputo City) are expected to achieve this level of
coverage when stratified by gender and age. However, because Maputo City serves a wide
catchment area with many patients living in neighboring districts, the decision was made to
maintain Maputo City as Scale-Up Saturation. The remaining three districts will be categorized as
Attained. Last, the updated denominator data requires re-evaluation of which districts are able to
reach >80% coverage in FY18. Thus, 15 districts are reclassified from Scale-Up Saturation to Scale-
Up Aggressive, and four districts from Scale-Up Aggressive to Scale-Up Saturation. Table 3.1 and
Appendix A show comparisons of district categorization in COP17 vs. COP16.
Table 3.1: District Prioritization in COP17 vs. COP16

      COP16                                 COP17 Prioritization
  Prioritization    Attained        ScaleUp Sat          ScaleUp Agg        Sustained
 Attained               2                 -                    1                3
 ScaleUp Sat            -                19                   15                -
 ScaleUp Agg            -                 4                   35                5
 Sustained              1                 -                   11               52

25 | P a g e
In addition to shifts in geographic focus, the PEPFAR team will increase outreach to populations
that are currently under-served using intensified service provision models. COP17 intensifies
efforts to reach and enroll men into treatment, retain pregnant and lactating women and children
on treatment, improve EID access and linkage and expand programs to reach key and priority
populations such as miners and prisoners. Currently there is a substantial gap between the
proportion of men and women initiating ART with women making up 69% of new on treatment
and 70% of current on treatment at APR16. While recent updates to ART eligibility guidelines
expands eligibility among men diagnosed with HIV, significant outreach is still required to
identify, enroll, and retain men on treatment. Similarly, while ART among pregnant women is at
an all-time high nationally (93%), low 12-month retention in this population (61% at APR16)
compromises both PMTCT and treatment efforts. Enhanced strategies to monitor and improve
retention are among the core strategies described below.
By the end of FY17, 22 of 58 districts targeted for VMMC programs in COP16 are expected to reach
or exceed 80% coverage among males aged 15-29. Eleven of these districts are in the southern
most area of the country, Maputo Province and City, where the program will increase focus on
males aged 10-14.
Through aggressive program implementation in the geographic areas and populations described,
PEPFAR aims to support Mozambique in achieving its stated goal of >80% saturation nationally
by 2020, with 22 Scale-Up districts reaching saturation by FY18, 43 by FY19, and all-Scale-Up
districts reaching >80% coverage by 2020.
Table 3.2: Current Status of ART saturation
Total PLHIV/% of
# Current on ART # of Districts # of Districts
Prioritization Area all PLHIV for
(FY16)* COP16 (FY17) COP17 (FY18)
COP17
Attained 9,722 / 1% 10,575 5 3
Scale-up Saturation 473,855 / 25% 330,213 41** 23**
Scale-up Aggressive 1,234,125 / 64% 420,539 37 62
Sustained 207,817 / 11% 79,033 65 60
Central Support N/A N/A N/A N/A
*Includes results from sites with4.0 Program Activities for Epidemic Control in Scale-Up Locations and Populations 4.1 Targets for scale-up locations and populations 4.1.1 Adult and Pediatric Treatment and Testing Targets The PEPFAR-Mozambique team worked closely with the MOH to develop ambitious targets in order to rapidly move toward epidemic control. Initial treatment targets were developed to reach 80% coverage nationally by 2020, with faster growth anticipated in districts where current coverage is low and slower growth anticipated in districts nearing saturation. Districts where current coverage is below 40% were targeted for 50% annual growth, whereas districts nearing saturation were targeted for 15% annual growth. Districts that begin to implement T&S during the project period received an additional 10% increase in targeted coverage during the year of initial implementation. There are districts in four provinces (Cabo Delgado, Inhambane, Niassa, Zambezia) that will not reach 60% coverage by FY19 with this approach. Based on the preliminary IMASIDA results, these four provinces have higher HIV prevalence than previously believed. Investments are increased in these provinces to ensure that all Scale-Up districts reach at least 70% coverage by FY19 and 80% coverage by FY20. ART coverage for children
7.5%. Inpatient yield is estimated from district ANC yield based on the ratio between inpatient
yield and ANC yield from national MOH data with a cap of 40%.

A list of targets for scale-up districts is provided in Table 4.1.1. TX_NEW targets are based on the
assumption that 12-month retention will improve from 70% nationally at APR16 to 75% in all
sustained districts and 80% in all Scale-Up districts by FY18. Retention among those already on
treatment for >1 year was assumed to be 92%, which is consistent with current estimates. Linkage
to treatment was estimated using COP16 results and ranged from 54% to 95%. For children, where
fewer data were available, linkage was estimated at 85%.

4.1.2 Voluntary Medical Male Circumcision (VMMC) Targets
VMMC targets were based on Project SOAR estimates of circumcisions among adult men age 15-
29 needed to reach 80% coverage in the minimum feasible timeframes: one year in Maputo City,
Maputo Province, Gaza, and Zambezia, two years in Tete, and three years in Manica. In Sofala,
where IMASIDA 2015 data suggest coverage is substantially less than modeled by Project SOAR,
the VMMC targets were adjusted upwards. To account for districts in which the model estimated
high coverage but continued demand suggested otherwise, targets at the district and provincial
level were kept at a minimum of four times the expected FY17 Q1 achievement. These assumptions
result in projected coverage of 80% or more in 49 of 60 districts in which VMMC is implemented
by the end of FY18, including all DREAMS districts. The total VMMC target in most provinces was
calculated using the adult male target as 70% of the total target. In Maputo City (including
Matola), the 10-14-year-old target was set at the number needed to achieve 80% coverage within
one year.

4.1.3 Prevention Targets
Population sizes for KPs were estimated using the 2011 Integrated Behavioral and Biological
Survey (IBBS), program data, and general population data. Since these estimates are only available
for three large urban areas, target districts for COP17 were selected based on available data
adjusted for urban population in each district and expert opinion regarding KP hotspots.
Additional targeted districts were added in several provinces where current program data indicate
that gains can be made.

KP_PREV targets for Female Sex Worker (FSWs) and Men who have Sex with Men (MSM) were
calculated at 50-90% of the district population size in districts where programming has been
ongoing, and at 20% - 40% in new districts that do not have historical achievement. Prison census
information is not publicly available so targets were based on informal estimates and prior
achievement, and are intended to approach 100% of population size. KP district level targets were
not allowed to fall below historical achievement.

Priority populations include Adolescent Girls and Young Women (AGYW) aged 15 – 24 in
DREAMS districts, miners, military, and men aged 15 – 29 who are not currently served by the
health system. Community-based prevention work with miners will take place in Moamba

28 | P a g e
District and Inhambane City, with coverage targets over 80%. In non-DREAMS Scale-Up districts,
DREAMS-like community-based prevention efforts will focus on men aged 15 – 29 who have not
accessed the health system in over a year. The population size of this group is unknown due to
the lack of data on the proportion of men who utilize the health system, but programmatic data
will be gathered during activity recruitment to provide insight into men’s use of clinical services.
In DREAMS districts, community-based prevention activities will focus on women aged 15 – 24.

4.1.4 Orphans and Vulnerable Children (OVC) Targets
OVC target setting commenced with calculations of the adjusted 2016 Mozambican population
size in the 0 – 19 age group, and projected from the 2007 census. Data from the 2011 DHS was used
to calculate OVC prevalence by Province, adjusted to the district level. Targets were established
assuming minimum coverage of 30% in all Scale-Up districts, with manual adjustments based on
historical program data from APR15 and APR16 for the partner with historical performance: Scale-
Up districts with low achievement were given more ambitious coverage targets in order to rapidly
expand services in these areas, while high-performing districts were assigned targets at or above
COP16 levels. Districts that did not report data in APR16 were given lower coverage targets to
account for time and costs associated with commencing operations.

In COP17, the sex disaggregation assumption remains constant: 60% of OVCs served will be
female and 40% male. DREAMS OVC targets comprise 30% of overall OVC targets in the six
DREAMS districts. Other target assumptions included: 5% of beneficiaries will exit the program
without graduating, 5% will transfer to other programs, 15% will graduate, and 8.2% will be newly
added.

OVC_HIVSTAT is targeted at 25% of beneficiaries, based on program data from FY16.

29 | P a g e
Table 4.1.1: Entry Streams for Adults and Pediatrics Newly Initiating ART Patients in Scale-up Districts
                                                                                                                                                               Newly initiated on ART (APR
                                                                               Tested for HIV                      Newly Identified Positive
               Entry Streams for ART Enrollment                                                                                                                            FY 18)
                                                                            (APR FY18) HTS TST                      (APR FY18) HTS TST POS                                  TX_NEW
      Previously diagnosed and/or in care                                                                                                                                     24,133
      Adult Testing
      Pregnant Women                                                                1,089,975                                   60,165                            59,757 (pregnant women)
      TB Patients                                                                    39,595                                      9,420
      VMMC Clients                                                                   401,545                                     5,554
      Key Populations                                                                42,510                                      4,175
      Priority Populations                                                            1,280                                       225
                                                                                                                                                                     270,128 (other newly
      Index case testing                                                            234,506                                     34,606
                                                                                                                                                                      diagnosed adults)
      Inpatient                                                                      85,699                                     18,260
      VCT                                                                           600,577                                     82,876
      Outpatient testing*                                                           3,200,313                                   212,534
      Mobile testing                                                                 159,732                                     13,595
      Total Adult Testing                                                           5,855,732                                   441,411                                      329,885
      Pediatrics (
Table 4.1.2: VMMC Coverage and Targets by Age Bracket in Scale-Up Districts*
Current Expected
VMMC_CIRC VMMC_CIRC
Population Size Estimate Coverage Coverage
Province District (in FY16) (in FY17) (in FY18) (in FY18)
Male
Total Male
Population, 15-29 all all 15-29 15-29
Population
age 15-29
Zambézia Alto Molocue 188,018 48,413 55% 7,484 11,519 8,063 82%
Manica Barue 115,795 32,843 24% 7,092 8,983 6,288 61%
Gaza Bilene 79,559 24,006 63% 1,917 3,179 2,225 84%
Maputo Província Boane 78,203 22,251 103% 1,429 526 368 108%
Sofala Buzi 92,098 25,457 48% 23,440 8,491 5,944 136%
Tete Cahora Bassa 63,933 19,078 19% 6,085 5,960 4,172 67%
Sofala Caia 72,291 17,706 16% 17,468 5,732 4,012 94%
Tete Changara 99,515 28,015 10% 8,353 8,839 6,187 53%
Sofala Chibabava 62,629 14,282 54% 7,167 7,949 5,564 121%
Gaza Chibuto 100,723 27,517 47% 3,973 7,596 5,317 82%
Gaza Chicualacuala 20,853 5,954 27% 3,316 7,194 5,036 138%
Zambézia Chinde 65,776 15,320 48% 1,800 7,276 5,093 89%
Gaza Chokwe 92,884 26,754 67% 3,053 2,449 1,714 85%
Sofala Cidade Da Beira 232,157 82,322 78% 15,740 10,720 7,504 108%
Maputo Província Cidade Da Matola 464,330 150,481 69% 8,341 19,467 5,816 78%
Manica Cidade De Chimoio 163,791 52,998 40% 7,487 8,166 5,716 65%
Zambézia Cidade De Quelimane 123,860 49,432 140% 12,697 9,731 6,812 187%
Tete Cidade De Tete 111,274 36,491 35% 4,820 6,377 4,464 63%
Gaza Cidade De Xai-Xai 60,145 20,350 80% 4,378 606 424 100%
Sofala Dondo 88,534 30,080 100% 4,004 7,051 4,936 136%
Zambézia Gile 99,162 23,429 57% 7,373 799 559 79%
Manica Gondola 174,552 48,139 21% 10,926 14,091 9,864 58%
Sofala Gorongosa 78,766 19,619 25% 16,617 5,560 3,892 95%
Gaza Guija 43,891 11,753 53% 1,013 2,974 2,082 87%
Zambézia Gurue 205,666 56,853 67% 10,948 3,749 2,624 85%
Zambézia Ile 158,358 33,386 48% 12,778 10,200 7,140 88%
31 | P a g eZambézia Inhassunge 48,731 13,486 49% 2,770 3,315 2,321 81%
Zambézia Lugela 72,772 15,668 47% 0 5,973 4,181
Gaza Mabalane 19,075 5,388 33% 2,148 1,740 1,218 76%
Manica Machaze 60,171 13,453 7% 4,943 4,875 3,412 50%
Zambézia Maganja Da Costa 149,652 33,899 49% 10,972 7,701 5,391 83%
Maputo Província Magude 29,380 7,835 82% 0 503 352 93%
Gaza Mandlakaze 83,926 21,488 38% 5,728 7,256 5,079 79%
Maputo Província Manhiça 130,783 36,503 79% 4,899 297 208 92%
Manica Manica 145,241 44,858 58% 4,942 14,194 9,936 91%
Maputo Cidade Maputo City Cluster 603,969 195,085 93% 19,050 1,543 0 99%
Maputo Província Marracuene 72,309 20,155 53% 4,561 1,849 1,294 77%
Sofala Marromeu 89,005 24,621 76% 6,708 6,217 4,352 116%
Maputo Província Matutuine 20,288 5,304 65% 1,419 0 0 86%
Zambézia Milange 317,557 76,287 64% 16,869 10,029 7,020 88%
Maputo Província Moamba 33,680 9,699 74% 330 211 148 82%
Tete Moatize 178,117 47,425 7% 14,826 16,572 11,601 52%
Zambézia Mocuba 191,954 51,609 86% 7,322 2,817 1,972 102%
Zambézia Mopeia 78,414 17,850 55% 1,193 6,869 4,808 88%
Zambézia Morrumbala 230,606 51,765 47% 15,296 15,606 10,924 84%
Manica Mossurize 129,292 34,468 7% 10,572 9,901 6,931 45%
Tete Mutarara 136,603 30,194 3% 15,250 13,433 9,403 59%
Maputo Província Namaacha 25,695 7,633 61% 0 1,547 1,083 79%
Zambézia Namacurra 135,129 37,189 48% 8,725 8,849 6,195 80%
Zambézia Namarroi 71,591 16,043 0% 0 6,760 4,732
Sofala Nhamatanda 141,425 40,850 59% 11,016 7,606 5,324 98%
Zambézia Nicoadala 127,602 35,343 67% 7,194 12,309 8,616 108%
Zambézia Pebane 113,217 25,337 48% 7,723 6,046 4,232 82%
Manica Sussundenga 81,089 21,331 8% 0 9,078 6,354 37%
Gaza Xai-Xai 117,118 33,726 49% 3,975 8,491 5,944 79%
TOTAL 6,771,154 1,897,421 398,130 376,771 254,847
*DOD targets not included.
32 | P a g eTable 4.1.3a: Target Populations for Prevention Interventions to Facilitate Epidemic Control, MSM
Goal % Tested Last 12
Province District Population Size Estimate FY18 Target
Months*
Zambezia Alto Molocue 500 40% 200
Gaza Bilene 166 40% 66
Tete Changara 654 44% 288
Gaza Chokwe 294 40% 118
Sofala Cidade Da Beira 2,694 45% 1,078
Manica Cidade De Chimoio 616 45% 123
Maputo Province Cidade Da Matola 4,657 35% 931
Inhambane Cidade De Inhambane 310 40% 124
Niassa Cidade de Lichinga 885 40% 354
Cabo Delgado Cidade de Pemba 880 40% 352
Nampula Cidade De Nampula 5,308 50% 2,654
Zambezia Cidade De Quelimane 1,071 40% 428
Tete Cidade De Tete 900 44% 396
Gaza Cidade de Xai-Xai 294 40% 118
Niassa Cuamba 424 40% 170
Manica Gondola 154 40% 62
Zambezia Gurue 500 40% 200
Nampula Ilha de Mocambique 630 15% 94
Manica Manica 616 40% 246
Maputo Cidade Maputo City Cluster 2,889 60% 1,180
Inhambane Maxixe 457 40% 183
Zambezia Milange 500 40% 200
Maputo Moamba 122 40% 49
Tete Moatize 203 44% 89
Zambezia Mocuba 821 44% 361
Nampula Nacala 928 67% 619
Sofala Nhamatanda 145 20% 29
Total 27,618 39% 10,712
*Coverage of percent knowing HIV status is unknown. HIV positive people are not excluded from this figure.
33 | P a g eYou can also read