CORPORATE PRESENTATION - September 2018 - Arca Continental

Page created by Ray Lawson
 
CONTINUE READING
CORPORATE PRESENTATION - September 2018 - Arca Continental
CO RP O RATE P RESEN TATIO N
         September 2018
CORPORATE PRESENTATION - September 2018 - Arca Continental
Years

…strong relationship with
                             2
CORPORATE PRESENTATION - September 2018 - Arca Continental
Serving                                                                      USA

                                                                                MEXICO

  5 countries across the Americas
 Sales                 Production                                            ECUADOR
Vo l u m e              Facilities                  Associates

                                                                                         PERU

2.2
BUC
              8*
              US$B
                          50           359            60
                                                     Thousand
                                                                  +1
                                                                  Million
                                                                                          ARGENTINA

             Revenue                 Distribution                Points of
                                       Centers                     Sale

                                                                                                      3
CORPORATE PRESENTATION - September 2018 - Arca Continental
A balanced portfolio of markets and business…
                                                                PERU

                                       MEXICO
             EXPORTS AND                                  11%               ECUADOR
               VENDING

                                                                 8%
                1%                          37%                                ARGENTINA
                                                    PRO-FORMA          6%
                           CAC
              2002         18%
                                 12x                 2017              6%      SNACKS &
                                                                               OTHER BUSINESS

 MEXICO        99%
 BEVERAGES
                                                         32%           UNITED STATES

       Mxp$ 13 billion
                                                Mxp$ 154 billion

                                                                                       4
CORPORATE PRESENTATION - September 2018 - Arca Continental
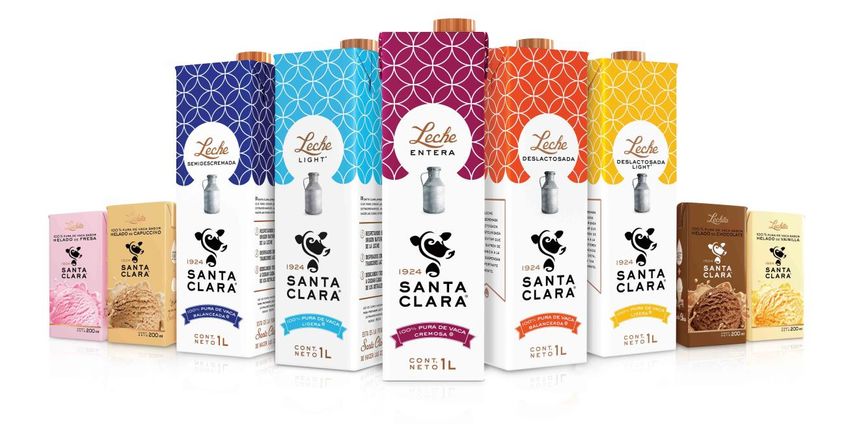
…with on strong organic growth and an
excellent M&A track record

                                                                                                     Great Plains

2002     2007       2008            2010      2011      2012         2014       2015    2016         2017
ARCA     Snacks    Argentina &      Ecuador   CONTAL    Snacks &     Tonicorp    Peru   Sugar Mill   USA, AdeS
Merger   Mexico   Jugos del Valle             Merger   Santa Clara                      Argentina    & Snacks
                                                                                                                    5
CORPORATE PRESENTATION - September 2018 - Arca Continental
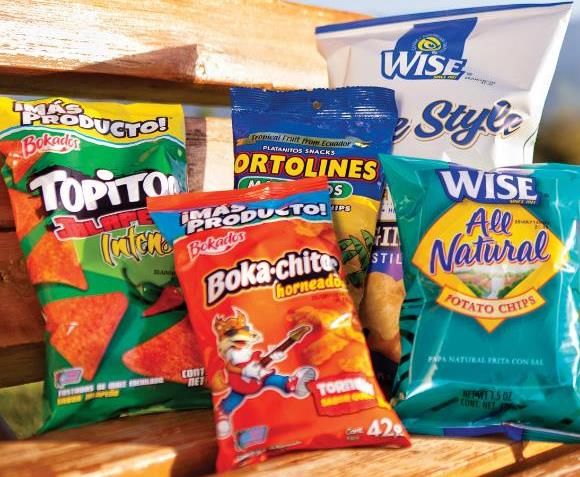
Our commitment to always pursue value
creation opportunities our shareholders

                                  SSDs
                     New sparking beverage franchises

                               CORE
                              NARTD
                                                                            Stills
     Food & Snacks                                         Emerging still categories + Value added diary

                     NARTD: Non-alcoholic ready to drink                                                   6
CORPORATE PRESENTATION - September 2018 - Arca Continental
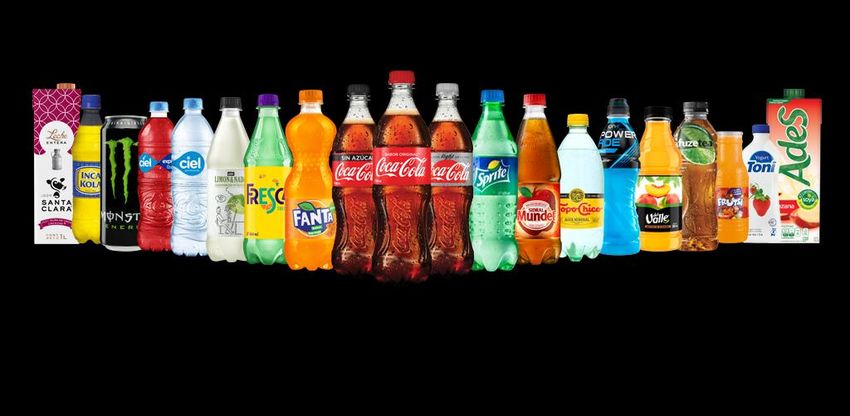
A wide brand portfolio to satisfy every
occasion of consumption

              + 28 Brands                 +60 Brands
     2006     +   128 SKUs       2017     +1,500 SKUs

                                                        7
CORPORATE PRESENTATION - September 2018 - Arca Continental
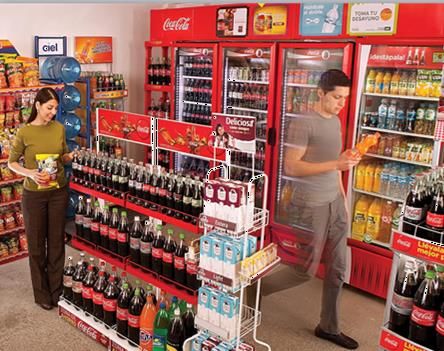
Strong presence in attractive markets…
                             MEXICO
                                                                                    USA
                             Start date: 1926
                             • Sales volume (MUC): 1,200                        Start date: 2017
                             • % of KO volume: 30%                              • Sales volume (MUC): 440
                             • Population served (MM): 30                       • % of KO volume: 14%
                                                                                • Population served (MM): 34

                               ECUADOR

                               Start date: 2010
                               • Sales volume (MUC): 137
                               • % of KO volume:100%
                               • Population served (MM): 16
                                                                                                     ARGENTINA
                                               PERU                                               Start date: 2008
                                                                                                  • Sales volume (MUC): 128
                                                 Start date: 2015
                                                                                                  • % of KO volume: 21%
                                                 • Sales volume (MUC): 297
                                                                                                  • Population served (MM): 9
                                                 • % of KO volume: 100%
                                                 • Population served (MM): 32

____________________
MUC –Million Unit Cases
KO – The Coca-Cola Company                                                                                                      8
CORPORATE PRESENTATION - September 2018 - Arca Continental
…with a model that connects the entire
organization in order to reach the perfect
execution
      Segmentation
                                                    METRICS
                RGM

               Picture of Success               FUNDAMENTALS

                              RTM

                                 Market Audit      Customer
                                                Love Score (CLS)
                 Digital Tools

                     People

                                                                   9
CORPORATE PRESENTATION - September 2018 - Arca Continental
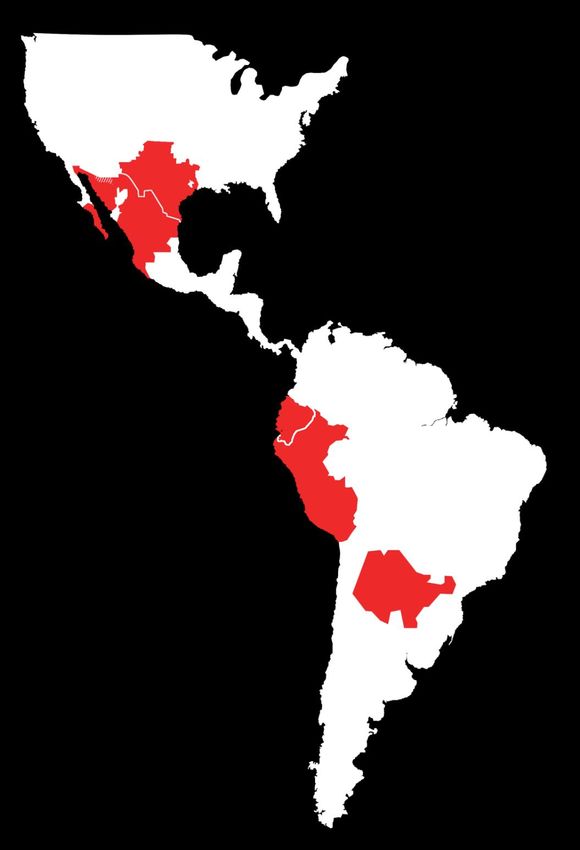
Value share above market share in all of our
operations

     Mexico      Argentina    Ecuador       Peru         United
         78%                        77%                  States
   74%                       74%                 74%
                       67%                67%
                58%                                           45%
                                                       42%

     4 Pts.       9 Pts.       3 Pts.       7 Pts.       3 Pts.

   SOM    SOV   SOM    SOV   SOM    SOV   SOM    SOV   SOM    SOV

                                                                    10
Innovation at Arca
      Continental
Developing fundamental capabilities

 Innovation
         Data               Algorithms             Technology            Talent

                        +                      +                    +

     Enough data for          Econometric            Advanced              Creating a
     next study cases        algorithms and        Data Lake from       specialized team
                            machine learning         Microsoft

                                                                                           12
Understanding key variables to drive growth

                                                      “Why   Model”

    175 Variables                       93 Variables                          11 Sets of                              3 Categories
                                                                              Variables

           Price Gap                                         Sales Visits
           Promotion & Advertising                           New Customer                                           Economic
           Price Change                                      Performance                                            Environment
           Holiday and                                       Service Indicators                                     High Temperature
           Weekend Stockup                                   RED Improvement                                        Weather

     19%                        16%                   10%    2%        14%             3%         11%              7%          4% 4% 4%

                          Findings
                           FINDINGS                                                      Actions
                                                                                         ACTIONS

         Identify key variables of overall performance and        Price Religion and Fundamentals
          build a scorecard, also differences between Arca
                       Continental´s Markets                       We strengthen our price religion in territories with high
                                                                    price elasticities and build our fundamentals (KPI´s)
                                                                                                                                          13
Concrete use cases to apply analytics to
improve execution at the point of sale

      1. PRODUCT AVAILABILITY            2. COMMERCIAL EXCELLENCE

      Forecast non-availability of        Quantify the effect of each
     products by SKU and create a       execution variable by POS and
      "suggested order“ by POS                   prioritize it

      Out of stock       Contribution     Volume sales     Contribution
        in POS             margin           increase         margin

        1-2 p.p.                             2-3%

                                                                          14
Improving sales performance in traditional
channel with technification

                               Customer Benefits
• Improving store activation                       • Increases traffic, sales and profits
                                                   • Additional income from e-payments
• Adding Web-enabled POS                           • Competitive advantage

    Active         Sales
  Customers      increase

 ~1K              3%           AC Benefits
                                                   • Sales information on all categories
                                                   • Customer insights
                                                   • Discounts Control

                                                                                           15
Mexico
A flexible price-pack
architecture to drive
consumption and                                                   +20 SKUs only for regular Coke in Mexico

profitability                                                                                                        MXP
                                                                                                                    $34
                                                                                                           2.0
                                                                                                           Ref     3.0
                                                                                                           Pet     NR
                                                MXP                             600
                                                       355                      PET
       PACKAGE                FORMAT            $6     ml
                                                        VR                            Retornable 66%
                         SINGLE SERVE                                                        No Retornable
NON RETURNABLE

                                                      $6     $6                $10         $13           $20 $25
     34%
                          48%
                                         52%
                                                        Low elasticity SKU´s               Protect affordability
                 66%
                                                                                              (multi-serve &
                                                                                               Returnable)
            RETURNABLE             MULTISERVE
                                                                  Leverage on single serve presentations

                                                                                                                         17
Maintaining leadership in core Mexico
market while growing diversified portfolios
 Expanding value-added dairy
 •   Strongly positioned in consumer preferences
 •   Tripled sales and increasing point of sales coverage of 44%
     in traditional channel
 •   Leveraging the Direct to Home channel
 •   More than 5,500 coolers introduced in 2017
 •   Maintained a CAGR of 28% in 2017

Growing still beverages portfolio                                            Market share of Powerade relative to competition
                                                                                                  (%)
                                                                                                                                                         100%
 •   Very positive trend in market share across all categories       85%
                                                                                                                                                         80%
 •   Command #1 or #2 market leadership in most still categories
                                                                                                                                              60%
 •   Continue strengthening our portfolio through Ades acquisition                                                                                       60%

 •   Profitable single-serve presentation and premium pricing                                                                                            40%

                                                                     11%                                                                                 20%
                                                                                                                                            38%
                                                                                                                                                         0%
                                                                     2006   2007   2008   2009   2010   2011   2012   2013   2014   2015   2016   2017

                                                                                            Main Competitor                  Powerade
                                                                                                                                                                18
South America
South America: AC operates in attractive
   Markets with positive growth outlook

          ARGENTINA - 2008                              ECUADOR - 2010                                        PERU - 2015
• Revenue growth management initiatives
  enable us to compensate for high inflation   • Reformulating products to offer more low-       • Solid annual GDP growth since 2010,
  rates maintaining profitability despite        calorie or zero calorie options (first in the     averaging 4.3%
  macroeconomic volatility                       world)
                                                                                                 • Delivered annualized synergies of USD $40
• Continue expanding point-of-sale             • Focus on affordability products in key            million, 60% above the original target
  execution capabilities through our             entry packages
  commercial model                                                                               • Reduced debt and exposure to foreign
                                               • Capturing cost savings by centralizing
                                                 production capabilities in new Tonicorp’s         exchange debt by 80% with a three-notch
• Strengthened vertical integration with
                                                 plant                                             uplift by Fitch Ratings
  Famaillá sugar mill to optimize sweetener
  cost                                         • Approximately 17,000 new coolers                • Aim to accelerate and innovate in still
                                                 introduced to capitalize on future volume         beverages, while focusing on warehouse
                                                                                                   infrastructure optimization while increasing
                                                                                                   own sales force and distribution capabilities
                                                                                                                                               20
Investing in core capabilities and increasing
         profitability in South America

                                                   Cooler                      EBITDA /                   Cooler        EBITDA /                   Cooler       EBITDA /
                      MUCs                                                                    MUCs                                        MUCs
                                                 Coverage (1)                    Sales                  Coverage (1)      Sales                  Coverage (1)     Sales

                                                                                                                                          297
                                                              61%                                                                   278
                                                                                                 137           48%                                                    21%
                                                                                     21%                                                                33%
                               128                                                                                           18%
                                                                                                                                                                18%
                  118
                                                                                           119                         17%                       29%
                                                                                                        24%

                                               18%                            10%

                2008* 2017                     2008* 2017                     2008* 2017   2010* 2017   2010* 2017     2010* 2017   2015* 2017   2015* 2017     2015* 2017
____________________
*End of the year acquisition of each territory
MUCs – Million Unit Cases
                                                                                                                                                                             21
(!)Cooler Coverage – Percentage of points of sales with at least one cooler
22
AC Corporate Structure
        Arca Continental (AC) & Coca-Cola
        Refreshments USA (CCR), a fully-
        owned subsidiary of The Coca-Cola
        Company (TCCC), signed last                                                                                        Market Cap(1):   USD$192 Bn                         Market Cap(1): USD$11.6                 Bn
        February a Definitive Agreement
        that establishes the following:
                                                                                                                                 Coca-Cola Refreshments
                                                                                                                                                                      (2)           (2)
        ▪      AC contributed to AC Bebidas its interest in the                                                                                                20%            80%                            100%
               equity stake of all its beverages business
        ▪      TCCC contributed CCR’s Southwest Operating                                                                                                                                           AC Complementary
               Unit territory (Texas, parts of New Mexico,                                                                                                      AC Bebidas
                                                                                                                                                                                                         Business
               Oklahoma, Arkansas) including its assets and
               related liabilities in exchange of a 20% equity
               stake in AC Bebidas
                                                                                                                          39%          61%                            100%                               100%
        ▪      The newly created entity, Coca-Cola Southwest
               Beverages LLC (CCSWB), has the rights to
               bottle, distribute and sell Coca-Cola beverages                                                                                                                                      Coca-Cola Southwest
                                                                                                                                       Peru                          Mexico
               in southwestern US                                                                                                                                                                        Beverages
        ▪      AC’s Complementary Business portfolio                                                                                                  100%                                100%
               consists of snacks products

                                                                                                                                                   Argentina                              Ecuador

____________________
(1) Considering a share price as of December 30, 2017. AC market cap was calculated using an exchange rate of MXP$18.90
(2)Participation after the contribution of all of AC’s Beverages Business.
                                                                                                                                                                                                                            23
AC joined the Coca-Cola System in the US in
    April 2017
                                                                                     Oklahoma

  • Sales volume of 440 MUC and 2017 revenues of US$2.7 Bn
  • 10 production facilities, 40 distribution centers and over 8,700                             Dallas
                                                                       El Paso    Abilene
    associates
                                                                                                           Nacogdoches
  • Expected annual synergies: US$90 million by year 3                                      Fort Worth
                                                                                                 Houston
  • U.S. market share of approximately 42%                                       San Antonio

  • Consumer environment with similar dynamics as Mexico
  • ~ 30 million consumer in market with 40% Hispanic                                 McAllen        Gulfgate

  • AC will deploy core pillars: commercial model, operational
    excellence and supply chain management
  • Potential to expand snacks business presence in the US and
    increase sales of Topo Chico mineral water and Coca-Cola
    “Nostalgia”

____________________
MUC – Million Unit Cases
                                                                                                                  24
Detailed work plans for short and mid-term
identified synergies
Revenue:
• Vending
• Topo Chico
• Mexican Coke              Savings:
                            • In-line blow molding (ILBM)
                            • Direct Procurement
Strategic:                  • Improvement in production lines
• New facility in Houston   • Lightening of the PET bottles
• Shared Services           • Reduction in freight costs

More than 30 projects to reach
         USD$ 90 MM in 2020
                                                                25
CCSWB Wins 2018
 Market Street
 Challenge
• Coca-Cola Market Street Challenge
  recognizes excellence in market
  execution across major retail channels
• CCSWB competed against eight Coca-
  Cola bottlers from a wide range of
  geographies and sizes
• While the company’s first year was
  focused on exceptional customer
  service and smoothly managing its
  transition to Arca Continental, the
  team also began laying the
  groundwork for significant               Through a Culture of Excellence
  improvements in customer execution
                                                  in Execution…
                                                                             26
CCSWB is now above the total level of U.S.
execution metrics across all channels

                                             27
Our McAllen manufacturing team has
been awarded the 2017 President's
Award for Quality Excellence
                                      • McAllen is the best facility in North America
                                        to receive the award this year from Coca-
                                        Cola, competing against 71 facilities for the
                                        distinction
                                      • To win each Coca-Cola facility in North
                                                               66%
                                        America is scored on their commitment,
                                        compliance and capability
                                      • In each measure, the McAllen facility scored
                                        highest of any Coca-Cola facility in the
                                        region. Additionally, Coca-Cola Southwest
                                        Beverages had 2 of the top 10 highest-
                                        scoring facilities and 5 in the top 25

         CCSWB team can truly say they have the highest
         quality Coca-Cola facility in all of North America                        28
CCSWB to build new plant in Texas
• Investment of US$250 million in a facility
  close to 1 million square feet in size
• First Coca-Cola production plant built in
  the U.S. in a decade
• State of the art technology, with five new
  production lines and in-line blow
  molding capabilities
• Includes distribution facilities, warehouse
  and sales, which will enable CCSWB to
  efficiently serve the Southeast Texas
  market.
• Close to USD $30 million in cost
  savings and operating efficiencies, as
  part of the USD 90 million synergy
  program.
                                                 Scheduled to begin
                                                operating in early 2020   29
Food and Snacks
Continue accelerating growth and gaining
scale in snacks & other business

         Vending             Direct to home                    Snacks
       #1 Vending Operator    Beverages delivered    Participating in the industry with
        In Mexico and Peru     to 600,000 homes     Leading brands and Gaining scale

                                                                                          31
High potential growth opportunity based on
strategic adjacencies

                      USD$ 360 MM in 2017
                         Complementary to our core business

                         Expand snack business in Mexico under Bokados
                                  and complements with Wise

                              Strengthen our presence in the US and Ecuador

                                                                          32
Strengthening our snacks business
with Deep River brand

• 2017 Net Sales:  US$ 45 MM
• Founded in 2002 by Jim Goldberg
• Portfolio oriented to Better for You products,
  mainly Kettle chips
• Products certified as gluten-free, without
  artificial ingredients
• Deep River complements Wise's portfolio
• Arca Continental becomes a more significant
  player in the salty snacks industry in the United
  States

                                                      33
Financial
Per formance
Delivering strong and consistent results
                                  Consolidated                Results
                                                                                                 $13
                          $137                                 $26
                                                                                                 $11

                          +46%                          $20
                                                               +30%                            +45%
                                                                                          $9
                        $94                             $17                              $8
                  $76                                                               $7
                                                  $14
                                            $13                                $6
        $60 $62                       $11
Conservative debt profile & diversified
         maturity schedule

           Debt Maturity Profile                                                                                                               PEN
           Total Debt:             MXP$ 56,923 million                                                                      USD           13%
                                                                                                                                                       ARS

                                                                                              7,945
                                                                                                                                                1%
                                                                                                                    7,945
                                                                                                                              39%
                        7,119
                                6,868
                                                                               6,378                                                   By               MXP
                                       5,721 5,742
                                                                                                                                    Currency                                  Variable

                2,888
                                                      2,175            2,356                                                                   47%
                                                               1,487                                                                                                      28%
       296
                                                                                                                                                                   By
                                                                                                                                                              Interest Rate
       2018      2019   2020    2021    2022   2023     2024   2025    2026    2027    2028   2029    2030   2031   2032
                                Bank Loans                     Bonds

           •       96% debt is in local currency
           •       Projected debt profile with average maturity of 7 years                                                                     Fixed     72%

____________________
                                                                                                                                                                                  36
*Using an exchange rate as of June 2018 of MXP$ 19.86
Highest credit rating
among Mexican companies
              Global Scale                            Net Debt / EBITDA

                                                    1.9

    “A2”                       “A”                            1.3
                                                                       1.2
              National Scale

  “AAA(mex)”              “mxAAA”
                                                    2015     2016    Jun '18
 Global Investment Grade above Mexico’s
             sovereign rating             Financial flexibility and low leverage ratio 37
History of
  discipline           Sales                                                     >200
  growth               MXP$ billion                                        2x

                                                                   2x
                                                      2x
                                                                        100
                                          2x               56
                                               25
                                   13

                                   2002        2008        2012         2017     2022
                       Net Debt
                       to EBITDA   0.2x        0.5x         0.8x          1.2x

____________________
*As of March 2018                                                                       38
Social
Responsibility
Strong commitment towards
            our environment

                                 RECYCLING                  WATER*                    ENERGY*
                                  Mexico 2017

                      28%                  of PCR   1.7      Water Lts. /
                                                             Beverage Lts.     25.8        g CO2/
                                                                                           Beverage Lts.

                    51,049 Tons                     17% improvement          11% energy reduction
                    of resin produced by PetStar             vs 2010                  vs 2010

             Mexico is the global leader in          Leader in water reuse       25% from renewable
                  recycled resin use                     technology                    sources
____________________                                                                                       40
*2017 data for AC consolidated
Key investment
     Highlights
Key investment highlights

        Global leader…         One of the largest Coca-Cola bottlers in the world with
                               a leading profitability in the KO System

                               Resilient and defensive industry
    …in the right markets…
                               Strong presence in attractive markets

                               Highly diversified and well-balanced geographic
     …the right products…      presence with a wide product portfolio and
                               distribution channels

                               Proven track record of disciplined growth
   …and a disciplined growth
           strategy            Strategic business model that connects the entire
                               organization in order to optimize execution
                                                                                         42
TH AN K YO U!
J U LY 2 0 1 8

Investor Relations Contact Information:
Ulises Fernandez   ulises.fernandezdelara@arcacontal.com
Felipe Barquin     felipe.barquin@arcacontal.com
Pamela Ortiz       pamela.ortizsa@arcacontal.com
Francisco Leyva    franscisco.leyvaa@arcacontal.com
You can also read