Corporate Presentation - January 2020 - ElringKlinger AG

Page created by Dwight Bowman
 
CONTINUE READING
Corporate Presentation - January 2020 - ElringKlinger AG
Corporate Presentation
January 2020
Corporate Presentation - January 2020 - ElringKlinger AG
ElringKlinger
In a nutshell

                    Headquartered in
                    Dettingen/Erms,      EUR 1,699 mn
                                         in sales
                    close to Stuttgart

                    45 locations         5.9%
                                         EBIT margin pre PPA

                    Family as a          More than
                    strong anchor        10,000
                    shareholder          employees

                                         Founded in
                    +10%
                    CAGR since 2005      1879
                                                      All figures refer to FY 2018

Corporate presentation | January 2020                                           2
Corporate Presentation - January 2020 - ElringKlinger AG
Markets
Megatrends trigger technological transformation process

                   Urbanization                             Safety systems

                   Scarcity of resources                    Autonomous driving
                                                Global
                                             megatrends
                   Globalization
                                            transform the   Efficient propulsion
                                             automotive
                                               industry
                   Technological progress                   Connectivity

                   Climate change                           Shared mobility

Corporate presentation | January 2020                                              3
Corporate Presentation - January 2020 - ElringKlinger AG
Markets
EU tightens CO2 limits until 2030 even further

CO2 limits – in g/km

                                        EU 2021                                            South Korea 2020
                                        95g CO2/km average                                 97g CO2/km average
                                        fleet emissions                                    fleet emissions

                                                                            China 2025
                                        EU 2025                             94g CO2/km average
                USA 2025                15 % reduction of average fleet
                                                                            fleet emissions
                91g CO2/km average      emissions (base year: 2021)
                fleet emissions                                                                     Japan 2030
                                                                                                    32% reduction of average fleet
                                                                                                    emissions (base year: 2016)
                                        EU 2030
                                        37.5 % reduction of average fleet
                                        emissions (base year: 2021)

                                                                                 Source: Fraunhofer ISI, ElringKlinger research

Corporate presentation | January 2020                                                                                        4
Corporate Presentation - January 2020 - ElringKlinger AG
Markets
 New drive trains will be single growth driver from 2025 onward

 Global light vehicle production per drivetrain – in million units

                                                                        CAGR
                                                                        +2%

                                                                            …for tapping the potential

                                Managing the growth…

2017      2018       2019        2020         2021       2022        2023     2024   2025   2026     2027       2028       2029       2030

       Combustion        Hybrids         Full electric
                                                                                             Source: PWC Autofacts, ElringKlinger research

 Corporate presentation | January 2020                                                                                                  5
Corporate Presentation - January 2020 - ElringKlinger AG
Group strategy
Managing the growth in classical business areas

    Cylinder-head                       Specialty          Shielding       Plastic housing
       gaskets                           gaskets          technology          modules

 • Strong market positions associated with technological niches
 • Benefiting from global production network
 • Utilizing profound and detailed product and process know-how
 • Concentrating on improved processes to avoid additional costs
 • Optimizing inventories
 • Repayment of financial debt

     • Disciplined investments for managing the growth
     • Stable growth path of sales in the medium term according to market development

Corporate presentation | January 2020                                                        6
Corporate Presentation - January 2020 - ElringKlinger AG
Group strategy
Generating future growth in new business areas

         Battery                              Fuel cell               Electric               Structural
         systems                              systems                drive unit           lightweighting
 • Established supplier                 • PEM fuel cell stack   • Strategic minority     • Unique production
   for large series of                    ready for marketing     stake in engineering     technology
   Battery components,                  • Components              service provider       • Series orders in
   i.e. cell contacting                   available as well       hofer powertrain         delivery phase
   systems                                                      • Currently set-up of
                                        • Next step:                                     • Next step: further
 • Next step:                             installation of         small series             ramp-ups and new
   industrialization of                   automated               production               contracts expected
   complete battery                       production line
   systems

     • Focused capex spending
     • Strong growth of e-mobility areas from 2020/21 on with lightweighting further ramping up

Corporate presentation | January 2020                                                                           7
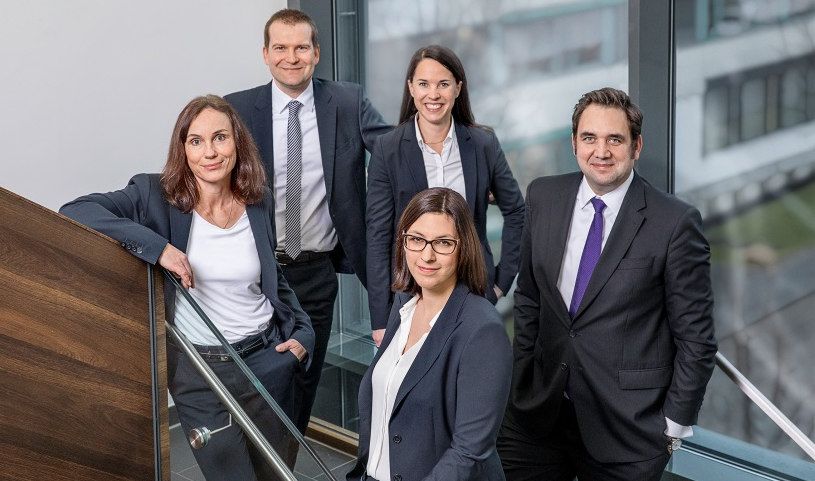
Corporate Presentation - January 2020 - ElringKlinger AG
Group strategy
ElringKlinger with expertise for components, modules and systems

        Battery

        Fuel cell

           EDU

                                        Components   Modules   Systems   Customers‘
                                                                           needs

Corporate presentation | January 2020                                          8
Corporate Presentation - January 2020 - ElringKlinger AG
Group strategy
    ElringKlinger’s sales structure of products will change

    Sales split (actual and ambition) – in % of total sales

                              Actual 2018                                        Ambition 2030

                            Non-automotive                                 Non-automotive
                            products                                             products
           Aftermarket
                                 5%                                Aftermarket     ~10%
                          9%                                                                        Functional
     Structural                                                                                     components
   lightweight                                                               ~10%
                    7%
and e-mobility
      products
                                                                                                 25%
                                              79%
                                                                    Structural
                                                              lightweight and
                                                Functional
                                                                    e-mobility
                                                components
                                                                      products

    Corporate presentation | January 2020                                                                   9
Corporate Presentation - January 2020 - ElringKlinger AG
Group strategy
Nominated e-mobility volumes create a healthy basis for future sales

Nominated volumes* – in EUR million

  1,000

                                                             ~15%
                                                                                           • Strong growth particularly in the
                                                                                             fuel cell and battery business
                                                             ~50%
                                                ~15%                                       • Acceleration especially after
                                                                                             ramp-up years 2019 and 2020
                                                ~55%
                                                                                           • Includes systems as well as
                   ~25%             ~25%                                                     components nominations by
                                                             ~35%
                    ~40%            ~60%        ~30%                                         different OEMs worldwide
                 ~35%               ~15%

  2019e          2020e          2021e         2022e         2023e

     EDU        Fuel cell systems       Battery systems and components

* Scheduled revenues in e-mobility products according to received OEM nomination letters, final revenues dependent on definitely called volumes

Corporate presentation | January 2020                                                                                                       10
Group strategy
Major new contract wins for new business fields

        New US OEM                       New US OEM        New US OEM         Chinese OEMs

                                                                #
     Cross-car beam                     Cross-car beam                       Fuel cell systems
                                                                                 More than
          SOP 2020                        SOP 2020                            20 development
                                                         Front-end carrier        projects
                                                          Battery system
                                                             SOP 2021

Corporate presentation | January 2020                                                            11
Group strategy
Higher degree of vertical integration results in more content per car

Content per car – in EUR

               Present                                        Future

            40 - 60 EUR                 Content per car   100 - 10,000 EUR
   (100-150 EUR incl. cross-car beam)

Corporate presentation | January 2020                                        12
Financials
Q3 2019
Strong sales growth despite market downturn

Order intake – in EUR million                            Order backlog – in EUR million
                          +6.3%                                                   +4.0%
                     FX adjusted: 0.8%                                       FX adjusted: +1.9%

                            498                                                   1,077
   412                                   420     438                                           1,063    1,069
               391
                                                           1,027      1,020

Q3 2018         Q4          Q1           Q2    Q3 2019   Q3 2018        Q4          Q1            Q2   Q3 2019

Sales – in EUR million                                   Sales bridge – in EUR million/ in %

                          +6.4%                                                  +6.4%

   406         432          441          434     432                                                    431.9
                                                                                               +16.2
                                                                                    -0         +4.0%
                                                                       +9.9        -0%
                                                          405.8
                                                                      +2.4%

Q3 2018         Q4          Q1           Q2    Q3 2019   Q3 2018        FX         M&A         Organic Q3 2019

Corporate presentation | January 2020                                                                            14
Q3 2019
Sales in North America continue to grow strongly
Sales by region – in EUR million
Share of total sales – in %

                           South America and Rest of World
                                                   20 (19)
                                                                        Germany
                                   Asia-Pacific            4%           97 (103)
                                       80 (77)            (5%)
                                                                     22%
                                                   19%              (25%)
                                                  (19%)

                                                           EUR
                                                           432
                                                          million
                                                   27%                28%
                                                  (23%)              (28%)
                              North America                                  Rest of Europe
                                   115 (92)                                  120 (115)

                                                            2018
Previous year’s Q3 figures in brackets

Corporate presentation | January 2020                                                         15
Q3 2019
Sequential improvement of earnings over the 2019 quarters

 EBIT (pre PPA) – in EUR million
 EBIT margin (pre PPA) – in % of total sales                    EBIT (pre PPA) bridge – in EUR million

                         -13.0%
                                                                                              -13.0%
   23.9
                                                   20.8
                                                                   23.9         +4          -4
               11.8                                                                                      +2
                                        10.7                                                                       -5
   5.9%                       6.9                  4.8%                                                                       20.8

 Q3 2018        Q4            Q1         Q2       Q3 2019       Q3 2018 Tariffs/         NAFTA/       Cost      Others* Q3 2019
                                                                              duties    Ramp-ups     savings

 Net income (attr. to shareholders) – in EUR mn                 Earnings per share – in EUR

                         -38.0%                                                          -35.3%
   10.8                                                            0.17
                                                    6.7                                                            0.11

                -1.2        -1.5                                               -0.02      -0.02
                                        -8.6                                                          -0.14
 Q3 2018        Q4            Q1         Q2       Q3 2019       Q3 2018         Q4          Q1           Q2     Q3 2019

Differences due to rounding                                 * Net impact includes increase personnel cost, R&D capitalization and others

Corporate presentation | January 2020                                                                                                16
Q3 2019
Aftermarket segment expanded its sales and improved its margin

Sales – in EUR million
EBIT margin – in % of segmental sales

             Original Equipment (OE)                                       Aftermarket
                          +5.4%
                                                                             +20.2%
   335         365          361         361     353
                                                          38         37        45        41       45
    3.1%                                       1.8%      15.7%                                   18.8%

Q3 2018         Q4          Q1          Q2    Q3 2019   Q3 2018      Q4        Q1        Q2     Q3 2019

                 Engineered Plastics                              Industrial Parks & Services
                                                                          (sales only)
                          -0.3%
                                                                             +9.1%
    30                      32          29      30
                27                                        3.3        3.7       3.5                3.6
  21.9%                                                                                  3.1
                                               16.3%      1.0        1.2       1.1                1.2     Industrial Parks
                                                                                         1.1
                                                          2.3        2.5       2.4       2.0      2.4     Services

                                                        Q3 2018      Q4        Q1        Q2     Q3 2019
Q3 2018         Q4          Q1          Q2    Q3 2019

Corporate presentation | January 2020                                                                                17
Q3 2019
Strong focus on cash flow optimization

               Earnings                   Net working capital                               Capex

Measures with short and mid-term                    Measures:
impact:                                             • Extending payment terms for
• Group-wide cost reduction program                   trade payables                           Disciplined
                                                                                               approach
• Optimizing op. performance in                     • Reducing level of trade receivables
                                                                                               continued
  Switzerland and North America                     • Improving inventories
• Paybacks of duties in Q3

                                  Improvement of operating free cash flow

Corporate presentation | January 2020                                                                        18
Q3 2019
Gradual improvement of net working capital in 2019

Net working capital – in EUR million

                    -15.8%
                606
    568          9                                                          Optimizing inventories in locations worldwide
                            499         478
     6
                            10           9    Current contract assets       • Focus on supplier-owned inventories
                                                                            • Increase of inventory turnover
                415                                                         • …
    401
                            393         387   Inventories

                                                                            Balancing trade receivables and trade payables
                                                                            • Reduction of share of overdue receivables
    306         332                                                         • Reduction of payment periods to
Q3 2019
Disciplined capex approach continued

Capex (in PPE) – in EUR million
Capex ratio – in % of total sales                        Operating free cash flow – in EUR million

                         -52.9%                                                 >+100%
   53.9                                                                                        98.6

               41.9

                                                                                                       30.8
                           28.8
                                                25.4
                                        20.7                            2.6

   13.3
                                                                                  -19.3
                                                 5.9

                                                           -46.5
Q3 2018         Q4          Q1          Q2     Q3 2019   Q3 2018        Q4          Q1         Q2     Q3 2019

Corporate presentation | January 2020                                                                           20
Q3 2019
Cash flow used for net debt reduction

Net financial debt – in EUR million                            Maturity structure of financial debt – in EUR mn

                     -5.9%
                796
    724         46          700         681
                            45          50    IFRS 16
                196                                                                                                  514
                            187               Current
    297                                 218
                                              financial debt

                617
                            556         520   Non-current                                             180
    472
                                              financial debt
                                                                                           48         177                        46

     -45                                                                                                3
                 -63        -107 Cash
                            -88                                                                             due 2019
                                    and cash
  Dec. 31, Mar. 31 Jun. 30 Sep. 30, equivalents                  -107
   2018                     2019                                             -130
                                                                Cash and   Credit        Credit     Current          Non-       Non-
                                                                  cash      lines         lines     5 years)

Corporate presentation | January 2020                                                                                                 21
Outlook
Outlook 2019: Markets
Production estimates adjusted downwards monthly

Forecasts global auto production 2019 – in %                         Forecasts auto production China 2019 – in %

                                                                                                           11.2

                                                                      8.3                            8.8

  5.9                                                                       6.1
        4.9                                                                                                       4.2
              3.3                3.7 3.3                                                                                3.4
                                                                                  2.0
                    0.2                    0.2

                                              -1.1                                                                            -0.8
                          -3.2                                                      -3.8
                                                     -5.5                                   -5.3
              Q3                           Q4e                                    Q3                          Q4e

Estimation in              Jan 19          May 19           Oct 19
                           Mar 19          Jul 19                                       Source: JP Morgan, IHS, PWC Autofacts, ElringKlinger research

Corporate presentation | January 2020                                                                                                             23
Outlook 2019: Markets
Global production forecast for FY 2019

Light vehicle production growth – in % vs. 2018

         -4 to -2 %                                  -3 to -1%                         -9 to -7 %
       North America                                  Europe                             China
      • Strong demand for SUV                     • Lowered production            • Suffering from trade
      • Trade conflict unresolved                   schedules                       conflict
      • Strike with impact on                     • Brexit unclear                • Premium segment still
        production                                                                  solid

                             -3 to -1 %                                  -6 to -4%
                           South America                                  Global
                    • Slight growth in Brazil
                    • Growth due to base effect

                                                                          Source: IHS, PWC Autofacts, ElringKlinger research

Corporate presentation | January 2020                                                                                    24
Expectations for FY 2019
Various factors with positive impact on FY 2019 earnings

                     External factors                               Internal factors

 • Material cost and duties                           • Optimization of operating performance
   – Antidumping and countervailing duties              in North America
     avoided in H2                                    • Further improving fixed cost base in
   – Expansion of supplier base                         Switzerland
   – Incremental effect from higher raw
     material prices will phase out                   • Scheduled real estate sale
                                                      • Tightened cost saving measures, esp.:
 • Personnel cost: Collective wage increase             – Reduction of personnel cost
   as of April 2018 with no incremental effect          – Reduction of discretionary cost
   as from Q2                                           – Hiring freeze in classical business areas

                     Expected EBIT margin pre PPA of around 4 to 5% in FY 2019

Corporate presentation | January 2020                                                                 25
Outlook 2019: Group
2019 – A year of transformation

                                         2019                  Mid-term
                               Global LV production:
                                       0 –1%
                                          -6% to -4%
                                                                LV production CAGR:
                                in a challenging environment
                                                                       +2%
                                       (prev.: -4 to -2%)

                                           Organic sales:          Organic sales:
                                          2 to 4 %-points       above global markets
                                        above global markets

                                        EBIT margin pre PPA:    EBIT margin pre PPA:
                                             ~ 4 – 5%          Successive improvement

Corporate presentation | January 2020                                                   26
Outlook 2019: Group
Further indicators for FY 2019 and in the medium term

                                                        FY 2018               FY 2019
                                                          actual             expected                            Mid-term
 ROCE                            in %                      5.5%    Below prior year level             Increasing based on
                                                                                                       earnings and NWC
                                                                                                           improvements
 R&D costs                       in % of total sales       5.1%                 ~ 5 - 6%                             ~ 5 - 6%
 (incl. capitalization)
 Capex                           in % of total sales       9.6%               Below 9%                Ongoing disciplined
 (in PPE)                                                                                                      approach
 Net working capital             in % of total sales      33.4%*   Below prior year level              Slight step-by-step
 (NWC)                                                                                                      improvement
 Operating FCF                   in EUR million            -86.2                 Positive                             Positive

 Equity ratio                    in % of total assets     42.8%                40 - 50%                              40 - 50%

 Net debt/EBITDA                                             3.7   Below prior year level
Appendix
ElringKlinger
Structural overview

                                            ElringKlinger Group
                    Sales           EUR 1,699 million                             EBIT (pre PPA)           EUR 100.2 million
                    Employees       10,429                                        EBIT margin (pre PPA)    5.9 %

                      Original Equipment                                                          Aftermarket
      83%             Sales:     EUR 1,408 million                                   9%           Sales:     EUR 159 million
                                                                                 of Group sales
   of Group sales     Employees: 9,232                                                            Employees: 203

                                         Exhaust Gas Purification                                 Engineered Plastics
                              Others
Mission statement
What is driving us

                      Our vision               Our mission

                                        Being an essential
                                           partner by
                                        (1)Providing technologically
             Green mobility                sophisticated solutions for
                                           customers’ needs
                                        (2)Shaping performance and
                                           quality to the next level
                                        (3)Assuming social responsibility
                                           as a global corporate player

Corporate presentation | January 2020                                       30
Group – Last 5 quarters
Key figures
                                                                   Q3 2019           Q2 2019             Q1 2019              Q4 2018               Q3 2018

 Order intake                                                            438             420                    498                   391                   412
 Order backlog                                                          1069            1,063                 1,077                 1,020                 1,027
 Sales                                                                   432             434                    441                   432                   406
 EBITDA                                                                    50             39                     35                    38                  48.4
 EBIT pre PPA                                                            20.8            10.7                    6.9                 11.8                  23.8
 EBIT margin pre PPA (in %)                                               4.8             2.5                    1.6                   2.7                   5.9
 EBIT (reported)                                                         20.3            10.2                    6.4                 10.6                  22.9
 EBT                                                                     15.3             1.5                    5.4                   7.2                 21.8
 Net income attributable to shareholders                                  6.7            -8.6                   -1.5                  -1.2                 10.8
 Earnings per share (in EUR)                                             0.11           -0.14                 -0.02                 -0.02                  0.17
 Capex (in PPE)                                                          25.4            20.7                  28.8                  41.9                  53.9
 Operating free cash flow                                                30.8            98.6                 -19.3                    2.6                -46.5
 Net working capital                                                    478*            499*                   606*                   567                   618
 Equity ratio (in %)                                                     40.7            40.7                  40.9                  42.8                  42.1
 Net financial debt                                                      682             700                    796                   724                   729
 Employees (as at quarter-end)                                        10,492           10,411               10,485                10,429                10,231

All figures in EUR million unless otherwise described, differences due to rounding              * Incl. current contract assets, less current contract liabilities

Corporate presentation | January 2020                                                                                                                          31
Group – Last 5 quarters
Segmental figures

                                                                   Q3 2019           Q2 2019    Q1 2019    Q4 2018   Q3 2018
 Group                         Sales                                      432            434        441        432       406
                               EBIT (reported)                           20.3           10.2        6.4       10.6      22.9
                               EBIT margin         (in %)                 4.7             2.3       1.5        2.5       5.6
 Original Equipment            Sales                                      353            361        361        365       335
                               EBIT (reported)                             6.4            2.0       -5.3       2.2      10.3
                               EBIT margin         (in %)                  1.8            0.6       -1.5       0.6       3.1
 Aftermarket                   Sales                                       45           40.9       44.7       36.7      37.6
                               EBIT (reported)                             8.5            6.7       7.3        4.1       5.9
                               EBIT margin         (in %)                18.8           16.4       16.3       11.2      15.7
 Engineered Plastics           Sales                                       30           28.7       32.2       27.0      30.2
                               EBIT (reported)                             4.9            1.7       4.1        3.7       6.6
                               EBIT margin         (in %)                16.3             5.9      12.7       13.7      21.9
 Services                      Sales                                       2.4            2.0       2.4        2.5       2.3
                               EBIT (reported)                             0.3           -0.4       0.3        0.3       0.0
                               EBIT margin         (in %)                12.5           -20.0      12.5       10.1       0.0
 Industrial Parks              Sales                                       1.2            1.1       1.1        1.2       1.0
                               EBIT (reported)                             0.2            0.1       0.0        0.3       0.1
                               EBIT margin         (in %)                16.7             9.1       0.0       27.3      10.0

All figures in EUR million unless otherwise described, differences due to rounding

Corporate presentation | January 2020                                                                                     32
Group – FY 2018
Consolidated income statement

                                                                                              2018     2017
 Sales revenue                                                                               1,699    1,664
 Cost of sales                                                                               -1,329   -1,256
 Gross profit                                                                                  370      408
 Gross margin                                                                        in %     21.8     24.5
 Selling expenses                                                                             -147     -142
 General and administrative expenses                                                           -84      -77
 Research and development costs                                                                -76      -71
 Other operating income                                                                         46       31
 Other operating expenses                                                                      -13      -12
 Operating result (EBIT)                                                                        96      137
 Finance income                                                                                 33       21
 Finance costs                                                                                 -43      -48
 Share of result of associates                                                                   -5       0
 Net finance costs                                                                             -15      -27
 Earnings before taxes (EBT)                                                                    81      110
 Income tax expenses                                                                           -34      -36
 Net income                                                                                     48       74
 of which: attributable to non-controlling interests                                             4        4
 of which: attributable to shareholders of ElringKlinger AG                                     44       70
 Basic and diluted earnings per share (EPS)                                         in EUR    0.69     1.10

All figures in EUR million unless otherwise describe, differences due to rounding

Corporate presentation | January 2020                                                                     33
Group – FY 2018
Consolidated statement of financial position
                                                As of Dec      As of Dec                                                            As of Dec   As of Dec
 Assets                                         31, 2018       31, 2017
                                                                              Liabilities and equity                                31, 2018    31, 2017
 Intangible assets                                   190            190       Share capital                                              63          63
 Property, plant, and equipment                      998            930       Capital reserves                                          118         118
 Investment property                                   17            17       Revenue reserves                                          721         711
 Financial assets                                       3             1       Other reserves                                             -50         -40
 Shares in associates                                  23            29       Equity attr. to shareh. of ElringKlinger AG               853         852
 Non-current income tax assets                          0             0       Non-controlling interest in equity                         37          37
 Other non-current assets                              15             4       Equity                                                    890         890
 Deferred tax assets                                   12            17       Provisions for pensions                                   124         126
 Non-current assets                                1,257          1,188       Non-current provisions                                     20          12
 Inventories                                         401            370       Non-current financial liabilities                         472         479
 Current contract assets                                6             0       Deferred tax liabilities                                   15          14
 Trade receivables                                   306            303       Other non-current liabilities                              12            4
 Current income tax assets                              9             7       Non-current liabilities                                   642         635
 Other current assets                                  51            48       Current provisions                                         11          23
 Cash and cash equivalents                             45            45       Trade payables                                            136         119
 Current assets                                      816            773       Current financial liabilities                             297         222
 Assets held for sale                                   6            62       Current contract liabilities                               10            0
 Total assets                                      2,080          2,022       Tax payable                                                12          15
                                                                              Other current liabilities                                  81          96
                                                                              Current liabilities                                       547         474
                                                                              Liabilities in connection with assets held for sale          0         24
                                                                              Total liabilities and equity                            2,080       2,022

All figures in EUR million unless otherwise describe, differences due to rounding

Corporate presentation | January 2020                                                                                                                 34
Group – FY 2018
Consolidated statement of cash flows

                                                    2018           2017                                                        2018   2017
 Earnings before taxes (EBT)                           81            110        Proceeds from disposals of PPE, intangible
 Depreciation/amortization (less write-                                         assets and investment property                   1       1
 ups) of non-current assets                           100            101        Proceeds from disposals of financial assets      3       3
 Net interest                                          15              13       Proceeds from the disposal of subsidiaries      57       0
 Change in provisions                                   -6              7       Payments for investments in intangible
 Gains/losses on disposal of non-current                                        assets                                          -15    -11
 assets                                                  0              1       Payments for investments in PPE and
 Share of result of associates                           5              0       investment property                            -164   -156

 Change in inventories, trade receivables                                       Payments for investments in financial assets     -3     -3
 and other assets not resulting from                                            Payments for the acquisition of associates       0     -29
 financing and investing activities                    -52          -115
                                                                                Payments made/received for the acquisition
 Change in trade payables and other                                             of subsidiaries and other entities               0       1
 liabilities not resulting from financing and
                                                                                Net cash from investing activities             -121   -193
 investing activities                                  20              27
                                                                                Dividends paid to shareholders and to
 Income taxes paid                                     -31            -51
                                                                                non-controlling interests                       -34    -34
 Interest paid                                         -12            -11
                                                                                Proceeds from addition of long-term loans       77     235
 Interest received                                       1              0
                                                                                Payments for the repayment of long-term
 Other non-cash expenses and income                    -30             11       loans                                           -73    -44
 Net cash from operating activities                    92             95        Changes in current loans                        60     -47
                                                                                Net cash from financing activities              30     109
                                                                                Changes in cash                                  1      12
                                                                                Effects of currency exchange rates on cash       -1     -3
                                                                                Cash at beginning of the period                 45      39
                                                                                Cash at end of period (as per financial
                                                                                statement)                                      45     45
All figures in EUR million unless otherwise describe, differences due to rounding

Corporate presentation | January 2020                                                                                                   35
Group – Last 5 years
Key figures

                                                                       2018         2017    2016    2015    2014
 Order intake                                                           1,735       1,732   1,694   1,615   1,419
 Order backlog                                                          1,020       1,001    933     796     688
 Sales                                                                  1,699       1,664   1,557   1,507   1,326
 EBITDA                                                                   197        238     231     223     233
 (Adjusted) EBIT pre PPA                                                  100        142     140     140     162
 (Adjusted) EBIT margin pre PPA                       in %                 5.9        8.5     9.0     9.3    12.2
 EBIT (reported)                                                           96        137     136     135     154
 EBT                                                                       81        110     124     129     153
 Net income attributable to shareholders                                   44         70      79      92     106
 Earnings per share                                 in EUR               0.69        1.10    1.24    1.45    1.67
 Dividend per share                                in EUR                0.00        0.50    0.50    0.55    0.55
 Capex (in PPE)                                                           164        156     171     176     147
 Operating free cash flow                                                 -86         -67      -4     -65     -12
 ROCE                                                in %                  5.5        8.2     8.7     9.5    12.4
 Net working capital                                                      567        553     525     523     466
 Equity ratio                                        in %                42.8        44.0    47.2    48.5    49.7
 Net financial debt                                                       724        655     539     487     348
 Employees (as at Dec. 31)                                            10,429        9,611   8,591   7,912   7,255

All figures in EUR million unless otherwise describe, differences due to rounding

Corporate presentation | January 2020                                                                          36
Group – Last 5 years
Segmental figures

                                                                        2018         2017      2016      2015      2014
 Group                         Sales                                    1,699       1,664.0   1,557.4   1,507.3   1,325.8
                               EBIT (reported)                             96        137.3     135.6     135.2     154.0
                               EBIT margin            in %                 5.7          8.3       8.7       9.0     11.6
 Original Equipment            Sales                                  1,407.7       1,382.4   1,294.3   1,255.8   1,089.7
                               EBIT (reported)                            50.7         86.3      88.9      91.2    111.2
                               EBIT margin            in %                 3.6          6.2       6.9       7.3      10.2
 Aftermarket                   Sales                                    159.5        156.7     147.3     142.2     130.7
                               EBIT (reported)                            24.9         31.8      30.5      28.2      25.1
                               EBIT margin            in %                15.6         20.3      20.7      19.8      19.2
 Engineered Plastics           Sales                                    117.8        111.1     101.7       96.6      92.9
                               EBIT (reported)                            19.5         18.5      14.9      13.2      15.4
                               EBIT margin            in %                16.6         16.7      14.7      13.7      16.6
 Services                      Sales                                       9.7          9.5       9.7       8.3       8.1
                               EBIT (reported)                             0.7          1.2       1.6       2.0       1.9
                               EBIT margin            in %                 7.2         12.6      16.5      24.1      23.5
 Industrial Parks              Sales                                       4.3          4.3       4.5       4.3       4.5
                               EBIT (reported)                             0.3         -0.5      -0.3       0.7       0.4
                               EBIT margin            in %                 7.0         n.a.      n.a.      16.3       8.9

All figures in EUR million unless otherwise describe, differences due to rounding

Corporate presentation | January 2020                                                                                  37
Group
Product portfolio

Cylinder-head Gaskets                   E-Mobility
                                         Battery module
Specialty Gaskets                        PEM fuel cell
                                         Electric drive unit (EDU)

Shielding Technology                    Lightweighting/
 Thermal shielding                     Elastomer Technology
 Acoustic shielding                     Door module carrier
                                         Cockpit cross-car beam
                                         Plastic modules
                                           (cam cover)

Corporate presentation | January 2020                           38
Group strategy
ElringKlinger provides a transformed portfolio

            Present                                                                                                   Future

                                                                                                                      Functional
                                                                                          Disk
                                                                        Brake            carrier                     Components
     Cylinder-head Gaskets                        Metal-                 hat
                                                elastomer

                                                                                                                                   Strategic areas
                                                 gaskets                                            Engine
         Specialty Gaskets                                    Tank              Dampening
                                                                                                   shielding
                                        Underbody           shielding              pan
      Shielding Technology              protection
                                                     Front-end                    Door           Side                  Light-
                                                                    Cross-car
    Lightweighting/Elastomer                          carrier                    module        impact                 weighting
                                                                      beam
                                                                                 carrier      protection
             E-Mobility                      Cell
                                            casing       Metallic
                                                         bipolar       Cell       PEM
                                                          plate      contact     Fuel cell              Electric
                                                                     system       stack                drive train
                                                                                             Battery
                                                                                             module                  E-Mobility

Corporate presentation | January 2020                                                                                                         39
Group strategy
Fuel cell systems will be essential for certain applications

                                              Why fuel cell technology?
                                              • H2 production by solar or wind power enables
                                                CO2-neutral propulsion
                                              • Better storability of hydrogen
                                              • Use of the existing filling station infrastructure
                                              • Fast refueling

                                              Why ElringKlinger?
                                              • Ready for series production
                                              • Electrical output of 2 to 150kW possible based on
                                                sophisticated metallic bipolar plates
                                              • Optional integration of peripheral components and
                                                system functionalities into the module

     • Suitable for long distances, recurring applications (e.g. buses) and commercial vehicles
     • High customer interest esp. in Asia perceived, numerous development projects in progress

Corporate presentation | January 2020                                                                40
Group strategy
Battery technology enables mobility based on renewable resources

                                               Why battery technology?
                                               • Reduced emissions
                                               • Lower operating and maintenance costs
                                               • Electric motor: quiet and efficient

                                               Why ElringKlinger?
                                               • Ready for series production of battery systems
                                               • Long service life due to robust design with cell
                                                 clamping concept and use of proven ElringKlinger
                                                 busbars
                                               • Cell contact system for prismatic lithium-ion cells in
                                                 series production since 2012

     • Battery-powered vehicles are an eco-friendly solution for short distances
     • First order for the production of complete battery systems received in 2018

Corporate presentation | January 2020                                                               41
Group strategy
Electric drive unit completes full electric product range

                                                 Why electric drive unit (EDU)?
                                                 • Hybrid, fuel cell and e-vehicles are reliant on highly
                                                   efficient electric drives
                                                 • EDU reduces the complexity and powertrain
                                                   becomes more compact and efficient

                                                 Why ElringKlinger?
                                                 • ElringKlinger and hofer powertrain offer
                                                   complementary core competencies
                                                 • High-end solution with focus on small-series
                                                   production in sports and luxury car segment
                                                 • Compact coaxial electrive drive unit
                                                 • Customer-specific planetary gearing in conjunction
                                                   with a differential

     • EDU is needed in every hybrid and battery driven vehicle.
     • High system efficiency ensures a higher electrical range or, alternatively, a reduction in the
       battery capacity required.

Corporate presentation | January 2020                                                                  42
Group
ElringKlinger represented in all important auto regions
Production locations of global top 15 OEMs ( )
ElringKlinger production sites ( )
                                                                    Germany

                                                                   UK
                                                                                                   China
                                                                                   Eastern
                                                          France                   Europe/
                                                          Spain                    Turkey                        Korea
                                                                        Italy                                            Japan

                                        USA/Canada

                                                                                       India                       Southeast Asia

                  Mexico
                                                                                      Capex (in PPE)/ratio – in EUR million/in %

                                                     South          South Africa                176        171
                                                     America                                                         156         164
                                                                                       147

                                                                                      11.1      11.7       11.0
                                                                                                                     9.3         9.6

                                                                                      2014      2015       2016     2017     2018

Corporate presentation | January 2020                                                                                                  43
FY 2018: Sales
Sales increase primarily driven by strong demand in NAFTA
Growth LV production vs. sales ElringKlinger (FX adjusted) – in %
Sales by region – in EUR million resp. %

                                                                           Europe
                                                                                 +1.2%
                     NAFTA                                                                   Asia
                                        27.8%
                                                                                                 +1.4%
          +15.5%                                                         -0.4%
                                                                      Market   EK
                                                                         FY 2018
                                1.1%                                                     -1.3%
 -1.0%                                                                                   Market   EK
                                                                                            FY 2018
 Market   EK                   Market   EK
    FY 2018                       Q4 2018
                                                                    5%

                                                      19%                         25%

                                                                11%
                                                                      5%    36%
                                                             15%

                                                                    2008                    Germany
                                                                    33%
                                                    21%                                     Rest of Europe
                                                                                            NAFTA
                                                                                 30%
                                                                    2018                    Asia-Pacific
                                                                                            South America and Rest of World

Corporate presentation | January 2020                                                                                  44
FY 2018: Sales
International diversified customer base

Sales by customer group – in % of total sales

                                                                       American
                                                                        OEMs
                                                              9%      18% (19%)
                                   Other
                                 30% (38%)                          6%
                                                                         3%

                                                       EUR                10%    German
                                                      1,699                       OEMs
                                                      million                   22% (16%)
                                                                          7%

                                                                     5%
                                        Aftermarket
                                         9% (9%)                    French
                                                                    OEMs
                                                        Tier 1     5% (4%)
                                                      16% (14%)

Corporate presentation | January 2020                                                       45
Group
Focused R&D activities
R&D – in EUR million
R&D ratio – in % of total sales

   5.0%       4.7%        4.8%          4.6%   5.1%

                                                87
                                                                    • Integration of tools implies a
                                         75                           technological lead position in the
                71
    67                                                                development of ideas
                            64
                                                                    • Main focus: lightweight components,
                                                                      e-mobility
                                                76
                                                                    • 590 R&D employees at sites of parent
                61                       71
    58
                            57
                                                                      company
                                                                    • 80 new international patents in 2018
                                                                    • Target R&D ratio (incl. capitalization):
                                                                      5 – 6% of total sales, capitalization rate
     9          10                              11    thereof         ~20%
                            7             4           capitalized
   2014       2015        2016          2017   2018

Corporate presentation | January 2020                                                                              46
Group
      Senior management

Theo Becker, CTO (since 2006)                                                                Reiner Drews, COO (since 2018)
Responsible for the business units E-Mobility, New                                           Responsible for the business units Cylinder-head Gaskets,
Business Areas, Tooling Technology divisions as                                              Specialty Gaskets, Lightweight/ Elastomer Technology and
well as the corporate units Purchasing, Real Estate                                          Shielding Technology, the corporate units Production
& Facility Management and the Thale plant | With                                             Management and Quality & Environmental Management as
ElringKlinger since 1994                                                                     well as ElringKlinger AG plants | With ElringKlinger since 2006

Dr. Stefan Wolf, CEO (since 2005)                                                       Thomas Jessulat, CFO (since 2016)
Responsible for Group companies, the corporate units Legal, HR, Strategic               Responsible for the corporate units
Communications, Marketing & Communications and OE Sales as well as the Aftermarket      Finance, Controlling, IT, Logistics and
division | With ElringKlinger since 1997 | Chairman of Baden-Württemberg‘s              Business Development as well as the
Employers‘ Association of the Metal and Electric Industry (Südwestmetall) | Member of   Industrial Parks division | With
the Management Board of the German Association of the Automotive Industry (VDA)         ElringKlinger since 2005

      Corporate presentation | January 2020                                                                                                      47
Group
140 years of experience and solid shareholder structure

History of ElringKlinger in very brief                                                   Shareholder structure as at November, 2019

          1879 Paul Lechler establishes a
          merchandising business in
          Stuttgart for technical products
          and gaskets.                            1885 Richard Klinger                   Institutional Private          Lechler
                                                  establishes an engineering office
                                                  in Vienna.                               investors investors          Family
          1924 The first Lechler cylinder-
          head gaskets are produced.
                                                  1964 Elring production and
                                                  development moves from                  23.6%       24.4%              52.0%
          1993 Elring goes to Asia: The           Stuttgart to Dettingen/Erms.
          joint venture Changchun Elring
          Gaskets Co. Ltd. has been               1994 Elring GmbH merges with
          founded.
                                                  Automotive Division of Richard
                                                  Klinger GmbH to ElringKlinger
          1997 ElringKlinger founds new           GmbH.
          plants in UK, Brazil, Mexico, and the
          U.S.                                    2000 ElringKlinger GmbH merges
                                                  with parent company ZWL
                                                  Grundbesitz- und Beteiligungs-AG and
          2001 ElringKlinger AG intensifies       is renamed as ElringKlinger AG.
          R&D work on fuel cell components,
          especially on its internal sealing.     2002 Registered shares of
                                                  ElringKlinger AG are traded at
          2010 ElringKlinger AG                   Frankfurt and at Stuttgart Stock
          receives its first order for series     Exchange.
          production of cell contact
          systems used in lithium-ion             2013 ElringKlinger AG acquires
          batteries.                              tool maker Hummel Formen GmbH
                                                  which enables the company to offer
          2017 ElringKlinger AG acquires a        structural lightweight components.
          stake in hofer powertrain and thus,
          extends its portfolio to alternative
          drive technologies.
                                                  2018 ElringKlinger sells interest
                                                  in Hug and in new enerday

Corporate presentation | January 2020                                                                                                 48
IR calendar and contact

                  Date         Event
        Jan 21, 2020           Conference Frankfurt
       Mar 30, 2020            Annual Report 2019
         May 7, 2020           Q1 2020
       May 19, 2020            Annual General Meeting

                                                        From left to right:
                                                        Heiderose Mall, Christoph Staib, Kathrin Graf, Sabrina Haufler, Dr. Jens Winter

ElringKlinger AG                                        Investor contacts
Strategic Communications                                Dr. Jens Winter                          Kathrin Graf
                                                        Head of Strategic Communications         Senior Manager Strategic Communications
Max-Eyth-Str. 2 |                                       E: jens.winter@elringklinger.com         E: kathrin.graf@elringklinger.com
72581 Dettingen/Erms | Germany                          T: +49 7123 724 88335                    T: +49 7123 724 88279
E: investor-relations@elringklinger.com

Corporate presentation | January 2020                                                                                              49
Disclaimer

Forward-looking statements and predictions
This presentation contains statements about the future. These statements are based on current
expectations, market evaluations and predictions by the Management Board, and on information
that is currently available to them. The statements about the future should not be interpreted as
guarantees of the future developments and results that they refer to. Whilst the Management
Board is convinced that the statements that have been made, and the convictions and
expectations on which they are based, are realistic, they rely on suppositions that may
conceivably prove to be incorrect; future results and developments are dependent on a multitude
of factors, they involve various risks and imponderabilities that can affect whether the ongoing
development deviates from the expectations that have been expressed. These factors include, for
example, changes to the general economic and business situation, variations of exchange rates
and interest rates, poor acceptance of new products and services, and changes to business
strategy.

Corporate presentation | January 2020                                                               50
You can also read