Corporate Presentation January 2019 - Koufu
←
→
Page content transcription
If your browser does not render page correctly, please read the page content below
Corporate Presentation
January 2019
Company Overview

                   2
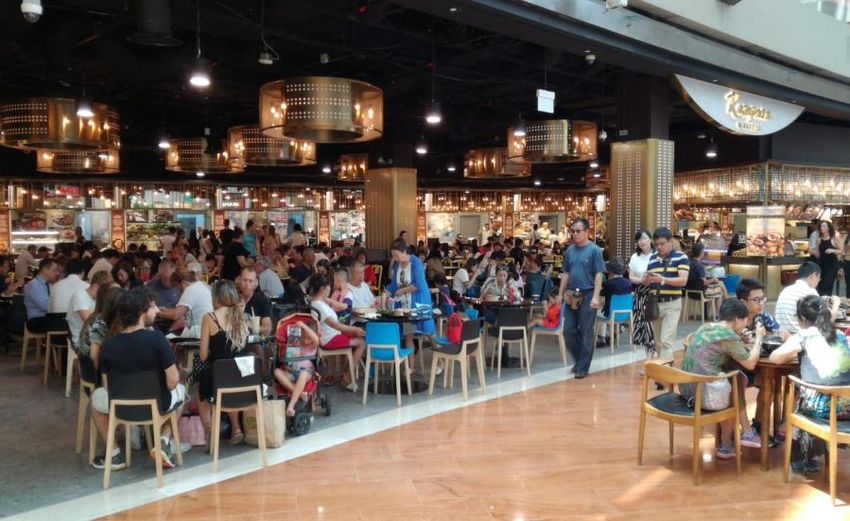
One of Singapore’s Most Established and Largest
Operators and Managers of Food Courts and Coffee Shops
16 years of F&B experience: With a history dating back
to 2002, Koufu has established a reputation for serving
quality food at affordable prices:
- Connecting with our customers through efficient and
friendly services
- Brand equity amongst the younger population
Our philosophy:
Modern
management
discipline
Value for money
Traditional dining in
coffee shop comfortable
culture environment
Our Group's mission is to provide quality food and
services to our customers, while staying true to our deep
roots in the Singaporean food culture
We have since expanded into Macau with the
establishment of a Koufu food court in Sands Cotai
Central in 2012
3
Better Food, Better People, Better Life.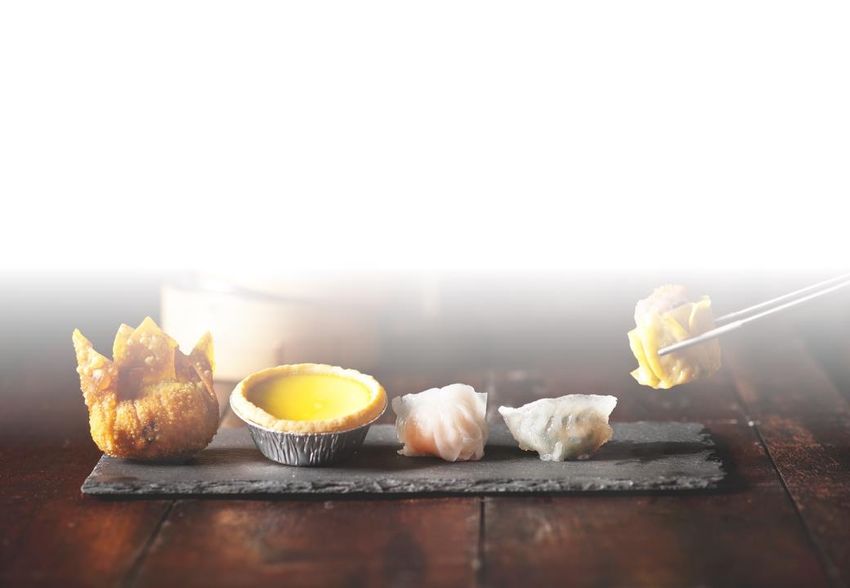
Our Key Milestones
                                                                                                Achieved S$200              Successfully tendered
                                                  Successfully tendered                         million in sales            for our first Koufu food
                                                  for the operation and                         revenue                     court in a hospital
                                                  management of the                                                         (Sengkang General
                                                  food court at Marina                                                      Hospital)

                         Successfully tendered    Bay Sands,
                         for the operation and    Singapore with our
                         management of a          Rasapura Masters
                                                                                                                     2017
                         commercial mall,         brand concept                                                                    2018      Successfully listed
                         Punggol Plaza                                                                                                       on the Main Board
                                                                                      2015                                                   of the SGX-ST on
                                                                      2012
                                                                                                         2016                                18 July 2018

       Established our first
                                           2009        2010                         Established our
       central kitchen at 18
       Woodlands Terrace                                                            first full-service             Successfully tendered for
                                                                                    restaurants at                 the operation and
                                                                 Established our    Millenia Walk                  management of Jurong
                                                                 first overseas     and Thomson                    West Hawker Centre and
                               2004                              Koufu food court   Plaza under                    Market, as a social
                                                                 at Sands Cotai     our Elemen                     enterprise project.
2002        2003                                                 Central, Macau     brand concept

                                        Achieved S$100
                                        million in sales
       Commenced operations with
                                        revenue
       two food courts and one
       coffee shop, including our
       first Koufu air-conditioned
       food court at HDB Hub

                                                                                                                                                                   4
                                                                                                                         Better Food, Better People, Better Life.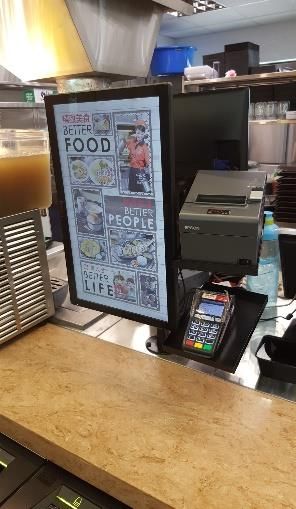
Complementary Business Segments with
Diversified Revenue Streams

As at 31 December 2018

       Outlet & Mall Management                                        F&B Retail

      47              1      15                           71           2                   8
       Food Courts         Coffee Shops                   F&B Stalls                Quick-Service
                                                                                  Restaurants (“QSR”)

          1                    1                          9            1                   3
      Hawker Centre       Commercial Mall                 F&B Kiosks            Full-Service Restaurants

                                            Food Courts

    Coffee Shops                 F&B Kiosks, QSRs and Full Service Restaurants

                                                                                                                  5
                                                                            Better Food, Better People, Better Life.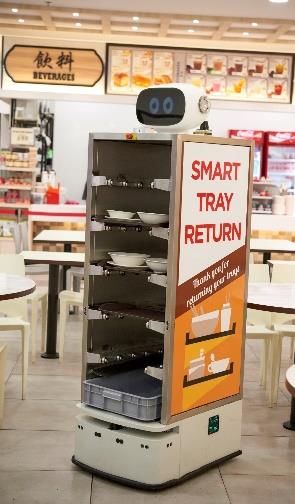
Multi-Brand Strategy

     Price Range                           Brands                                F&B Outlets

     S$20 – S$50                                                      Full-service restaurants

      S$5 – S$15                                                      Food courts and QSRs

                                                                      Food courts, F&B kiosks and
      S$4 – S$12
                                                                      QSRs

      S$3 – S$8                                                       Food courts and F&B kiosks

      S$2 – S$5                                                       Coffee shops and Hawker centre

By focusing on different market segments with different price ranges, we are able to grow our customer
      base, expand our market share and capture business opportunities in each market segment

                                                                                                                      6
                                                                                Better Food, Better People, Better Life.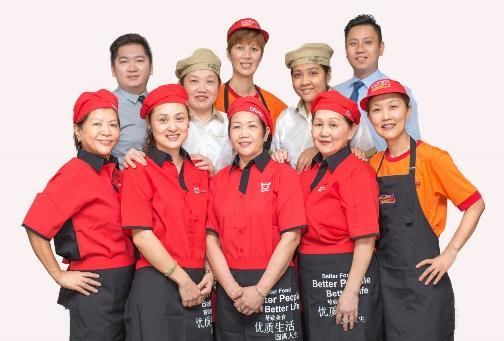
Holistic Approach to Improving Productivity
Using Technology as a Key Enabler

In line with the Singapore government’s emphasis on improving productivity through innovation as well as
consumer experience, we have implemented:

               More than 40                     Self-ordering                                       RFID tray
               smart tray return                and payment                                         return system,
               robots deployed                  kiosks at Koufu                                     integrated with
               to more than 16 of               food court at                                       the centralised
               our food courts                  Fusionopolis and                                    dishwashing
               and coffee shops                 Happy Hawkers                                       area and self-
                                                coffee shop at                                      payment kiosks
                                                Block 872C                                          at our Jurong
                                                Tampines Street                                     West Hawker
                                                86                                                  Centre

               Mobile ordering                  NETS unified
               applications at                  payment
               selected Koufu,                  terminals
               Cookhouse,                       implemented
               Happy Hawkers                    across 18 food
               and F&B Outlets.                 courts and plan
               Intend to                        to roll out to all
               implement at                     food courts by
               most of our F&B                  Q1 2019                 Singapore Productivity Awards –
               outlets in the                                              Excellence in F&B Sector
               future                                                                2016

                                                                                                                        7
                                                                                  Better Food, Better People, Better Life.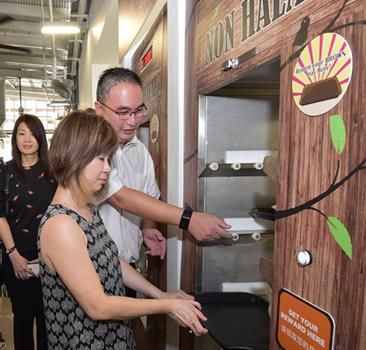
Shareholding Structure

                                        Mdm
             Mr Pang Lim
                                    Ng Hoon Tien

              50%                            50%
                                                                       Public
                                                                     Investors
                                                                    (including
                                                                   Cornerstone
                    Jun Yuan Holdings Pte.                          Investors)
                            Ltd.

                            78.3%                                     21.7%

                                             Koufu Group Limited

                                                                                                                       8
                                                                                 Better Food, Better People, Better Life.
3Q/9M 2018
Financial Highlights

                       9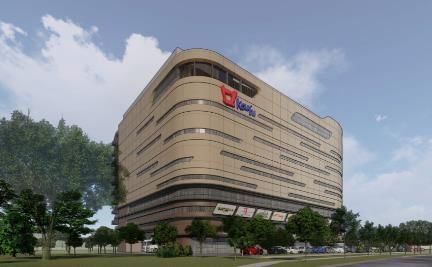
Revenue
Revenue
Revenue growth was boosted by a 4.7%
(S$’m)
increase in revenue for the outlet & mall
management segment and a 0.7%
215.1 216.7 growth in F&B retail segment revenue
198.7
162.5 166.8
FY2015 FY2016 FY2017 9M 2017 9M 2018
10
Better Food, Better People, Better Life.Revenue Breakdown
By Business Segments Outlet & Mall Management:
(S$’m) Revenue growth lifted by three new
food courts opened in 9M 2018 –
Fusionopolis, Oasis Terrace and
Sengkang General Hospital
Outlet & Mall Management F&B Retail Offset partially by closure of three
food courts and coffee shop and
temporary closure of MBS food court
51.4% for progressive refurbishment works
52.2% 52.5%
that took four months to complete
112.9 111.3 50.4%
103.6 51.4% F&B Retail:
83.5 84.1 Revenue growth lifted by three new
F&B stalls opened in 9M 2018 –
Fusionopolis, Oasis Terrace and
Sengkang General Hospital
47.8% 47.5% 48.6%
Offset partially by closure of two
95.0 102.2 105.4 QSRs and seven F&B stalls in 3Q
79.0 82.7
2018, and temporary closure of MBS
48.6%
49.6% food court for progressive
refurbishment works that took four
FY2015 FY2016 FY2017 9M 2017 9M 2018 months to complete
11
Better Food, Better People, Better Life.Revenue Breakdown
By Geography
(S$’m) Revenue contribution from
Macau increased by $1.1m
215.1 216.7 while revenue contribution
198.7 15.1 7.0% 16.6 7.7% from Singapore increased
13.4 6.7% by $3.2m in 9M 2018
162.5 166.8 Revenue contribution from
93.3% 93.0% 92.3% Macau correspondingly
13.0 14.1
8% 8.5% increased 0.5% in 9M 2018
200.0 200.1
185.3
149.5 152.7
92% 91.5%
FY2015 FY2016 FY2017 9M 2017 9M 2018
Singapore Macau
12
Better Food, Better People, Better Life.EBIDA and EBITDA margin
EBITDA and EBITDA margin Excluding one-off IPO
(S$’m) expenses and finance
EBITDA EBITDA margin % Adjusted1 income from convertible loan
notes amounting to a total of
S$1.6 million, the adjusted
18.7% 18.5% 18.3% 18.5% EBITDA increased
50 18.9%
17.0% 18.0% marginally by 3.7% to S$30.9
45
40.2 40.1 17.7% 16.0% million
40
33.9 14.0%
35
30.7 29.8 29.6 30.9
12.0%
30
25 10.0%
20 8.0%
15 6.0%
10 4.0%
5 2.0%
0 0.0%
FY2015 FY2016 FY2017 9M 2017 9M 2017 9M 2018 9M 2018
(Adj) (Adj)
1 Adjusted EBITDA is derived from the Group's Profit before income tax, after adding back depreciation and amortisation expenses, finance costs and
finance income from convertible loan notes and one-off IPO expenses
13
Better Food, Better People, Better Life.Net Profit After Tax
Net Profit After Tax (attributable to owners of the Company)
Excluding one-off IPO
(S$’m)
expenses and finance income
NPAT NPAT margin % Adjusted1 from convertible notes
40.0 13.0%
amounting to a total of S$1.6
12.0% 12.1% million, the Group’s adjusted
12.4%
11.0% NPAT declined 2.1% to
35.0 11.0%
11.5% S$18.3 million
10.4%
30.0 10.2% Mainly due to higher rental
26.8 9.0%
25.9 costs incurred during the fit-
25.0 out period for the three new
20.6 7.0% food courts opened in 2018,
19.6
20.0 18.7 18.3 compared to costs incurred
17.0
5.0% for only one food court and
15.0 one coffee shop recorded in
2017
3.0%
10.0
5.0 1.0%
0.0 -1.0%
FY2015 FY2016 FY2017 9M 2017 9M2017 9M 2018 9M 2018
(Adj) (Adj)
1 Adjusted NPAT is derived from the Group's Profit after income tax, after excluding the one-off IPO expenses of S$1.3 million (Q3 2018 and 9M 2018) and
finance income from convertible loan notes of S$0.3 million (Q3 2017) and S$0.9 million (9M 2017), reflecting the true operating performance of the Group
14
Better Food, Better People, Better Life.Healthy Cashflows and Balance Sheet
Business is resilient through economic cycles
Cash-generative
Strong operating cash flow
Healthy balance sheet
S$55.8m
Cash and cash equivalent
as at 30 September 2018
Net Cash Generated from Operating Activities
(S$’000)
51.0
S$51.1m
Net Cash as at
30 September 2018
34.1 33.5
29.8
25.0
S$0.01
Interim Dividend in line with Prospectus’
recommendation of paying out at least 50%
of NPAT generated in FY2018 and FY2019
FY2015 FY2016 FY2017 9M 2017 9M 2018
15
Better Food, Better People, Better Life.Our Expenses Breakdown
Breakdown of expenses
(S$’000 or %)
179,499 190,197 190,028 143,546 150,659
1.2% 1.1% 3.0% 3.0% 1.1%
2.7% 2.5% 2.7% 3.1%
2.5%
0.9% 1.0% 1.0% 1.2%
1.2%
50.7% 50.7% 50.4% 49.9% 52.2%
5.8% 5.4% 4.7% 4.7% 6.0%
19.9% 20.4% 19.6% 20.1% 18.8%
18.9% 18.9% 18.6% 18.6% 17.6%
FY2015 FY2016 FY2017 9M 2017 9M 2018
Cost of inventories consumed Staff costs Depreciation
Property rentals and related expenses Distribution and selling expenses Adminstrative expenses
Other operating expenses
Better Food, Better People, Better Life.At a Glance – P&L
(S$’m) Change Change
3Q 2018 3Q 2017 9M 2018 9M 2017
(%) (%)
Revenue 57.6 55.6 3.6 166.8 162.5 2.6
EBITDA 8.8 10.8 (18.5) 29.6 30.7 (3.6)
Adjusted EBITDA1 10.1 10.5 (3.8) 30.9 29.8 3.7
Profit Before Tax 5.6 8.5 (33.6) 20.3 23.5 (13.6)
Net Profit After Tax
Attributable to Owners of the 4.6 7.1 (34.5) 17.0 19.6 (13.4)
Company
Adjusted NPAT 2
Attributable to Owners of the 5.9 6.8 (13.2) 18.3 18.7 (2.1)
Company
Basic and Fully Diluted
EPS (SGD Cents) 0.86 1.47 (41.5) 3.38 4.06 (16.7)
1 Adjusted EBITDA is derived from the Group's Profit before income tax, after adding back depreciation and amortisation expenses, finance costs and finance income from convertible loan notes
and one-off IPO expenses
2 Adjusted NPAT is derived from the Group's Profit after income tax, after excluding the one-off IPO expenses of S$1.3 million (Q3 2018 and 9M 2018) and finance income from convertible loan
notes of S$0.3 million (Q3 2017) and S$0.9 million (9M 2017), reflecting the true operating performance of the Group
17
Better Food, Better People, Better Life.At a Glance – Balance Sheet
(S$’m) 30 September 2018 31 December 2017 Change (%)
Current Assets 103.7 65.0 59.5
Current Liabilities 51.9 53.5 (3.0)
Net Current Assets 51.8 11.5 350.4
NAV/Share 16.15 8.90 81.5
(SGD Cents)
Cash and Cash Equivalents 55.8 53.0 5.3
Time Deposits 35.0 - NA
Total Borrowings 4.8 1.8 166.7
Net Cash 51.0 51.2 (0.4)
18
Better Food, Better People, Better Life.At a Glance – No. of F&B Outlets
Outlet & Mall FY2015 FY2016 FY2017 9M 2018 31 Dec 2018
Management Segment
Food courts 47 49 47 48 47
Coffee shops 12 15 15 14 15
Hawker centre - - 1 1 1
Commercial mall 1 1 1 1 1
F&B Retail Segment FY2015 FY2016 FY2017 9M 2018 31 Dec 2018
Self-operated F&B stalls 75 83 79 75 73
F&B kiosks 2 2 4 7 10
QSRs 5 7 9 9 8
Full-service restaurants 2 2 3 3 3
19
Better Food, Better People, Better Life.At a Glance – New Openings in 2018
Month Brand Location F&B Outlets
Singapore
January Koufu Fusionopolis Food court
January Grove Fusionopolis F&B QSR
April Supertea Millenia Walk F&B QSR
June Gourmet Punggol, Oasis Terrace Food court
Paradise
June R&B Tea Punggol, Oasis Terrace F&B kiosk
July Koufu Sengkang General & Community Hospital Food court
August R&B Tea Rasapura Masters at Marina Bay Sands F&B kiosk
October R&B Tea Singapore Post F&B kiosk
November Happy Hawkers Tampines T-Space Coffeeshop
November R&B Tea United Square F&B Kiosk
November R&B Tea Kinex F&B Kiosk
Macau
May Supertea Cotai Sands, Macau F&B kiosk
20
Better Food, Better People, Better Life.At a Glance – Pipeline Openings
OutletOutlet
& Mall& Management
Mall Management Food Retail Food Retail
Koufu food courts to open at The Woodgrove Secured 5 new locations in Singapore, including
and Buangkok Green in 1Q 2019, 164 Kallang 100 AM, Tampines MRT, Parkway Parade, Yew
Way in 2Q 2019 and Le Quest at Bukit Batok in Tee Point to open in January 2019 and Buangkok
4Q 2019 Green to open in February 2019
Koufu foodcourt to open at Macau University Bringing the total outlets to 13
1Q 2019
Bringing the total number of foodcourts to 52
Expected to open a full service restaurant at Paya
Lebar Quarter in 1Q 2019 (TOP of mall delayed)
Bringing the total number of restaurants to 4
21
Better Food, Better People, Better Life.Business Strategies and Future Plans
22Our Business Strategies and Future Plans
Expand Our Presence with New Establish an Integrated Facility to Drive and
F&B Outlets in Singapore and Overseas Support Our Growth, Including a Larger
Central Kitchen and a Centralised
Dishwashing Facility
Expand our central procurement, preparation, processing
and distribution functions
Expand in Singapore with a focus on hospitals, commercial malls, Better support all our F&B Outlets and self-operated F&B
tertiary educational institutions and new housing estates. Secured stalls and cater for future business expansion
4 new locations for foodcourts.
Improve productivity and operational efficiency
Expand overseas with an initial focus in Macau, 1 foodcourt
secured and opening in 1Q 2019 at Macau University. In the midst
S$40.0 Million
of finalizing 1 more foodcourt in Macau. GFA of
Estimated total construction
Fourth Elemen outlet opening in first quarter of 2019 at Paya 20,000 sqm including renovation cost,
More than 5 times larger than capital expenditure for
Lebar Quarters as TOP for the mall has been delayed. Bring
our current central kitchens equipment and machinery
Elemen to the PRC, Malaysia, Indonesia and Australia and corporate headquarters (S$3.9m land premium paid)
Commenced construction in 4Q 2018
Expected completion in 1H 2020
23
Better Food, Better People, Better Life.Proposed Integrated Facility
Reduce the food preparation and processes previously done on-site
Enjoy greater economics of scale, improve production techniques, ensure
Larger better consistency
Central Increase production, including through our potential joint venture
Kitchen businesses
Expand central procurement function; bulk purchase of ingredients and
improve purchasing and negotiation power with suppliers
At least
70% of the
Centralised
Automated facility to service our F&B Outlets located in the northern and GFA for
Dishwashing
western areas of Singapore our own
Facility
business
and
operations
Training Provide training for employees and JV
Centre Establish and align quality standards businesses
Develop new F&B products and recipes. Research on food preparation
Artist impression of Research & process for increased productivity and cost efficiency
proposed integrated facility Development
located at Woodlands Avenue 12 Conduct market research and trend analysis
Centre
Ensure greater consistency in our food quality with higher nutritional value
May sublet unutilised space to third-party stall operators for their production needs and
provide infrastructure support to improve their operational efficiency. Enable such stall
operators to expand their operations and increase the number of their F&B stalls in our
network
24
Better Food, Better People, Better Life.Our Business Strategies and Future Plans
Leverage on Our Network to Establish Joint
Ventures, Strategic Alliances, Acquisitions
or Investments in Complementary Business
Segments and Markets Leverage on Our Proposed Integrated Facility as a
Value Proposition to Potential Partners
• Expansion of Our Bakery, Confectionary, Tim Sum
and Hot Kitchen Food Production Business
Gain access to new markets, strengthen our market – Relocate to our proposed integrated facility
position and/or develop our supply chain through potential subsequently
vertical integration with key suppliers, manufacturers – Leverage on specialist expertise and potentially expand
and/or other service providers our supply of food products to third parties and gain
For F&B retail business: access to new markets both locally and overseas
– Our Group may contribute management expertise,
infrastructure support and priority for F&B stalls in our Centralised Dishwashing Facility
food courts and coffee shops
– Partner with a dishwashing service provider
– Potential partners provide manpower, recipes and
– Transfer business expertise and existing business
innovative cooking techniques
contracts to the joint venture
Mutually beneficial arrangement to grow our pool of
– Deployment of more sophisticated dishwashing
potential stall operators, optimise mix and increase F&B
equipment potentially resulting in improved margins
menu offerings, with additional sources of revenue for our
Group
25
Better Food, Better People, Better Life.Our Business Strategies and Future Plans
Improve Our Productivity by Continuing to Expand the Provision of Online Food Ordering
Innovate and Automate and Delivery Services
Improve design and features of the smart tray return Growing demand for online food ordering and
robots and increase deployment delivery services due to the changing lifestyles and
convenience
Automate the traditional coffee brewing process to
ensure consistency in taste and quality and potentially A channel for F&B Outlets and stall operators to
deploy overseas reach out to a wider customer base and generate
additional sales revenue
Progressively roll out the mobile ordering application
to further improve service delivery and operational Collaborated with third party online food ordering and
efficiency delivery service providers to make available a
selection of F&B products from certain F&B Outlets
To roll out this service to most of our F&B Outlets by
2019
26
Better Food, Better People, Better Life.Investment Merits
Market Leadership: One of Singapore’s most established and largest
1
operators and managers of food courts and coffee shops with presence in
Macau
2 Complementary Business Segments with Diversified Revenue Stream:
outlet & mall management business and F&B retail business segments
3 Resilient Business and Steady Income Stream
4 Quality Stall Operators and Active Manager-Operator Partnership
Comprehensive Supply Chain Facilitates Costs Management and
5 Operational Efficiency
Holistic Approach to Improving Productivity by Using Technology as a
6
Key Enabler
7 Experienced Management Team with Proven Track Record
Dividend Recommendation: At least 50% of NPAT generated for the
8
financial years ended 31 December 2018 and 20191
1 Afterdeducting profit attributable to non-controlling interests and excluding interim dividend of S$12.5 million declared and paid by Koufu Pte Ltd in FY2018. This is
a statement of the Board’s present intention and shall not constitute legally binding obligations on Koufu and investors should not treat this as an indication of
Koufu’s future dividend policy
27
Better Food, Better People, Better Life.THANK YOU
For enquiries, please contact:
Citigate Dewe Rogerson Singapore Pte Ltd
Ms Dolores Phua / Ms Samantha Koh
Email:
dolores.phua@citigatedewerogerson.com
samantha.koh@citigatedewerogerson.com
28
Better Food, Better People, Better Life.You can also read