CORPORATE PRESENTATION MAY 2022 - TSX: BNE - Bonterra Energy Corp.
←
→
Page content transcription
If your browser does not render page correctly, please read the page content below
CORPORATE PRESENTATION
                         TSX: BNE
MAY 2022

                                    1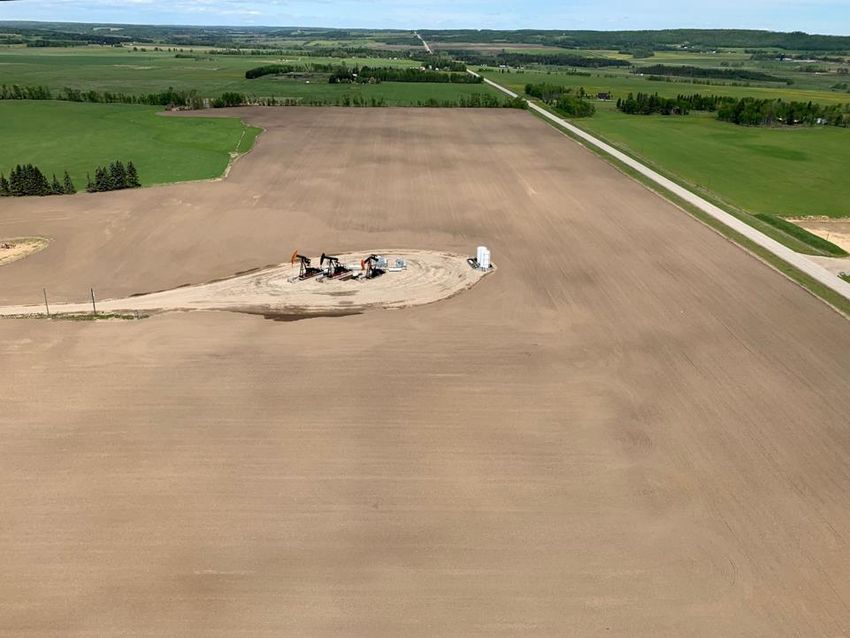
Corporate Snapshot
      Financial                                                         TSX: BNE
      Common Shares Outstanding                                MM            35
      Insider Ownership                                         %            15
      Tax Pools at December 31, 2021                          $MM           374
      Tax Horizon                                             Year         2022
      Q1 2021 Net Debt                                        $MM           261
      Bank Line                                               $MM           200
                                                                                                                           PEMBINA
             Available                                        $MM            62                                               &
             Drawn                                            $MM           138                                        WILLESDEN GREEN
      Operational                                                                                                                           Edmonton

      Q1 2022 Average Production                             boe/d       13,2871
      Oil and Liquids Production Weighting                      %            63
      Natural Gas Production Weighting                          %            37
                                                                                                                                        Calgary
      Reserve Life Index (PDP)                                Years           7
      Reserve Life Index (1P)                                 Years          17
      Reserve Life Index (2P)                                 Years          20
(1) Q1 2022 volumes comprised of 7,356 bbl/d light and medium crude oil, 996 bbl/d NGLs and 29,609 mcf/d of conventional natural gas.                  2
Focused on Free Funds Flow Generation
Bonterra remains focused on generating sustainable free funds flow which can be directed to debt
reduction, capital spending and returns to shareholders when supported by commodity prices

                                                  The successful execution of the 2021 & Q1 2022 drill
                           FREE FUNDS FLOW        programs and positive impact of growing production
                             GENERATION           volumes has set the foundation for significant free
                                                  funds flow generation through 2022.

                                        DEBT              Excess Free Funds Flow will be directed to
                                     REPAYMENT            reduce debt and improve corporate leverage
                                                          metrics.

                                                                   As leverage metrics improve, focus on
                                           DISCRETIONARY
                                                                   generating long-term, sustainable
                                               CAPITAL             value and return of capital to
                                            ALLOCATION             shareholders.

                                                                                                         3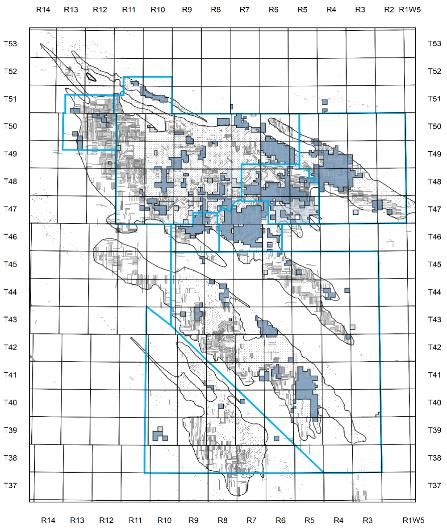
Production and Activity Forecast
         Forecasted 5% production growth year over year will generate significant free funds flow

                                          BASE PRODUCTION            2020 CAPEX      2021 CAPEX           2022 CAPEX
        16,000

        14,000

        12,000

        10,000
BOE/D

         8,000

         6,000

         4,000

         2,000

            0
                 Jan-21                 May-21              Sep-21                Jan-22                  May-22                 Sep-22        Dec-22

                                                 2021-2022 DRILL & ABANDONMENT PROGRAMS
                                    Net Wells On Production                                      Net Abandoned Wells
                          20                                                      100

                          15                                                       75
                                                                                           84
                          10   14                                                  50
                                                       11     11                                53   59
                                                                                                                       51
                          5               8                                        25
                                    6            6                    4   6                                24               25    31      23
                          0                                                         0

                                                                                                                                                        4
Free Funds Flow Price Sensitivity
       Bonterra is forecasted to generate $165 Million Free Funds Flow in 2022 under current
       strip pricing

                                                       ANNUAL FREE FUNDS FLOW ($MM)
                                 180

                                 160
                                       165
                                 140
        Free Funds Flow (MM$C)

                                 120

                                 100
                                                                                                                                   121
                                                                                                  102
                                  80
                                                                   82
                                  60

                                  40

                                  20

                                  -
                                       STRIP

                                                                   $60 WTI

                                                                                                    $70 WTI

                                                                                                                                    $80 WTI
                                                                                  2022

(1) Price Assumptions: MAY 04, 2022 Strip refer to appendix.
(2) Flat (US $60, $70, $80) WTI Price scenarios from MAY 2022 ONWARD: Edm Par Differential US -4.00/bbl; USD/CAD exchange rate: 1.27; AECO C gas $3.50/mcf   5
Forecast – Debt Structure & Price Sensitivity
       $165 Million of debt repayment forecasted in 2022 under current strip pricing with
       Debt to Funds Flow ratio improving to 0.5 : 1

                                                Bank Debt              BDC Debt          Subordinated Debt
                      240

                      200
                                                                  59
                      160
                                                                                                   59
        DEBT (MM$C)

                                                                                                                                   59
                      120                                         47
                                 59                                                                47
                       80                                         96                                                               47
                       40                                                                          66
                                 47                                                                                                47
                        0
                                  3
                                  STRIP

                                                                   $60 WTI

                                                                                                    $70 WTI

                                                                                                                                    $80 WTI
                                                                                  2022

(1) Price Assumptions: MAY 04, 2022 Strip refer to appendix.
(2) Flat (US $60, $70, $80) WTI Price scenarios from MAY ONWARD: Edm Par Differential US -4.00/bbl; USD/CAD exchange rate: 1.27; AECO C gas $3.50/mcf   6
Bank Liquidity Forecast and Sensitivity
Bank Facility percentage draw forecasted to be reduced to less than 5% by Year End
2022 under current strip prices
DRAWN LIQUIDITY
240
200
197 104 134 153
160
FACILITY (MM$C)
120
80 96
40 66
47
0
STRIP
$60 WTI
$70 WTI
$80 WTI
2022
(1) Price Assumptions: MAY 04, 2022 Strip refer to appendix.
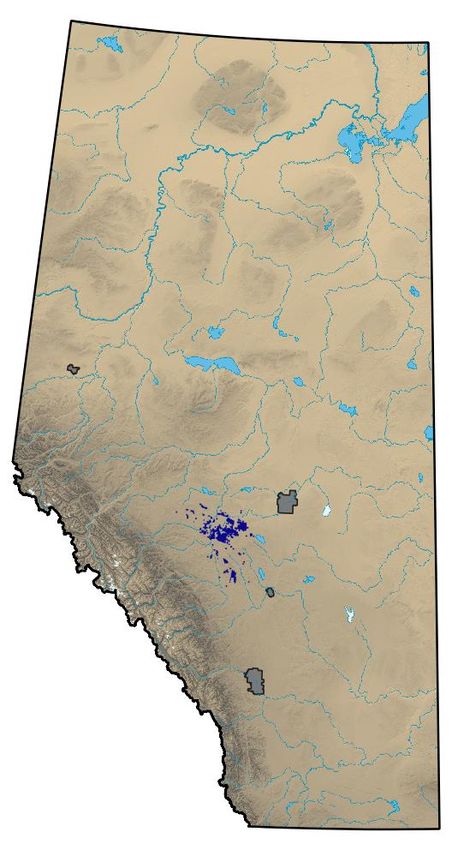
(2) Flat (US $60, $70, $80) WTI Price scenarios from MAY ONWARD: Edm Par Differential US -4.00/bbl; USD/CAD exchange rate: 1.27; AECO C gas $3.50/mcf 7Cardium Assets
8Pembina Cardium Features
Original-Oil-in-Place per Section Recovery Factor
0 to 5,000 Mbbl 0%
5,000 to 10,000 Mbbl 5%
10,000 to 20,000 Mbbl 10%
20,000 to 25,000 Mbbl 15%
25,000+ Mbbl 20%
25%
• Pembina is the largest conventional oilfield in Canada with large oil-in-place and low recovery
to date, offering long-term stable production, high-quality oil and attractive netbacks
• Majority of Bonterra land covers areas with significant remaining original-oil-in-place
• Opportunity to increase recovery factors can contribute to sizable increases in reserves and
production
9Deep Drilling Inventory
Concentrated assets in the Pembina Cardium oil pool support efficient operations and offer exposure
to significant upside through a large inventory of low-risk, highly economic undrilled locations
Pembina & Willesden Green
Lands by the Numbers
Cynthia
West
Pembina
Keystone
92%
Operated Production
Carnwood
Blue Rose
Rapids Creek
473 gross
Sections of land (312 net)
284 net
Booked locations
Willesden Green 97.4 MBOE
P+P Reserves
20 years
Reserve Life Index (P+P)
Ferrier
10Pembina Cardium Geology
Shale
Conglomerate
Sandstone
Bioturbated
Mudstone
Sandstone
Shale
• Interbedded sandstone and shale with local conglomerate and prevalent underlying low
permeability bioturbated mudstone
• Depths range from 1,200m True Vertical Depth (TVD) in NE Pembina to 2,000m TVD in SW
Pembina
11Average BNE Cardium Economics
Cardium wells are repeatable, predictable and generate strong returns
200 Reserves per well (MBOE) 140
150 IP (12 months) (boe/d) 110
BOE/D
100
50
0
1 2 3 4 5 6 7 8 9 10 11 12 13 14 15 16 17 18 19 20 21 22 23 24
BNE Type Curve: Full Cycle Capital and Price Sensitivities
WTI $USD/bbl $60.00 $70.00 $80.00 $90.00
DCET(3) M$C $1,900 $2,100 $2,100 $2,300
BT Payout Years 1.1 1.0 0.7 0.6
Rate of Return % 98% 124% 200% 221%
BT NPV10 M$C $1,564 $1,992 $2,531 $2,832
Recycle Ratio 2.4x 2.6x 3.0x 3.1x
(1) Realized Oil Price calculated as follows: (WTI Oil Price – Differential) x FX rate – (Quality Adjustment)
(2) Flat (US $60, $70, $80) WTI Price scenarios: Edm Par Differential US -4.00/bbl; USD/CAD exchange rate: 1.27; AECO C gas $3.50/mcf
(3) Drill, Complete, Equip, Tie-In & Facilities 12Our Responsibility – Environmental, Social and Governance
ENVIRONMENTAL RESPONSIBILITY
• Apply minimal disturbance drilling techniques to reduce the overall impact to the environment
• Employ a vigorous asset integrity program to ensure the safe operation of our assets.
• Inaugural annual ESG report published in 2021
SOCIAL RESPONSIBILITY
• Consult with internal and external stakeholders who are impacted by our operations and remain committed to working
with involved parties to resolve any concerns or questions that may arise
• Winner of 2020 Pro-Local Award as a Company that has proven for years that it cares and supports Drayton Valley with
support of local oil field services
PRIORITIZING CORPORATE GOVERNANCE
• Refreshed Board including new members, Ms. Ricci, Mr. Campbell, Ms. McDonald and Mr. Stewart with complementary
backgrounds
• Separate Board sub-committee to oversee Sustainability Reporting (ESG)
• All Board committees (Audit; Corporate Governance and Nomination; HR and Compensation; Reserves) are 100%
independent
• Our governance policies include written documents such as a Code of Conduct, Disclosure and Trading Policy, and a
Whistleblower Policy
13Strategy: Positioned for Success
Our proven track record has been built on a model of generating long-term, sustainable value
through disciplined capital allocation aligned with prevailing commodity prices
Insiders own ~15%
Experienced
& Aligned
Management
Free Funds Predictable and long-life asset base
Flow generates significant Free Funds Flow
Generation
Shareholder
Value
Creation
Reducing Corporate strategy of allocating all
Debt Free Funds Flow to debt repayment
Low-Risk
Drilling
Inventory 284 Net locations booked; 20 Year
Reserve Life Index
14Appendix
15Risk Management / Hedge Strategy
WEIGHTED AVERAGE OIL HEDGE HEDGE STRATEGY
COLLAR Q2 2022 Q3 2022 Q4 2022 Q1 2023 Q2 2023 Target to hedge 30% of pre-royalty volumes
VOLUME bbl/d 2,800 2,100 2,200 2,500 1,500 Fulfill bank hedge covenant
CEILING USD/bbl $77.58 $77.77 $80.03 $92.69 $100.67 Protect Bonterra cash costs
FLOOR USD/bbl $52.82 $48.00 $54.09 $65.00 $70.00
Protect Free Funds Flow
WEIGHTED AVERAGE SW DIFFERENTIAL HEDGE
Q2 2022 Q3 2022 Q4 2022 Q1 2023 Q2 2023
VOLUME bbl/d 1,300 1,100 1,500
PRICE USD/bbl -$4.17 -$4.65 -$4.37
VOLUME bbl/d 1,000 1,000 1,000
PRICE CAD/bbl -$6.55 -$5.90 -$6.05
WEIGHTED AVERAGE GAS HEDGE
COLLAR Q2 2022 Q3 2022 Q4 2022 Q1 2023 Q2 2023
VOLUME GJ/d 7,500 7,500 4,833 9,000
CEILING CAD/GJ $3.12 $3.48 $3.72 $4.75
FLOOR CAD/GJ $2.50 $2.83 $3.09 $4.22
FIXED Q2 2022 Q3 2022 Q4 2022 Q1 2023 Q2 2023
VOLUME GJ/d 4,500 5,000 5,833 5,000
PRICE CAD/GJ $3.34 $3.64 $3.43 $ 4.28
16Reserves Summary – December 31, 2021
NPV BT 10% (1)
Reserve Category Oil (Mbbl) BOE (Mboe)
(millions)
Proved Developed Producing 18,522 32,495 542,915
Proved Developed Non-Producing 2,335 3,562 55,012
Proved Undeveloped 22,613 42,174 388,505
Total Proved 43,470 78,231 986,432
Proved + Probable Developed Producing 22,781 39,931 622,148
Proved + Probable Developed Non- Producing 3,106 4,678 68,965
Proved + Probable Undeveloped 28,344 52,823 574,737
Total Proved + Probable 54,231 97,431 1,265,851
(1) The forecasted product prices are an average of independent reserve evaluators, Sproule, GLJ Petroleum Consultants and McDaniels & Associated Consultants
Ltd. Refer to Page 12 of Bonterra’s Annual Information Form for the year ended December 31, 2021. 17Appendix – Strip as at 05/04/2022
2022
Jan-22 Feb-22 Mar-22 Apr-22 May-22 Jun-22 Jul-22 Aug-22 Sep-22 Oct-22 Nov-22 Dec-22 AVERAGE
WTI USD/bbl $82.98 $91.63 $108.26 $101.64 $107.82 $107.82 $106.25 $104.39 $102.37 $100.56 $98.74 $96.98 $100.79
Differential USD/bbl -$4.77 -$2.40 -$1.71 $0.61 -$0.90 -$1.70 -$2.15 -$2.30 -$3.05 -$3.75 -$4.00 -$4.25 -$2.53
Exchange USD/CAD $0.793 $0.787 $0.792 $0.792 $0.784 $0.784 $0.784 $0.784 $0.784 $0.784 $0.784 $0.784 $0.787
Quality Adjustment CAD/bbl -$3.25 -$3.25 -$3.25 -$3.25 -$3.25 -$3.25 -$3.25 -$3.25 -$3.25 -$3.25 -$3.25 -$3.25 -$3.25
AECO C $/GJ $4.17 $4.48 $4.83 $6.61 $7.50 $7.41 $7.49 $7.25 $7.30 $7.30 $7.60 $7.95 $6.66
18Forward Looking Information
Certain statements contained in this Presentation include statements which contain words such as “anticipate”, “could”, “should”, “expect”, “seek”, “may”,
“intend”, “likely”, “will”, “believe” and similar expressions, statements relating to matters that are not historical facts, and such statements of our beliefs,
intentions and expectations about development, results and events which will or may occur in the future, constitute “forward-looking information” within the
meaning of applicable Canadian securities legislation and are based on certain assumptions and analysis made by us derived from our experience and
perceptions. Forward-looking information in this Presentation includes, but is not limited to: expected cash provided by continuing operations; future capital
expenditures, including the amount and nature thereof; oil and natural gas prices and demand; expansion and other development trends of the oil and gas
industry; business strategy and outlook; expansion and growth of our combined business and operations; and maintenance of existing supplier and partner
relationships; supply channels; accounting policies; credit risks; and other such matters. Forward-looking information in this Presentation also includes, but is not
limited to, the timing and amount of future dividend payments by Bonterra.
All such forward-looking information is based on certain assumptions and analyses made by us in light of our experience and perception of historical trends,
current conditions and expected future developments, as well as other factors we believe are appropriate in the circumstances. The risks, uncertainties, and
assumptions are difficult to predict and may affect operations, and may include, without limitation: foreign exchange fluctuations; equipment and labour
shortages and inflationary costs; general economic conditions; industry conditions; changes in applicable environmental, taxation and other laws and regulations
as well as how such laws and regulations are interpreted and enforced; the ability of oil and natural gas companies to raise capital; the effect of weather
conditions on operations and facilities; the existence of operating risks; volatility of oil and natural gas prices; oil and gas product supply and demand; risks
inherent in the ability to generate sufficient cash flow from operations to meet current and future obligations; increased competition; stock market volatility;
opportunities available to or pursued by us; and other factors, many of which are beyond our control. The foregoing factors are not exhaustive.
Actual results, performance or achievements could differ materially from those expressed in, or implied by, this forward-looking information and, accordingly, no
assurance can be given that any of the events anticipated by the forward-looking information will transpire or occur, or if any of them do so, what benefits will be
derived there from. Except as required by law, Bonterra disclaims any intention or obligation to update or revise any forward-looking information, whether as a
result of new information, future events or otherwise.
The term barrels of oil equivalent (BOE) may be misleading, particularly if used in isolation. A BOE conversion ratio of six thousand cubic feet per barrel
(6mcf/bbl) of natural gas to barrels of oil equivalence is based on an energy equivalency conversion method primarily applicable at the burner tip and does not
represent a value equivalency at the wellhead. All BOE conversions in the report are derived from converting gas to oil in the ratio mix of six thousand cubic feet
of gas to one barrel of oil.
The forward-looking information contained herein is expressly qualified by this cautionary statement.
19Forward Looking Information
USE OF NON-IFRS FINANCIAL MEASURES:
Throughout this presentation the Company uses the terms “funds flow”, “free funds flow”, "net debt" and "field netback" to analyze operating performance, which
are not standardized measures recognized under IFRS and do not have a standardized meaning prescribed by IFRS. These measures are commonly utilized in the oil
and gas industry and are considered informative by management, shareholders and analysts. These measures may differ from those made by other companies and
accordingly may not be comparable to such measures as reported by other companies.
The Company defines funds flow as funds provided by operations excluding effects of changes in non-cash working capital items and commissioning expenditures
settled. Free funds flow is defined as funds flow less dividends paid to shareholders, capital and decommissioning expenditures settled. Net debt is defined as current
liabilities less current assets plus long-term bank debt and subordinated debt. Field netback is defined as revenue minus royalties, operating expenses and
transportation expenses.
DRILLING LOCATIONS:
This presentation discloses drilling locations in three categories: (i) proved locations; and (ii) probable locations. Proved locations and probable locations, which are
sometimes collectively referred to as “booked locations”, are derived from the Company’s most recent independent reserves evaluation as prepared by Sproule as of
December 31, 2021 and account for drilling locations that have associated proved or probable reserves, as applicable. The locations that Bonterra drills will ultimately
depend upon the availability of capital, regulatory approvals, seasonal restrictions, oil and natural gas prices, costs, actual drilling results and other factors.
20Corporate Information
OFFICERS BANKS
George F. Fink CIBC
CEO National Bank of Canada
Robb D. Thompson The Toronto Dominion Bank
CFO & Corporate Secretary
Alberta Treasury Branches
Adrian Neumann
Business Development Bank of Canada
Chief Operating Officer
Export Development Canada
Brad A. Curtis
Senior VP, Business Development
INDEPENDENT RESERVE ENGINEER
Sproule Associates Limited
DIRECTORS
LEGAL COUNSEL
George F. Fink
Borden Ladner Gervais LLP
Jay J. Campbell
Stacey McDonald AUDITORS
Jacqueline R. Ricci Deloitte LLP
D. Michael G. Stewart – Chair of the Board
Rodger A. Tourigny REGISTRAR & TRANSFER AGENT
Odyssey Trust Company of Canada
HEAD OFFICE
Bonterra Energy Corp. STOCK EXCHANGE LISTING
Suite 901, 1015 – 4th St SW TSX: BNE
Calgary, AB T2R 1J4
Phone: 403.262.5307
21You can also read