Corporate Presentation November 2020 - Tourmaline Oil

Page created by Felix French
 
CONTINUE READING
Corporate Presentation November 2020 - Tourmaline Oil
Corporate Presentation
   November 2020
Corporate Presentation November 2020 - Tourmaline Oil
Tourmaline Overview                                                                                                                          2

                                                                                         The Scale, Resource, and Infrastructure Required to Profitably
                                                                                         Grow in the WCSB and Provide Returns to Shareholders Nov 2020

      Tourmaline Overview                                                                                                                  2.2MM Net Acres, 2.6 Billion Boe 2P Reserves(1)
                                                                               Conroy
      •    Largest natural gas producer in Canada
                                                                                                                                                                                                                          Drilled to Date
      •    5th largest Canadian gas processing midstream operator                                   Birley                                                                  T95

      •    2.6 Billion Boe 2P Reserves, 12.3 Tcf Gas and 552.8 MMbbls                                                                                                                            >50yrs of                2020 Drilling
      •    Lowest capital cost operator in the basin                        Gundy                                                                                                                 Drilling
                                                                                                                                                                                                Inventory(1)              Booked
      •    Lowest net emissions and intensity of Canadian senior producers        Montney                                                                                   T85
                                                                                                                                                                                                                          Locations
              •    46% reduction between 2013 and 2018                            Gas/Cond                                                                                                                                Unbooked
                                                                                (Third Largest                                                                                                                            Resource
      •    Peer-leading cash flow growth & free cash flow generation               Montney
                                                                                                                                                                                        Peace                     T75
      •    Investment Grade BBB rated by DBRS                                      Producer)                                                                                                                             NE
                                                                                                                                                                                      River High                         BC
      •    Largest insider ownership amongst Seniors, 4x peer average                                                                                                                                                         Alberta
      Tourmaline’s scale in Canada’s premium gas plays, production base and                                                                                                           Wapiti
                                                                                                                                                                                               Alberta Deep Basin T 65
      low cost infrastructure, provide investors a suite of advantages with         Tourmaline Land s
                                                                                      Jupiter Land s                                                       (3)                                   (Largest Deep Basin
      efficiency, profitability, growth, and return on (and of) capital                                                                                                                               Producer)
                                                                                                                                                                            Cutpick
      unparalleled by peers
                                                                                                                                                      Three massive operated
      Current Production
                                                                                                                                                                                                                               T 55
                                                                                                                                                      complexes, derisked by
                                                                                                                                                     1,587 wells drilled to date
      •        2020 Exit production guidance >400,000 boepd (Inclusive of A&D)                                                                       with company constructed
      •        2021 Average production forecast 390,000 - 410,000 boepd                                                                                infrastructure in place
                                                                                                                                                                                                                               T 45

                                                  Financial Position(2)                                                                                               Investment Proposition(2)

      Market Capitalization (Oct 30th 2020)                                                                               $4.7B              Debt Adj. Cash Flow Per Share Growth 2021/2020 >70%
      Net Debt (September                    30th)                                                                        $1.8B              Total Payout Ratio (2021 / 2022)                                          68% / 71%
      Enterprise Value                                                                                                    $6.5B              Free Cash Flow Yield (2021 / 2022)                                        17% / 15%
      Net Debt to Cash Flow (2021E)                                                                                        0.5x              Dividend Yield                                                                   3%
      2021 Cash Flow (Guidance)                                                                                           $2.0B              Five Year Plan Cumulative Free Cash Flow                                    $3.5bn
(1)       See schedule A in corporate presentation appendix; inventory life at 2020 pace of development, reserves and acreage as of December 31st 2019
(2)       DACFPS, liquids growth and FCF per five year plan, see current five year plan slide for definition of FCF, all market data as per Oct 30th, 2020; EV presented net of NCI
(3)       Jupiter Subject to Close
Corporate Presentation November 2020 - Tourmaline Oil
3

                                                              GHG Emissions – Peer Comparison
                                                                                                                                                    Mar 2020

Tourmaline has the lowest GHG emissions intensity (CO2/boe) among Canadian Senior E&P peers

                                                             Canadian E&P GHG Emissions 2018

                          25,000,000                                                                                                     0.12
                                                                                Tourmaline has achieved a 46% reduction in C02
                                                                                  emissions intensity between 2013 and 2018
                                                                                                                                         0.10
                          20,000,000

                                                                                                                                         0.08

                                                                                                                                                (tonnes CO2 (e)/boe)
    Gross CO2 Emissions
      (tonnes CO2 (e))

                          15,000,000

                                                                                                                                                    CO2 Intensity
                                                                                                                                         0.06

                          10,000,000
                                                                                                                                         0.04

                           5,000,000
                                                                                                                                         0.02

                                  -                                                                                                      -
                                        Suncor     CNRL          Husky    Imperial    Cenovus    Crescent Point    MEG     Tourmaline
   Q4 2018 Production                  831,000   1,081,000      304,000   431,000     432,000       178,000       88,000    277,000

   Notes:
   1. Based on CDP (Carbon Disclosure Project) data and includes Scope 1 and 2 emissions.                                    Gross CO2 Emissions
   2. Represents 2018 data.                                                                                                  CO2 Intensity
   3. Encana excluded since Encana does not disclose Scope 2 emissions, so figures are not comparable.
   4. Emission intensity derived by Gross CO2 Emissions divided by total production for the year.
Corporate Presentation November 2020 - Tourmaline Oil
4

                                                Diesel Displacement Initiatives
                                                                                                                           Sept 2020

 Initiative                                                        Annual Emissions Impact                         Net Savings
Highline Power                                                     • 1.4mm litres/yr fuel displaced              $400,000/yr savings
• PRH rig running on 100% electricity                              • 3,100 tC02e/yr

Natural Gas Fuel Gas Substitution                                  • 15 mm litres/yr fuel displaced with         $10mm/yr savings
TOU owns & operates 15 diesel displacement packages                  Natural Gas                                 3.5 month payout on
• Rigs & Frac spreads achieving ~40% substitution.                 • 9,500 tC02e/yr reduction                    install
• Path towards 100% natural gas powered D+C program
Natural Gas Power Generation
                                                                    • 3,000 litres/d fuel displaced with          ~$50k/pad savings
• 330 kW gas turbines operating across NEBC asset base since          Natural Gas
  July 2019
                                                                    • 50 tC02e/pad reduction
• Two TOU designed natural gas powered electrical packages
                                                                    • 44% emissions reduction
  online in Alberta Completion operations since July 2020
Pad Electrification                                                • Additional 9,000 litres/d to be displaced
                                                                                                                 ~$150k/pad savings
• Working towards total pad electrification through natural gas;     with Natural Gas and 5.5 tC02e/d
  removal of all diesel generation by end of 2021                    reduction once in place.

     TOU diesel displacement with NG                  TOU diesel displacement fleet              TOU Lease Electrification Initiatives
Corporate Presentation November 2020 - Tourmaline Oil
5

                                                                                            A History of Full Cycle Profitability
                                                                                                                                                                          Mar 2020
                                   400                                                                                                                                        6.00
                                                                                        *
                                   350
                                                                                                                                         Earnings before taxes ($mm)          5.00
                                                                                                                                         AECO (CAD$/mcf)
Earnings before tax ($ millions)

                                   300

                                                                                                                                                                              4.00
                                   250

                                                                                                                                                                                     AECO ($/mcf)
                                   200                                                                                                                                        3.00

                                   150
                                                                                                                                                                              2.00

                                   100

                                                                                                                                                                              1.00
                                       50

                                        -                                                                                                                                     0.00
                                            Q1 Q2 Q3 Q4 Q1 Q2 Q3 Q4 Q1 Q2 Q3 Q4 Q1 Q2 Q3 Q4 Q1 Q2 Q3 Q4 Q1 Q2 Q3 Q4 Q1 Q2 Q3 Q4 Q1 Q2 Q3 Q4
                                            '12 '12 '12 '12 '13 '13 '13 '13 '14 '14 '14 '14 '15 '15 '15 '15 '16 '16 '16 '16 '17 '17 '17 '17 '18 '18 '18 '18 '19 '19 '19 '19

                                                                         * Q4 2014 earnings enhanced by the sale of 25% of the Peace River High Complex.
                                   •        Tourmaline focusses on generating earnings and full cycle profitability/returns.
                                   •        Tourmaline has increased cash flow by >300% per share since the November 2010 IPO.
                                   •        The EP strategy focusses on selecting premium subsurface targets and continually reducing
                                            capital and cash costs as the development plans are executed.
                                   •        The focus on economic sweet spots will yield superior returns.
                                   •        Tourmaline can generate full cycle returns at gas prices above CAD$1.80/mcf.
Corporate Presentation November 2020 - Tourmaline Oil
6
                                                                           Largest North American Natural Gas
                                                                           Producers                                                                                                         Nov 2020

 Tourmaline is the largest natural gas producer in Canada, and the fifth largest gas focused producer in North America
  MMcf/d                                                           2021E Natural Gas Production – Canada & US
   4,000

   3,500

                               Scale is a key component in driving down costs,
   3,000                     leveraging transport & marketing opportunities, and
                            remaining relevant in the current market environment
   2,500

                 1
   2,000

   1,500

   1,000

      500

         0
                TOU         CNQ        OVV CA        ARX          VII        HSE          PEY         BIR         CVE                     EQT         COG          AR          SWN         RRC   CNX

TOU as per guidance, Peer data as per Bloomberg consensus October 22, 2020. OVV Canada 2020 assumes Q2/20 CA/US proportions. Jupiter gas volumes included, transaction subject to close.
Corporate Presentation November 2020 - Tourmaline Oil
7

                                                                                     Tourmaline: A Significant Canadian Liquids Producer
                                                                                                                                                                                       Nov 2020

   Tourmaline is a significant liquids producer in Canada, with continued peer leading growth
   •        Tourmaline is the 7th largest producer of conventional liquids, the second largest condensate producer and the
            second largest producer of NGLs
                •      Proforma recent A&D Tourmaline is poised to become the largest NGL producer and 6th largest conventional liquids
                       producer amongst Canadian Peers in 2021
   •        In 2020 Tourmaline transitioned its previously rapid growing liquids profile towards methodical liquids growth at
            a 6% CAGR in the 5 year plan (organically)
                •      Gundy Phase 2, will provide significant liquids growth, another ~13 Mbpd of predominantly condensate and
                       pentanes rich liquids production
                •      Inorganic growth through acquisition continues to accretively add liquids with >20 Mbpd acquired in 2020. This is
                       consistent with TOU’s approach of owning more of the supply through A&D, vs rapid drilling to grow supply
                          Q1 2020 Conventional Liquids(Mbpd)                                                                             Tourmaline Liquids Growth (Mbpd)
             457
                              Canadian Peer Producers
    140                                                   7th Largest Total Conv. Liquids Producer 140
                    129
                                                          2nd Largest Condensate Producer
                                                          2nd Largest NGL Producer                                                                                           6% CAGR
    120                     112 110                                                                120                                                                                         109
                                                                                                                                                                                       105
                                                                                                                                                                                100
    100                                                                                                              100                                                93
                                                                                                                                                                86
                                            82     79                                                                      2020E Exit A&D additions >20 Mbpd
       80                                                           Proforma 2020 A&D >80 Mbpd                        80
                                                           63      62                                                                                  65
                                                                        54 53 51                                      60                       55
       60                                                                                                                              48
                                                                                                 36                            39
       40                                                                                                             40
                                                                                                           26   25
                                                                                                                      21
       20                                                                                                             20

        0                                                                           0
            CNQ CPG          VII    SU     BTE HSE TOU WCP ERF VET CVE ARX POU TOG NVA                                        2017    2018    2019    2020E    2021E   2022E   2023E   2024E   2025E

                                         Conventional Oil & Condensate                 NGLs                                                                             Gundy Ph 2
Peer data sourced to public filings; 2020E A&D inclusive of Jupiter Resources which is subject to close.
                                                                                                                                                                        +13 mbpd
Corporate Presentation November 2020 - Tourmaline Oil
8

                                                                                          Current 5 Year Plan(1)
                                                                                                                                                                                                                        Nov 2020
              600,000

              500,000

              400,000
                                                                                                                                                                                                                Spirit River
      Boe/d

              300,000
                                                                                                                                                                                                                NEBC
              200,000                                                                                                                                                                                           Deep Basin

              100,000

                      -
                          2016              2017              2018               2019              2020               2021              2022              2023               2024              2025                    Ending
                                                                                                                    E&P                                                                                               Surplus
                                                              After-tax                 After-tax                Capital                Free Cash                   Topaz              Tourmaline                        (Net
                                          Prod’n             Cash Flow                    CFPS -              Program(4)                   Flow(5)             Dividend(6)               Dividend                     Debt)(3)
                                          BOEPD               $MM(2)(3)                   Diluted                  $MM                       $MM                    $MM                      $MM                        $MM
              2021E                     400,000                   $2,000                     $6.74                  $1,100                      $856                    ($44)                  ($166)               ($1,032)
              2022E                     426,000                   $1,926                     $6.49                  $1,115                      $765                    ($44)                  ($166)                  ($477)
              2023E                     448,000                   $1,770                     $5.96                  $1,177                      $544                    ($44)                  ($166)                  ($143)
              2024E                     465,000                   $1,792                     $6.04                  $1,162                      $579                    ($44)                  ($166)                     $226
              2025E                     482,000                   $1,922                     $6.48                  $1,152                      $718                    ($44)                  ($166)                     $734
(1)     5 year plan derived by utilizing, among other assumptions, historical Tourmaline production performance and current cost assumptions inflated at 2.5% annually after 2021. 2022 and beyond provided for illustration only. Budgets and
        forecast beyond 2021 have not been finalized and are subject to a variety of factors including prior year’s results. 5 year plan assumes Topaz Energy Corp. (“Topaz”) is a fully consolidated subsidiary of Tourmaline Oil Corp. Jupiter
        Resources is incorporated in the 5 year plan, transaction is subject to close.
(2)     Price assumptions: Gas price - $3.11 2021 NYMEX US, $2.78 2022 NYMEX US, $2.54 2023 NYMEX US, $2.46 2024 NYMEX US, $2.44 2025 NYMEX US, $2.99 2021 AECO, $2.68 2022 AECO, $2.33 2023 AECO, $2.29 2024
        AECO, $2.36 2025 AECO. Oil price - $41.24/bbl 2021 WTI US, $42.20/bbl 2022 WTI US, $42.97/bbl 2023 WTI US, $43.72/bbl 2024 WTI US, $44.53/bbl 2025 WTI US.
(3)     See “Non-GAAP Measures” in Forward Looking Statement Advisories.
(4)     E&P Capital Program is defined as total capital spending before acquisitions, dispositions and other corporate expenditures.
(5)     Free Cash Flow is defined as Cash Flow less Total Net Capital Expenditures. Total Net Capital Expenditures is defined as the sum of E&P Capital Program and other corporate expenditures, net of non-core dispositions . Free Cash
        Flow is prior to dividend payments made by Tourmaline and Topaz.
(6)     Topaz Dividend includes dividends paid out by Topaz, excluding dividends paid to Tourmaline Oil Corp.
Corporate Presentation November 2020 - Tourmaline Oil
9

                                                                                     Alberta Deep Basin
                                                                                                                                                                                      Nov 2020
                                                                              The contiguous Tourmaline interconnected Deep Basin
 T65 R9             R7            R5
                                                                              Cretaceous gas asset is effectively Alberta’s Largest Gas Field.

 T63
                                                                                                                                 •     Current Production       175,000 - 180,000 boepd
                                                                                                                                 •     Current Reserves         1,016.5 mmboe (Jan 1, 2020)
                                                                               TCPL Main Line
                                                                                                                                 •     Tourmaline Land Base     1.60 million acres (gross)
                                                                                                                                 •
 T61
                                                                                         Fir                                           Drilling Inventory       1,923 locations (vertical)
             Musreau
                                                      Leland                                                                                                    (~1.5wells per section only)
             /Kakwa
T59
                                                 Smoky
                                                                                                                                T59
                                                                                                                                                                6,700 hz locations
                                                                                                           Cecilia

                                                                                                                                 The Company has drilled >850 wells to date with a
                                                                                                                                T57

                  Cardium                                                                                                        future hz drilling inventory of over 6,700 locations.
                                    Harley                       Wild                                                Oldman
                 Dunvegan                                        River                                                          T55

                   Viking
            Mannville/Notikewin                                                                            Sundance                  T53
                                                 Marsh
                                                                                                                                 Edson
                   Falher                      R3           R1W6                                                                                                    T51

                                                                              Hinton
                   Wilrich                                                                                                                                          T49

                  Bluesky                                                                                                      Ansell
                                                                                                Minehead
                  Gething                                                                                                                                                 T47    NE    Alberta
                   Gething                      Tourmaline Lands                                                                                                                 BC

                                                Tourmaline Gas Plant                                                                                                      T45
                  Cadomin                       Possible Facility Locations                                           Lovett

                 Nikinassin                     2015
                                            T. 51      Significant New Discoveries                                                                                        T43
                                                                                                                                Brazeau

                                                                               R26        R24        R22         R20           R18         R16     R14        R12          R10
Current production inclusive of Modern Resources (closed November 3rd 2020)
Corporate Presentation November 2020 - Tourmaline Oil
10

                                                                                Alberta Deep Basin 2020 Acquisitions
                                                                                                                                                                                          Nov 2020

                                         R13          R11   R9
                                                                   The
                                                                    R7
                                                                        contiguous
                                                                          R5    R3
                                                                                    Tourmaline
                                                                                      R1W6   R25
                                                                                                 interconnected
                                                                                                   R23   R21  R19
                                                                                                                  Deep
                                                                                                                     R17
                                                                                                                         Basin
                                                                                                                            R15 R13                             R11
          TCPL
         Main Line
                                                                   Cretaceous gas asset is effectively Alberta’s Largest Gas Field.                                        T71
                                                                                                                                                                                           Cardium
                                   1                               It’s about to get significantly larger…
                                                                                                                                                                                          Dunvegan
                                                                                                                                                                           T69
                                                                                                                                                                                            Viking
                                   16
                                                    Elmworth                                       Modern Acquisition
                                                                                                                                                                           T67         Mannville/Notikew
            Chinook                                                                                •     9,000 boepd growing to 12,500 boepd in 2021                                           in
             Ridge                                                     Wapiti                      •     Over 400TCPL
                                                                                                                  sections
                                                                                                                      Main Lineof prospective land
                                                                                                                                                                           T65              Falher
                                   9                                                               •     New, strategically located 125 mmcfd Plant
                                                                           Musreau                 •     Over 80 mmboe of incremental 2P reserves
                                                                           /Kakwa                                                                                          T63              Wilrich
                                        Netook                                                                                                                                              Bluesky
                                   8
                                                                                                                             East Kakwa Delineation Success                T61
                                                    Lynx
                                                                                           Leland                            • Significant extension to                                    Gething
                                                                                                               Fir
                                                                                                                               Musreau-Kakwa complex                                       Gething
                               1
                                                        Cutpick                 Smoky                                                                                      T59

     Jupiter      Acquisition(1)                                                                                             Cecilia
                                                                                                                                                 New Falher D                              Cadomin
                                                                                                                                                 Exploration Lands         T57
     • 67,500 boepd 2020 production growing to                                                     Wild                                                                                   Nikinassin
       75,000 boepd 16
                     in 2021/2022                                         Harley                   River                              Oldman
                                                                                                                                                                           T55
     • Over 500 Net sections with avg 84% WI                                                                                                   TCPL
     • Gas Plant WI in Resthaven & Kakwa                                                                                                                              Edson Acquisition
                                                                                                                                          Edson
     • Over 350 mmboe9 of 2P reserves
                                                                                                                                                                      • 75 T53
                                                                                                                                                                           Sections
                                               12

                                                                                   Marsh
                                                                                                                                                                      • 3,000 boepd increasing to
                                                                                                                                                                        6,000
                                                                                                                                                                           T51 boepd in 2021
                               8                Smoky-Horse-Leland New Falher Play
     Legend                                     • 6-8 bcf, 500-600 mstb liquids per well
                                                                                                                                                      Edson           • 30 mmboe 2P reserves
                                                                                                             Hinton                                                   • 40-60
                                                                                                                                                                           T49 locations
                                                • 80-100 bbls/mm cond and ngls
            2020 Jupiter Acquisition
                                                                                                                                          Ansell
            2020 Acquisitions                                                                                        Minehead                                              T47
                                                                  Anderson Cardium Back Limb Success
            2019/2020 Acquisitions                                • Significant inventory expansion                                                                    TCPL Main       NE Alberta
                                                                  • 15-1, 12 mmcfpd, 450 bbls/d cond.                                                                    Line
                                                                                                                                                                           T45
            Tourmaline Lands                                                                                                      Lovett                                               BC
           Jupiter WI Gas Plants
                                                                         Incremental Viking Lands Brazeau – Viking Play                                                    T43
           Tourmaline Gas Plant                                                                                                           Brazeau
                                                                         • 13-22 kv 21 mmcf/d 250 bbls/d cond.
           2015
       T. 51      Significant New Discoveries                                                                                                                              T41
                                                                                            R1W6       R27     R25     R23      R21     R19     R17    R15      R13
1. Jupiter subject to close.
11

                                                                                  Jupiter / Modern Transaction Overview(1)
                                                                                                                                                                            Nov 2020

  A material addition to the Tourmaline Deep Basin asset growing total complex production to
  approximately 250,000 boepd in 2021
  •       Strong acquisition metrics: 2021 cash flow metrics of 3.0x, 2022 FCF yield vs consideration of 18%
             • Net of Topaz GORR proceeds of $130mm, 2021 cash flow metrics of 2.6x, and ‘22 FCF yield of 20%
  •       Considerable synergies between the two asset bases and significant cost synergy for both via the Tourmaline
          lower operational and capital cost model
  •       The two asset bases (900 sections of land, 445 MMboe of 2P reserves) are expected to add ~$300mm in annual
          cash flow and yield $130-150mm/yr of free cash flow in 2022 and beyond
  •       The Musreau-Resthaven-Kakwa sub-area of the Deep Basin yield amongst the highest EUR wells and liquids
          yields in the entire Deep Basin Complex

$mm
                                                                           Jupiter(1) / Modern Cash Flow Outlook
$800

$700                                                                                                                            Cumulative FCF Exceeds
                                                                                                                            Acquisition Consideration by 2026
$600

$500

$400

$300

$200

$100

   $0
             2021E                 2022E                2023E                 2024E                 2025E             2026E           2027E          2028E      2029E   2030E
                                                                               Cash Flow               Capex          FCF         Cummulative FCF

All estimates as per internal outlook on October 27th 2020 forward strip.
1. Jupiter Resources subject to close; Jupiter and Modern consideration as implied by a TOU share price of ~$17.60.
12

                                                             NEBC Montney Gas/Condensate Complex
                                                                                                                                                          Nov 2020

         TOU Land
                                                                                                   Current Prod.       580-600 mmcf/d
                                                                                                                       14,000-15,000 bpd condensate
                                  C-60-A Gas Plant
         TOU Wells
                                  200 MMCF/D                                                                           13,000-14,000 bpd ngl
                                  Q2 2019
         TOU Pipelines
                                                                                                   Current Reserves    1,344.1 mmboe (Jan 1, 2020)
         TOU Gas Plants
                                               Spectra Ft.

         TOU Compressor Station
                                                Nelson
                                                Mainline                                           Montney Drilling    In excess of 4,228 horizontal
                                                                                                   Inventory*          locations.
         Major Pipelines             A-21-I Gundy
                                     Comp. Station
                                     180 MMCF/D

              2020 NEBC Development Plan
2020 Drilling        • 100 wells (D,C,T)
                                                                                                                            13-25 Doe Gas Plant
2020 Facilities      • a-21-a expansion, production                                                                         110 MMCF/D
                       acceleration at South Gundy                                                         Westcoast
                                                                                                           McMahon
                     • Gundy Water Hub                                                                     Gas Plant
                                                               TCPL North
                                                              Morntney 2019
                                                                                                                                              1-32 Doe
                                                                                                                                              Comp. Station
                     • Doe Water Hub                                                                                                          TOU 13 MMCF/D
                                                                         3-18 Sunrise Gas Plant
                                                                         80 MMCF/D

                                                                                                                                                    2-11 Doe Gas Plant
                                                                                                                              TCPL Mainline         Start-up Mar 30, 2017
                                                                                                                                                    60 MMCF/D
                                                                        B-67-H Sundown Gas Plant
 Tourmaline is one of the largest Montney producers                     60 MMCF/D
 in Western Canada with current production of                           11 MMCF/D to North River
 125,000-130,000 boepd and a 2020 exit production                       Sour
 target of 135,000 boepd.
                                                                                                                                                              * See Schedule A
boe

                                                                           20,000
                                                                                    40,000
                                                                                             60,000
                                                                                                            80,000
                                                                                                                     100,000
                                                                                                                               120,000
                                                                                                                                                   140,000

                                                                       0
                                                    Tourmaline d-010

                                                    Tourmaline b-020

                                                    Tourmaline a-020

Tourmaline liquids data as per internal data
Source: Peer data as per National Bank of Canada,
                                                    Tourmaline a-020

                                                    Tourmaline b-020

                                                    Tourmaline d-020

                                                    Tourmaline b-020

                                                    Tourmaline a-020

                                                    Tourmaline d-001

                                                    Tourmaline b-020
                                                                                                                                                                                                               Top BC Montney Wells

                                                    Tourmaline d-010
                                                                                                                                                                    (On production between May to July 2020)

                                                      Petronas c-043
                                                                                                                                         Liquids

                                                    Tourmaline d-001
                                                                                                                                         Gas

                                                    Tourmaline d-020

                                                     Petronas b-043
                                                                                                                                                                                                                         13

                                                                                                                                                             Aug 2020
14

                                                   NEBC Montney Consolidation
                                                                                                                                                        Mar 2020

Polar Star Canadian Oil and Gas Inc.                         Polar Star Lands
                                                             Chinook Lands                       Polar Star Facility
▪ ~ 2,500 boe/d
▪ ~ 19% Liquids                                                                                                                               Chinook Martin Ck
                                                                              Polar Star Lands                                                20 MMcf/d
▪ ~ 106,000 Net acres of Montney Rights                                                                                                       Sour Gas Plant
▪ 80,767 Mboe 2018YE 2P Reserves
▪ 20 MMcf/d Compression Station, 30 MMcf/d
  DEHY                                                                  North River Jedney
                                                                        160 MMcf/d
▪ Flows to North River Jedney Sour Gas Plant                            Sour Gas Plant
                                                                                                                                               Chinook Lands

Chinook Energy Inc.
▪ ~ 3,500 boe/d                                                                                                                                       Chinook Comp. Sta.
                                                                              Chinook 12” Sour Pipeline                                               50 MMcf/d
▪ ~ 14% Liquids                                                               190 MMcf/d Sales
▪ ~ 54,000 acres of Montney Rights at Birley/
                                                                                                                                           Enbridge
    Martin Creek                                     Enbridge T-North                                                                      pipeline
                                                     Pipeline
▪ 35.6 MMboe 2018YE 2P Reserves
                                                                                                                             Aitken Ck Hub
▪ 20 MMcf/d Martin Creek Sour Gas Plant                                                                                      Access to Alliance, North
                                                                                                                             Montney, Fortis BC Gas Storage,
▪ 50 MMcf/d Compressor Station                                                                                               and Enbridge System
                                                             C-60-A Gas Plant
▪ 12 “ Sour Gas Pipeline which ties into Aitken              200 MMCF/D                                                  Alliance
    Creek Hub;                                               Q2 2019                                                     pipeline
                                                                                                                                                      Legend

       •Access to Alliance to Chicago                                                                                                                   TOU Land

       •North Montney (NGTL System) to Alberta                                                                                                          TOU Pipelines
        Markets                                                                                                                                         TOU Facilities
       •Enbridge System to Station 2 and Western                                                                  A-21-I Comp Sta.
                                                                                                                                                        Competitor Facilities
                                                                                                                  180 MMCF/D
        USA
                                                                                                                  Q2 2020                               Major Pipelines
       •Fortis BC Gas Storage
15
                                                             Peace River High Complex Triassic Oil
                                                             Charlie Lake and Montney Plays
                                                                                                                                                             Mar 2020

Peace River High                                                                                               R. 11                     R. 9   R. 7                    R. 5

• 1,826 Horizontal Locations* along Regional Play                     Mulligan/Earring Upper Charlie Lake
                                                                                                                                                       15-13 Mulligan
  Fairways                                                            IP30 production rates (normalized)
                                                                                       IP30 OIL     IP30 GAS    IP30BOED                               Oil Battery
• Current Reserves of 241.9 mmboe                                     0/13-12-83-8       688.3         480.2       766.3
                                                                      0/12-13-83-8       733.8         578.3       830.2                                                  T. 83
   (Jan 1, 2020 GLJ)                                                  0/08-21-83-8       461.2         326.7       515.7
• Regional pool defined by 255 hztl and 140
  existing vertical wells
• 300 - 550 mboe 2P reserves per horizontal
  Charlie Lk/Montney                                                                                                                                         12-6 Mulligan
                                                                                                                                                             Oil Battery
• $2.1 - $2.5M Charlie Lk horizontal                                                                                                                                     T. 81

   Drill/Complete Cost
                                                                    Spirit River Upper Charlie Lake
• Upper Charlie Lake wells are profitable on a full                 IP30 production rates (normalized)                                                         6-3 Spirit River
  cycle basis at $25/bbl (U.S. WTI)                                             IP30 OIL       IP30 GAS        IP30BOED                                        Oil Battery
                                                                    3/16-22-78-7 608.2          1,159.6            801.5
• 10 Lower Charlie Lake delineation wells in 2020                   0/14-36-78-7 858.2            952.0          1,016.9
                                                                    0/12-03-79-7 651.0            771.0            773.0
• 14 Upper Charlie Lake delineation wells in 2020                                                                                                                         T. 79

• 3 Lower Montney oil tests in 2020
                                                                                    Spirit River Montney
       Type Log 6-11-77-8 W6                      Legend                            IP30 production rates (normalized)
                                           Tourmaline Lands                                            IP30 OIL IP30 GAS      IP30BOED
                                          Tou UpperCharlie Lake HZ Drills           2/01-04-78-8         805.0 4,252.6         1,513.8
                                                                                    0/02-04-78-8       1,145.7 4,945.1         1,969.9
         Upper                            Tou Lower Charlie Lake HZ Drills          2/01-29-76-7 (A) 190.1 3,141.0               713.6
                                                                                                                                                                          T. 77
      Charlie Lake                        Tourmaline Montney HZ                     0/04-28-76-7         153.0 3,011.0           630.0

                                          Tourmaline HZ Well Loc.
                                          Tourmaline HZ Wells
                                                                                     Spirit River Lower Charlie Lake                                             3-10 Spirit River
                                            Tourmaline Battery Site                  IP30 production rates (normalized)                                          Gas Plant
         Lower                                                                                       IP30 OIL      IP30 GAS    IP30BOED
                                            Tourmaline Gas Plant
      Charlie Lake                                                                   0/16-14-77-8 1,064.8          1,642.4      1,338.5
                                            Lower Charlie Lake Fairway               0/13-14-77-8      831.0       1,593.0      1,084.0                                   T. 75
                                            Upper Charlie Lake Fairway
                                                                                     0/04-31-77-7      590.0       1,330.0        801.0

                                            Montney Fairway                        IP 30 OIL units bbl/d, IP30 GAS units mscf/d
                                                                                                                                                            * See Schedule A
16

                                                              Tourmaline Mid-Stream Assets                                                   Nov 2020
                                                    The infrastructure skeleton in all three core operated complexes is now complete.
                                                     This  infrastructure is essentially
                                                      R. 15W6                   R. 1W6   all newR.and
                                                                                                   15W5in the ‘growth’ areas of the WCSB.
NE     Alberta
BC                             Gundy
                                                                                                • 20 Working interest gas plants, 14 of which
                                                                                                  are 100% owned and operated
                                                          Peace River High
                                                                                                               T85
                                                                                                • 16 compressor stations
                                         Sunrise-          Charlie Lk Oil
                                         Dawson
                                                              Mulligan/Earring

                                                                                       • Current Tourmaline gas processing capacity of
                                        Sundown
                                                                Spirit River
                                                                                         1.80-1.85 bcf/day.
                                                                                                        T75 (1.65-1.70 bcf/day net post-Topaz)

                                        Montney
                                        Gas/Cond
The Company estimates $325MM(+) per year of
                                                                                                       Two oil processing batteries with combined
cash flow is effectively preserved by owning the                                                       processing capacity of 48,000 bpd.
                                                    Chinook
operated infrastructure and not processing gas
                                                     Ridge
through third party/midstream plants.                                                                          T65
                                                                            Alberta Deep
                                                                                                                     Oil, condensate and ngl storage
          Legend                                                                  Basin
                                                                           Kaybob                                    capability of 325,000 bbls.
                                                     Musreau/
      Tourmaline Lands                                                                  Fir
                                                      Kakwa        Horse

      Tourmaline Gas Plant Site
                                                          Harley                      Cecilia
                                                                                                               T55
                                                                                                                         4,500 km of Tourmaline
      Tourmaline Compressor                                        Marsh                                                 Operated Pipelines
                                                                                                 Edson
                                       Water Infrastructure
      Tourmaline Oil Battery                                               Hinton
                                       • 8 Major Frac Water source/                           Ansell
                                         Recycling Facilities,                   Minehead                               12 MW gas fired electrical
      Tourmaline Main Laterals           450,000 m3 capacity                                                            generating capacity.
                                                                                                               T45
                                                                                            Lovett
      Main Sales Pipelines
                                                                                                     Brazeau
17

                                                                                    Tourmaline 2020 Acquisitions, Accretive by 2021
                                                                                                                                                                                                                      Sept 2020

   Transaction Attributes                                                                       2020 Development                                         2021 Outlook                                          LT Plans
Gundy Land Acquisition (Q4/19)                                                                 • Drill 8 well pad (1H20)                        • Drill & Complete 6 well                            • Continue to ramp
•   8,460 net acres acquired for $49mm                                                         • Tie 9 wells in (Q3)                              pad                                                  with Gundy Ph2
•   Immediate development line of sight                                                                                                         • Production ~ 7kboepd
•   Very economic on current strip                                                                                                              • CF >$40mm

 Conroy – Polar Star (Q1/20), Chinook Energy (Q2/20)                                            • No D&C                                         • Drill 8 wells on existing                          • Capable of own
 •   160,000 net acres acquired for $33mm                                                       • Operating / Processing                           pads                                                 ‘Gundy’ style
 •   Acquired production of 6 kboepd                                                              costs reduced ~45%                             • Production ~ 9kboepd                                 development
                                                                                                                                                 • CF ~$35mm                                            2024+
       •    PDP 10 MMboe 2P 116 MMboe
 Deep Basin (2020)                                                                             • Drill 6 wells (2H20)                            • Drill 6 wells                                     • Harvest free cash
 •   67 net sections acquired for $38mm                                                        • Production exits                                • Production ~ 5kboepd                                flow as part of
 •   Acquired production of 3 kboepd                                                             ~5 kboepd                                       • CF ~$25mm                                           Deep Basin
                                                                                                                                                                                                       operating plan

      Acquired Asset Cash Flow Outlook                                                                          FCF Yield                                                          Production Outlook
 $mm                                                                                                    TOU EP vs Acquired                             25,000        Boepd                                                  23,000
                                                                                                                                             50%                                                   21,000

                                            $42                                                                                                        20,000
                                                                          $59                            35%
                                                                                                                                                       15,000
                                                                                                                                                                           11,000
                                  $104                         $100
                                                                                               17%                                                     10,000
                                                                                                                                   15%
                                            $63
     $40       $47                                                        $41                                                                            5,000

                                                                                                                                                               0
    20202020E                  2021
                                  2021E                       2022
                                                                 2022E                          2021E                           2022E                                      2020E                    2021E                   2022E
                          Cash Flow    Capex                FCF                           TOU FCF Yield          Sum A&D FCF / Consideration Paid                            Gundy Land           Conroy         Deep Basin

                                                                                  Acquisitions FCF Accretive to TOU 5 Year Plan
All estimates as per internal outlook on August 31st 2020 forward strip; acquired asset cash flow / FCF are sum of Gundy, Chinook, Polar Star & Edson acquisitions. TOU FCF Yield as per current 5 year plan & Oct 30th Mkt Cap.
18

                                                                                      Historical Reserves Summary
                                                                                                                                                                                                        Mar 2020

                                                        Reserves (GLJ)                                                                                         Reserves
                                                2015    2016       2017            2018      2019                                  2012        2013       2014       2015        2016       2017        2018       2019
                                 3,000
                                                                                                                                   (mmboe)    (mmboe)    (mmboe)     (mmboe)    (mmboe)    (mmboe)     (mmboe)    (mmboe)

                                 2,500                                                                            PDP               91.9      122.3 177.8 263.2 352.1 436.5 473.5 527.4

                                                                                                                  TP               249.2 316.5 472.3 644.1 859.2 1,056 1,207 1,294
                                 2,000
     MMBOE

                                                                                                                  2P               438.1 590.1 855.8 1,108 1,747 2,217 2,458 2,602
                                 1,500                                                                            Finding & Development Costs ($/boe)

                                 1,000                                                                            2P FDA(i)
                                                                                                                            $10.35 $11.84 $10.40 $5.89 $5.94 $3.76 $5.15 $4.26
                                                                                                                 _With FDC
                                  500                                                                            (i) See March 2020 press release for full FD&A disclosures
                                                                                                                 (ii) Reserves figures include the Company’s working interest share of reserves prior to the deduction of
                                                                                                                      interest owned by others (burdens) and include royalty interest reserves owned by the Company.
                                    0
                                                PDP                   TP                     2P
                                                       Reserves Value (GLJ, 2P)                                    • Total Proved Reserve life index a reasonable 12
                                 18.00                                                                               years.
                                                                                           15.93           (1)

                                 16.00                                             15.10           15.09           • 2P FDC realistic, at approximately 5 years of
 $ Billion (*Jan 2020 Pricing)

                                 14.00                                 12.71                                         future projected cash flow. Historically
                                 12.00                                                                               Tourmaline has systematically converted the 2P
                                 10.00                                                                               reserves to PDP reserves in the 4 - 5 year time
                                                       7.65 8.25                                                     frame.
                                  8.00          6.19
                                  6.00   4.35                                                                      • Positive technical revisions each of the last
                                  4.00                                                                               seven years.
                                  2.00
                                  0.00
                                                                                                                   • Considerable reserve value/NAV increase
                                         2012   2013   2014    2015        2016    2017    2018     2019             opportunity with improving gas prices.
(1) 2019 Reserve value impacted by Topaz sale and reduced engineering price deck
19
                                                         Gas Development Location
                                                         Inventory and Economics                                                   Mar 2020

                                        AB Deep          Outer          AB Deep       B.C. Gundy        B.C.           PRH           PRH
                                         Basin          Foothills        Basin         Montney         Montney      Charlie Lake    Montney
                                        Vertical        Vertical       Horizontal     Horizontal      Horizontal     Horizontal    Horizontal
Total Well Costs
(Drill, Case, Complete, $ Million)        2.35            3.50            4.10           2.80            2.45            2.20        3.50

Average Reserves/Well (bcfe)               2.3             5.9            5.4             7.8             5.3            2.0          4.8

Year 1 Production Rate                1.5 mmcfepd     3.6 mmcfepd     4.0 mmcfepd    5.3 mmcfepd     3.8 mmcfepd      205 boepd    412 boepd

Development Cost/boe                      $6.22          $3.53           $4.56           $2.15          $2.75           $6.60        $4.38

Operating Expenses/boe (1)                $3.17          $2.18           $2.28           $2.78          $2.14           $9.17        $7.75

Net Present Value @ 10% (000's)           $114           $3,905         $2,906          $8,655          $4,791         $2,797       $4,556

Internal Rate of Return (2)               12%             54%             39%            430%           165%             80%         61%

Payback Period (months)                    25              22              25              5               9              15          19

Year 1 Gas Price (3)                      $1.89          $1.78           $1.89           $1.29          $1.50           $1.90        $1.90

Future Development Locations (4)          1,923           450            6,491           1,877          2,351           1,192         634

  Notes:
  (1) Average operating expenses over the initial five years of production.
  (2) Internal Rate of Return calculation is based on monthly cash flows.
  (3) Independent Reserve Engineer Jan 1, 2020 escalated price forecast, adjusted for transportation, quality and heat content.
  (4) See Schedule A.
20

                                                                        The TOU Engineering Execution Machine
                                                                                                                                                     Mar 2020
                                                                                                                             Drill & Complete Costs
                          8.00                       Tourmaline has the lowest completed per stage                           (Equipping not included)
                                                     well costs in the overall Montney play in
                          7.00                       Western Canada and the Alberta Deep Basin.                                   South Deep Basin
    Capital Cost ($MM)

                                  6.8
                          6.00                                                                                                    NEBC (South Complex)
                                                    6.0
                                        5.7                                                                                       PRH (Charlie Lake SR)
                          5.00                            5.3         5.5

                          4.00                4.5
                                                                            4.2
                                                                4.1
                          3.00                                                    3.5   3.4               3.6               3.4
                                                                                                                                  3.2         3.2
                                                                                              2.8               2.7                     2.6         2.7 2.6
                          2.00                                                                      2.5               2.4

                          1.00
                          0.00
                                    2013              2014              2015              2016              2017              2018               2019

•                        Since Feb 2009, Tourmaline has drilled 1,587 wells across all three core operated complexes.
                         (Deep Basin 804 wells, NEBC 443 wells, PRH oil 340 wells)
•                        Through continuous engineering design improvements in all aspects of drilling and completions
                         operations, Tourmaline has realized a cost reduction of over 50% in all 3 complexes since 2012.
•                        Tourmaline has the internal staff capability to efficiently operate 22(+) drilling rigs, the current 5
                         year financial outlook assumes a 11/15 rig program.
21

                                                                        Continuous Capital Efficiency Improvements
                                                                                                                                                        Nov 2020

          $22,500
                                                                                                    • 2020 will yield the best capital efficiency metrics in
                                                                                                      company history.
          $20,000
                                                                                                    • 2018 was affected by the major Gundy Phase 1 Deep Cut
                                                                                                      gas plant expenditure.
          $17,500

          $15,000

          $12,500
$/boepd

          $10,000

           $7,500

           $5,000

           $2,500

                $-
                                                                                                                                              (1)              (1)(2)
                                2014                  2015                  2016                 2017         2018          2019         2020E         2021E

    (1)   Based on 5 Year Plan Guidance released on November 4, 2020
    (2)   Includes $100 million related to major Gundy Phase 2 Deep Cut gas plant expenditures
22

                                                                           Continuous Cost Reduction Strategy
                                                                                                                                                                                    July 2020

                                      Operating Costs                                                                       General and Administrative Costs
        $7.00
        $6.50   $6.34                                                                                   $1.50

        $6.00                                                                                                   $1.29
                        $5.58
        $5.50                                                                                                           $1.02
                                              $4.87                                                     $1.00
        $5.00

                                                                                                $/boe
$/boe

                                                                                                                                $0.79
                                $4.43 $4.35           $4.37                                                                             $0.74
        $4.50
                                                                                                                                                $0.60                                   $0.60
        $4.00                                                                                                                                           $0.45 $0.44 $0.46 $0.49 $0.49
                                                                                                        $0.50
        $3.50                                                 $3.31 $3.19 $3.33 $3.28
                                                                                        $3.01
        $3.00
        $2.50
                                                                                                        $0.00
                2010 2011 2012 2013 2014 2015 2016 2017 2018 2019 1H20
                                                                                                                2010 2011 2012 2013 2014 2015 2016 2017 2018 2019 2020F

        •   Tourmaline has the lowest effective interest rate/borrowing costs in the North American energy sector.

        •   The staff required to effectively operate a 300,000 boepd company growing to 350,000 boepd has already
            been assembled.
23

                                                           2021 Guidance
                                                                                                                                            Nov 2020

                                                                                                      2021(1)

           Production – Boe/d                                                                       400,000
           Cash Flow(i) - $MM                                                                         $2,000

           CFPS - Diluted(i)                                                                            $6.74

           E&P Capital Program(ii) - $MM                                                              $1,100

           Free Cash Flow(iii) - $MM                                                                     $856

           Exit Net Debt(i) - $MM                                                                     $1,032

           Debt to CF                                                                                     0.5x

(1) Price Assumptions: Gas price - $3.11/mmbtu 2021 NYMEX US, $2.99/mcf 2021 AECO; 2020 Oil price - $41.24/bbl WTI US. Guidance assumes
      Topaz Energy Corp. (“Topaz”) is a fully consolidated subsidiary of Tourmaline Oil Corp.Subject to the close of Jupiter Acquisition.
(i) See “Non-GAAP Measures” in the Forward Looking Statement Advisories section of this presentation.
(ii) E&P Capital Program is defined as total capital spending before acquisitions, dispositions and other corporate expenditures.
(iii) Free Cash Flow is defined as Cash Flow less Total Net Capital Expenditures. Total Net Capital Expenditures is defined as the sum of E&P
Capital Program and other corporate expenditures, net of non-core dispositions. Free Cash Flow is prior to dividend payments made by
Tourmaline and Topaz.
24

                                                                                      Cash Flow & Free Cash Flow Sensitivity
                                                                                                                                                                                                         Nov 2020

   Tourmaline has excellent free cash flow resiliency in 2021, with significant free cash flow
   on a modest growth budget at current strip
   •       Tourmaline’s 2021 growth budget is FCF positive down to approximately US$1.90/Mcf NYMEX and US$40/bbl WTI
   •       Additional downside protection available through flexibility to shift to a $900mm maintenance budget (+$200mm
           FCF) and AECO basis tightening in low NYMEX scenarios
                  2021 Cash Flow Sensitivity ($mm)                           2021 Free Cash Flow Sensitivity ($mm)
                                                                                       US$/bbl WTI                                                                                                 US$/bbl WTI
                                                                                       $65.00                                                                                                      $65.00

                                                                                       $60.00                                                                                                      $60.00

                                                                                       $55.00                                                                                                      $55.00

                                                                                                                     2021 Strip

                                                                                       $50.00                AECO Basis US$0.84/mmbtu                                                              $50.00
                                                                                                               Condy Diff US$1.64/bbl
                                                                                                                PSO Diff US$7.44/bbl

                                                                                       $45.00                                                                                                      $45.00

                                                                                       $40.00                                                                                                      $40.00

                                                                                                                        FCF Bands
       CFO Bands                                                                                                  (Current Growth Budget)
                                                                                     $35.00                                                                                                         $35.00
                  $3.50           $3.25        $3.00     $2.75                   $2.50                                                          $3.50           $3.25     $3.00      $2.75      $2.50
                                           US$/Mcf NYMEX                                                                                                              US$/Mcf NYMEX
       $1,000 - $1,500 $1,500 - $2,000                 $2,000 - $2,500          $2,500 - $3,000                                         $0 -$500             $500 -$1,000      $1,000 -$1,500     $1,500 -$2,000
                                                                                                                                        FCF Yield               11 - 22%          22 - 33%          33 - 44%
For sensitivity capital and basis assumptions and definition of free cash flow please see 5 year plan slide. Strip as of Oct 27th 2020. Subject to Jupiter close.
25
                                                                                Tourmaline Financial Position
                                                                                Excellent Liquidity, Resiliency & Capacity                                                                Nov 2020
 Tourmaline has ample liquidity and capacity to weather adverse commodity prices
                       Debt Profile & Cash Flow Sensitivities                                                              Credit Facility & Term Loan Covenants
                            Debt Profile, Term, Capacity                                                         Total Debt / Total Capitalization must not exceed 0.6x
 $mm                                                                                                       $mm                                                                     0.6x
            2,875         >$1bn          2,875         2,875          2,825     2,825    2,825            12,000                                                                                0.6x
3,000
                         Undrawn
2,500                    Capacity                                                                         10,000                                                       3x Debt Capacity         0.5x
                                                                                                           8,000                                                           Increase             0.4x
2,000                       1,619                           Unsecured, covenant debt,                                                                                  (Equity Held Flat)
1,500                                                           matures in 5 years                         6,000                                        0.2x                                    0.3x
                                                                                                                             0.2x
1,000                                                                                                      4,000                                                                                0.2x

 500                                                                                                       2,000                                                                                0.1x

    0                                                                                                         0                                                                                 0.0x
           YE 2019      Drawn        2020     2021       2022     2023         2024                                         YE 2019               2020 Curr. Budget             Covenant
                         YE19                                                                                                 Total Debt       Total Capital    Debt to Total Capital
                Credit Facility (2024)    Term Loan (2024)    Additional Lines

                             2021 Cash Flow Sensitivities                                                              TTM EBITDA / Interest Expense must exceed 3.0x
         Change in:                                                                                         $mm
                                                                                                            1,400                                         25x                                   27x
Interest Rate -1%               $5                                    Sensitivity remains                                      22x                                                              24x
                                                                                                            1,200
                                                                         primarily to                                                                                                           21x
                                                                                                            1,000
        Oil US$1/bbl                         $18
                                                                         natural gas                                                                                                            18x
                                                                                                              800                                                     >$1bn EBITDA room         15x
                                                                                                              600                                                                               12x
           FX $0.01                                               $37                                                                                                                           9x
                                                                                                              400
                                                                                                                                                                                     3x         6x
                                                                                                              200                                                                               3x
 Gas US$0.10/Mcf                                                                              $71                  0                                                                            0x
      (NYMEX)                                                                                                                YE 2019               2020 Curr. Budget             Covenant
             $mm       $0       $10        $20        $30       $40       $50    $60    $70         $80
                                                                                                                            EBITDA         Interest Expense     EBITDA to Interest Expense

As per Tourmaline financial disclosure, and the current five year plan.
26
                                                           2020 Natural Gas Transportation
                                                           and Marketing Overview         October 2020

                                                                                                             2020 Average Natural Gas Portfolio
                                                                                                                      Diversification
                                        2020 Exit: 506 mmcf/d of gas will be to US/Other Markets
                                        2022 Exit: 620 mmcf/d of gas will be to US/Other Markets
                                        2023 Exit: 665 mmcf/d of gas will be to US/Other Markets

                                                                                                                                31%
                   Station 2
                                                                                                                                                    10%
                        10%

                                                                                                                        (1)
                                                                                                                    31%                       28%
                                                    AECO

                                                  28%
                                                              TCPL Mainline          Empress/Dawn
                                                                                     ~126 Mmcf/d

                                                                                                                                                               (2)
                                                                                                      US/Other Markets                Hedges           Stn 2          Aeco
                                            Kingsgate

                                                                                                    (1)   US/Other Markets access 24% physical markets + 7% of Nymex Basis
                           California                                   US Midwest/Other                  Differentials
                          ~300 MMcf/d                                     ~55 Mmcf/d                (2)   ~27% of Station 2 exposed at 7A/Hunt
*Average volumes
27
                                                                                                   “Tourmaline will not rapidly grow supply to increase scale,
                                                                                                   We will accretively acquire more of it”
                                                                                                                                                                                   Nov 2020

           Our strategy is to pursue gradual organic production growth of ~5% through the base EP program, but
           continuing adding scale through accretive acquisitions and ultimately own a larger proportion of supply,
           at a higher margin, with more free cash flow, than would if rapidly drilling our own inventory
           • Proforma recent acquisitions TOU remains the largest Canadian natural gas producer and from a
               market share perspective represents:
                 • ~11% of current WCSB Receipts
                 • ~25% of 2H 2020 Canadian gas rig count
                 • ~20% of WCSB gas adds to date                                      Our Market Share Focus
                 • ~50% of Aggregate 2021 Free Cash Flow generated by WCSB Natural Gas E&P peers(1)
                   Canadian Gas Drilling Rigs(2)                                          Bcf/d                  WCSB Receipts(2)                  $mm
                                                                                                                                                          2021 Peer Gas E&P FCF(1)
                                                                                            19                                                     $900
           250               Less drilling leads to…                                                  … Less overall supply which leads to…                       … Higher free cash flow,
                                                                                                                                                   $800         particularly for those with the
                                                                                            18
           200                                                                                                                                     $700               lowest supply cost
                                                                                            17                                                     $600
           150                                                                                                                                     $500
(# rigs)

                                                                                            16
                                                                                                                                                   $400
           100
                                                                                            15                                                     $300

            50                                                                                                                                     $200
                                                                                            14
                                                                                                                                                   $100
             0                                                                              13                                                      $0
                                                                        Oct
                                                                              Nov
                 Jan

                                   Apr

                                                                  Sep
                       Feb

                                         May
                             Mar

                                                                                    Dec
                                                           Aug
                                               Jun
                                                     Jul

                                                                                                 Jan Feb Mar Apr May Jun Jul Aug Sep Oct Nov Dec          TOU            Canadian Peers(1)

                                                                                                          2017       2018     2019      2020                While growing organically at ~5% CAGR,
             2015–19 range                     2020              5-yr avg            2019                                                                    TOU will generate >$3bn in Free Cash
 1. TOU as per guidance, peers as per Bloomberg consensus October 26, 2020; WCSB Nat Gas peers AAV, ARX, BIR, KEL, PEY, POU, VII
                                                                                                                                                                   Flow over the next 5 years
 2. Charts Sourced to: Peters & Co. and Desjardin
APPENDIX
29
                                                                                 Historical EP Performance
                                                                                                                                                                                    Mar 2020
                                             Production Growth Per Share*                                                                     Reserves Growth Per Share*
                                  500                                                                                             10
 Production per Thousand Shares

                                                                                                      Reserves per Share (BOEs)
                                  400                                                                                              8

                                  300                                                                                              6
             (BOEs)

                                  200                                                                                              4

                                  100                                                                                              2

                                    0                                                                                              0
                                        2009 2010 2011 2012 2013 2014 2015 2016 2017 2018 2019                                         2009 2010 2011 2012 2013 2014 2015 2016 2017 2018 2019

                                                       Op Costs/BOE                                                                                   Cash Flow Per Share
                      $7.00                                                                                                       $6.00

                                                                                                 Cash Flow per Share ($)
                                                                                                                                  $5.00
                      $6.00
                                                                                                                                  $4.00
                      $5.00                                                                                                       $3.00
                                                                                                                                  $2.00
                      $4.00
                                                                                                                                  $1.00
                      $3.00                                                                                                       $0.00
                                        2009 2010 2011 2012 2013 2014 2015 2016 2017 2018 2019                                            2009 2010 2011 2012 2013 2014 2015 2016 2017 2018 2019

• 2010-2019 Production growth per share CAGR of 28%.                                             • 2P Reserve Value of $15.1 billion after 11 years.
• Lowest capital costs and low cash costs allow Tourmaline to grow profitably on a full cycle basis at natural gas prices above CAD$1.80/mcf.
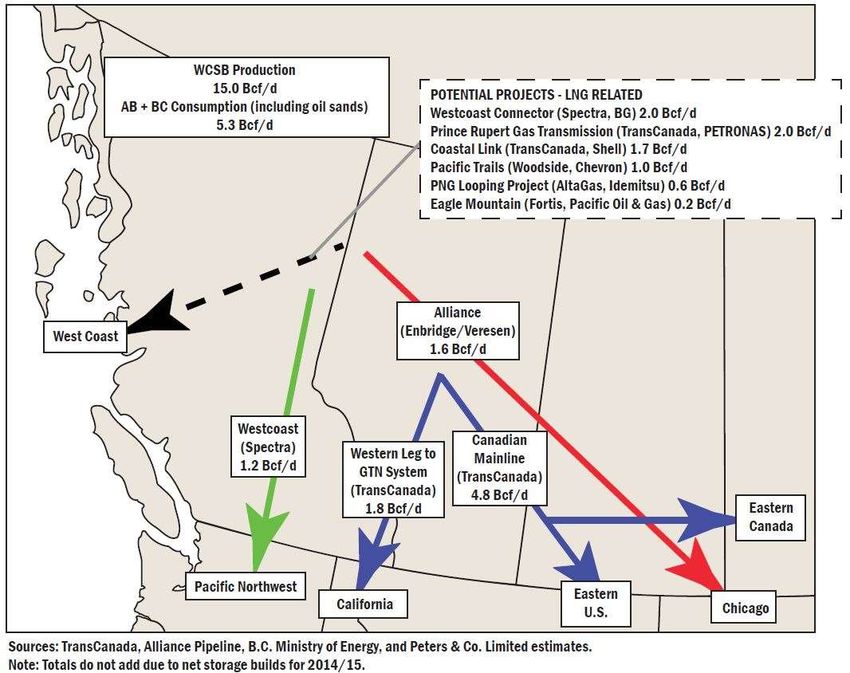
                                                                                                                                                                                     * Debt adjusted
30

Natural Gas Flows From Western Canada
31

                                                       Independently Recognized Canadian 2P Reserves(1)
                                                                                                                                                    Mar 2020
                                                                   14.00

                                                                   12.00
                                                                                                             Natural Gas
 Tourmaline has booked only 15% of                                                                              Natural Gas (1)
                                                                   10.00
 existing drilling inventory (2,305 of
 14,919 locations – See Schedule A).                                8.00

                                                             TCF
                                                                    6.00

                                                                    4.00

        1400                                                        2.00

        1200                       Conventional                     0.00
                                   Oil & Liquids                           TOU Peer Peer Peer Peer Peer Peer Peer Peer Peer Peer Peer Peer Peer Peer Peer
                                                                                1    2    3    4    5    6    7    8    9    10   11   12   13   14   15
        1000

        800                                                                                              Tourmaline has historically converted
MMboe

                                                                                                         2P reserves to PDP reserves in
        600
                                                                                                         approximately 4 - 5 years. YE 2019
                                                                                                         2P reserves are 2.6 billion boe.
        400

        200

                                                                                                       (1) Based on Canadian Reserves from public information. Peers
          0                                                                                            include Advantage, ARC, Birchcliff, Bonavista, CNRL, Crescent
               Peer Peer Peer Peer TOU Peer Peer Peer Peer Peer Peer Peer Peer Peer Peer Peer          Point, Crew, EnCana, Kelt, NuVista, Painted Pony, Paramount,
                3    1    14   7        15   9    5    13   10   4    11   6    12   2    8            Peyto, Seven Generations and Whitecap.
32
                                       EP Growth Plan
                                       (Original Business Plan)
                                                                                           Sep 2008

This is essentially the same business plan that was executed for Duvernay Oil Corp. (2001-2008)

    •       Primary growth mechanism will be a conventional EP Program (including
            Resource plays).

    •       Build 2-3 core EP areas during initial three years of operations.

    •       Strive for large land positions, operatorship and infrastructure control in
            those core areas.

    •       Achieve profitable annual growth via low operating cost/high netback
            properties.

    •       Operate with a relatively small, technically strong staff.

    •       Dispose of non-core assets on a continuous basis, as appropriate.
33
                                                       Alberta Deep Basin
                                                       Liquids Rich Cardium Fairway
                                                                                                                                                          Nov 2019

Only the initial Cardium delineation          16-20-50-22W5 PAD (2 Hztl)                6-1-51-23W5 PAD (2 Hztl)                    12-36-50-23W5 PAD (1 Hztl)
locations are depicted, the potential     IP 90 – 16.8 mmcfpd                     IP 90 – 21.7 mmcfpd                          IP 90 – 15 mmcfpd
location inventory is significantly       CR - 10.5 mmcfpd, 184 bbls/d            CR - 7.6 mmcfpd, 80 bbls/d                   CR - 4.5 mmcfpd, 60 bbls/d
larger. Note that each depicted
                                          CUM – 3.1 bcf, 72.6 mbbls               CUM – 6.3 bcf, 120.5 mbbls                   CUM – 7.4 bcf, 204 mbbls
surface location represents two hz
                                          EUR – 14.5 bcf, 305 mbbls               EUR – 18.0 bcf, 255 mbbls                    EUR – 13.0 bcf, 296 mbbls
wells (hanging wall/footwall)

                                                       16-30-50-22W5 PAD (1 Hztl)
T59                                                      T59                                           R.24      R.23                 R.22          R.21 Cardium Drilled Wells
                                                                                                                                                Tourmaline
                                                  IP 90 – 8.2 mmcfpd                                                                                                       T52
        Smoky                                                                                                                                   Tourmaline 2019 Cardium Wells
                                                  CR - 2.9 mmcfpd, 70 bbls/d
                                                                                                                                                Tourmaline Cardium Locations
T57
                                                  CUM –T57
                                                         1.1 bcf, 34.6 mbbls
                                                  EUR – 4.3 bcf, 120 mbbls
                                                                                                                                                                           T51
T55                                                       T55
                          Cabin
                          Creek
                                                           T53                                                                                                             T50

                                                                             7-11-51-23W5 PAD (1 Hztl)
                                              Anderson
          R3       R1W6
                                                                       102/2-11 - 11.3 mmcfpd, 120 bbls/d
                                                                       15-10 – 24.1 mmcfpd, 724 bbls/d
                                                                                                                                                                           T49
                                                                       120 hour Average Test Rate Sept. 2019
 ANDERSON DEVELOPMENT 12 Wells                                                         T49

   CR - 86 mmcfpd, 2033 bbls/d
                                                                                                                  10-25-50-23W5 PAD (1 Vert, + 1 Hztl)
   CUM – 44.7 BCF, 1.01 mmbbls                                                                       T47
                                                                                                              IP 90 – 28.5 mmcfpd,
   EUR – 123.0 BCF, 2.53 mmbbls                                                                               CR - 14.5 mmcfpd, 185 bbls/d
                                                                                                     T45
                                                                                                              CUM – 13.5 bcf, 251 mbbls
  The combination of extensive 3D seismic coverage and the
                                                                                                              EUR – 28.0 bcf, 474 mbbls
  lowest cost drilling/completion capability make the liquids
  rich Cardium play a significant new incremental                                                     T43
                                                                                                                 Tourmaline Lands
  opportunity in the overall Tourmaline Deep Basin portfolio.                           Stolberg                 Liquids Rich Cardium Fairway

                                        R24      R22             R20   R18       R16           R14               Cardium Faults
                                  R26
34

                                                                                 Evolving into Canada’s Largest Montney Producer
                                                                                                                                                                                                       Mar 2020

 Tourmaline to become the largest Montney producer through fully delineated assets that are economic on current strip.
 Tourmaline is already the largest Alberta Deep Basin producer (175,000 boepd).

 Mboe/d
                    Tourmaline Montney                                                                                   BC and Alberta Montney Peers
  300
                                                                285
                                        Sundown Full
  250                                   Development

                         Conroy Development with
                           Infrastructure Buildout                                        206        205
  200                                           190
                                                                                                                182
                                                            Gundy Ph2
                                155                                                                              47
  150                                      BC Acquisitions (2020 to date)                                                    140
                130                        Gundy A-12-I Facility

                                                                                                                             57         110
  100
                                                                                                                                                    15          83         83
                                                                                                                                                                                         65   62
                                                                                                                 135
              Current                                                                                                                                                                         10      51      47
    50                                                                                                                                                                                   20
               Base                                                                                                                                                                                    3      5
                                                                                                                             83                     81
                                                                                                                                                                                         45   52      48      42

      0
            2020 Exit       2021 Exit       2022 Exit       2023-25+                    Peer 1     Peer 2      Peer 3      Peer 4     Peer 5      Peer 6      Peer 7     Peer 8      Peer 9 Peer 10 Peer 11 Peer 12

     Tourmaline growth projections include development of                                                                Current          Announced Expansions (2020-2025)
   existing assets, all are fully delineated and are economic /
   full cycle profitable on current strip pricing. This analysis
     excludes Red Creek / Attachie, Noel, Tupper, new pool
        delineation, and potential additional acquisitions.
Acquisition volumes subject to close. Peer data as per most recent disclosure; Accumap, GS research. Expansions include publicly announced growth, and/or 2020 budgeted volume growth.
Peers include AAV, ARX, BIR, CNQ, Mitsubishi (Diamond Gas), MUR, NVA, OVV, Petronas JV, PONY, Shell Canada, VII
35

                                      Gundy Creek Phase 1 – Deep Cut Plant
                                                                                                                May 2019

Plant Start-up in May 2019, constructed in 6 months, 200 mmcfpd/13,500 bpd capacity, on budget and ahead of schedule
Tourmaline Montney                                                                                                              36

                                                                                       Efficiency + Execution
                                                                                                                                                                                                        May 2020

                                                                                    Montney Net Production (MMcfe/d)
        1,400
        1,200
        1,000
          800
          600
          400
          200
            0

                                                                                                                                                          Source: Goldman Sachs (2019A) except for Tourmaline (2020 Exit)
                                                                                                   Select Montney Peers
                                                                       ARC Resources, Birchcliff, Ovintiv, NuVista, Painted Pony, Paramount & Seven Generations

               Corporate 2020E D/CF(1)                                                           Montney D&C Costs ($MM)                                     Montney Op Costs per BOE
    10.0x                                                                           $12.00                                                             $10.00
     9.0x                                                                                                                                               $9.00
                                                                                    $10.00                                                              $8.00
     8.0x
     7.0x                                                                                                                                               $7.00
                                                                                     $8.00
     6.0x                                                                                                                                               $6.00
     5.0x                                                                            $6.00                                                              $5.00
     4.0x                                                                                                                                               $4.00
                                                                                     $4.00                                                              $3.00
     3.0x
     2.0x                                                                                                                                               $2.00
                                                                                     $2.00
     1.0x                                                                                                                                               $1.00
     0.0x                                                                               $-                                                                 $-

         Source: All data Peters & Co except for PONY (Street Consensus)                                  Source: Publicly Available Information                         Source: Publicly Available Information
                                                                                                                                                                         Ovintiv Operating costs converted to CAD + $0.80
(1) See “Non-GAAP Measures” in Forward Looking Statement Advisories.                                                                                                     incremental cost per MCF for processing
37

                             Tourmaline Environmental Performance

•   Tourmaline strives to continually improve all aspects of environmental performance including the
    impact of its operations on air, land and water.

•   Tourmaline ranks as a ‘top decile’ performer under the new Ab Government carbon emission
    framework and despite the Company’s size and extensive facility capacity has zero ‘large emitter’
    sites.

•   Tourmaline is Canada’s largest natural gas producer, by far the ‘cleanest’ of the fossil fuel group,
    and has constructed a network of new, state of the art facilities to process and transport this gas.

•   Tourmaline is at the forefront of multi-well pad drilling in Western Canada, dramatically reducing
    the surface impact of full cycle resource play development in all three core operated areas.

•   Tourmaline has dramatically reduced CO2 and CH4 emissions by conducting all well testing in-line ,
    utilizing low emission controllers, employing waste heat recovery.

•   Tourmaline is steadily expanding the use of CNG for drilling operations, reducing diesel usage.

•   Tourmaline is an industry leader in non-potable frac water sourcing with six frac water
    source/recycling facilities (>450,000 m3 capacity) avoiding the use of fresh water in frac
    operations. Tourmaline is one of the first operators in B.C to utilize produced water in frac
    operations and is the first company in Alberta to employ this practice.
38

                                                                                    Sustainability Performance Highlights
                                                                                                                                                        Feb 2020
  Tourmaline has been aggressively and successfully pursuing a comprehensive environmental performance
  improvement strategy for over six years. The Company is systematically improving its performance and reducing the
  impact of all aspects of the Company’s activities upon air, land and water.

      Achievements                                     • 46% reduction in CO2 emission intensity since 2013

                                   +254%
                                                       • Near elimination of fresh water use in NEBC well stimulation operations
                                   Production
                                                       • Initiation of methane reduction retrofit compliance plan in 2019; 3,400 controllers replaced
                                                       • A 50% reduction in the surface area per producing well in the Company’s operating areas
                                    -46%
                                      C02
                                                       • Broad replacement of diesel in Tourmaline’s drilling and completion operations with natural gas
     ‘13                    ‘18

                 Targets
                                                       • Targeting a 25% reduction in total methane emissions from 2018 levels by 2023

                     -25%
                                                       • Reduce corporate emissions intensity by 25% by 2027(1), through the application of new, innovative
                    Methane                              technologies including the electrification of assets
                    Emissions
                     by 2023                           • Targeting elimination of fresh water usage in well stimulation operations (NEBC ✓)
           ‘18                      ‘23

            Initiatives
                                                       • Trial full electric (zero diesel) drilling rig in the Peace River High complex in 1H/2020
                 Work Towards                          • Migrate completion fleet to natural gas turbine technology

           0
                   Diesel rigs in PRH
                   Diesel Turbines                     • Migrate all field operations towards low bleed, zero venting three phase technology devices that
                   Venting in field ops                  reduces fugitive methane emissions

(1) Scope 1, using 2018 as a baseline. See 2019 sustainability report for details
Continuous Environmental Performance Improvement 39
                                    Through Innovative Application of New Technologies

•   Massive reduction in flaring

•   Water recycling for fracs                                     Tech Service

•   Gas fired drilling rigs/fracs

•   Methane leakage elimination across all
    operating regimes

                                                         •   COSIA & NGIF industry technology
                                                             development alliances

                                                         •   Surface footprint reduction/pad drilling

                                                         •   Widespread electrification.
Basic Research
                                                         •   Multiple CO2 mitigation strategies/CCS

                                                         •   Smart pipelines/wellsites

                                CANADIAN OIL & GAS IS THE WORLD LEADER
Tourmaline Environmental Performance                                       40

                                             Improvement Highlights
                                                                                                                June 2019
                  BC Water Management                                           Alberta Water Management

 • 95-100% of all water sourced for stimulation operations is    • 1st, and only, company in Alberta to be licenced to store
   recycled                                                        and recycle produced water from an in-ground storage pit
 • 100% of all water flowed back from completion operations is   • 50-75% of water sourced for stimulation operations is
   recycled                                                        recycled and is growing

         Drilling/Completion Emissions Reductions                             Methane Emissions Reduction

• 30% lower CO2, 75% lower Nox, 99%                               • 487 Tonnes of methane removed due
  lower SOx emissions                                               to modifications to facility controls on
• 90% lower particulate emissions                                   our dehys/refridge units
• Drilling Rigs achieving ~60-70%                                 • 326 controllers replaced to low
  displacement of diesel                                            emission models NOTE: Program
                                                                    continues in 2019 to inventory all
                                                                    natural gas pneumatic controllers
                                                                  • In 2019 waste heat recovery
                                                                    technology was incorporated into our
                                                                    plant design
41
                                     Tourmaline Technology Curve/Future
                                     Concepts, Requirements & Opportunities
                                                                • Cost saving via novel frac water sourcing/recycling
                                                                  • New Waste heat recovery technology
                      • Alternative hz frac programs/processes
                        – Concurrent pairs, delayed flow-backs etc.
                    • Novel drilling technology to reduce time/cost              • Utilizing gas fired turbines to reduce
                      in drilling builds                                           costs for drilling, completions, facilities
                • Refine drilling techniques/cost savings for            • New mud systems to reduce drilling times
                  frontal foothills Wilrich/Notikewin hz drlg
                                                                      • Improved horizontal stimulation techniques, new
                • Ball drop/sliding sleeve completion technique         approaches to maximize deliverability and
                  in vertical wells                                     recovery
                                                                 • Sour frac water sweetening technology
                                                             • Develop predictive reservoir/reserve tools
                                                               for horizontal clastic gas wells

                                                        • Improved Wilrich seismic imaging in strat
• Understanding controls on Wilrich                       settings and Outer Foothills settings
  deliverability/develop predictive tools
                                                • Paleozoic/New Deep Play concepts
• New shale/source rock plays
                                            • AI applications in geophysical interpretation, reservoir
                                              prediction and predictive drilling problem identification.
• Pasquia Hills oil shale recovery
  mechanisms
42

                                                                         Schedule A

                                                       DRILLING LOCATIONS

Estimated Drilling Inventory
This presentation discloses drilling locations in four categories: (i) proved undeveloped locations; (ii) probable undeveloped
locations; (iii) unbooked locations; and (iv) an aggregate total of (i), (ii) and (iii). Of the 14,919 (gross) locations disclosed in this
presentation, 1,208 are proved undeveloped locations, 39 are proved non-producing locations, 1,058 are probable undeveloped
locations, 0 are probable non-producing and 12,614 are unbooked. Proved producing wells, proved undeveloped locations,
proved non-producing locations, probable undeveloped locations and probable non-producing locations are booked and derived
from the Company's most recent independent reserves evaluation as prepared by GLJ and Deloitte LLP as of December 31, 2019
and account for drilling locations that have associated proved and/or probable reserves, as applicable. Unbooked locations are
internal estimates based on the Company's prospective acreage and an assumption as to the number of wells that can be drilled
per section based on industry practice and internal review. Unbooked locations do not have attributed reserves or resources
(including contingent and prospective). Unbooked locations have been identified by management as an estimation of the
Company's multi-year drilling activities based on evaluation of applicable geologic, seismic, engineering, production and
reserves information. There is no certainty that the Company will drill all unbooked drilling locations and if drilled there is no
certainty that such locations will result in additional oil and gas reserves, resources or production. The drilling locations on
which the Company will actually drill wells, including the number and timing thereof is ultimately dependent upon the
availability of funding, regulatory approvals, seasonal restrictions, oil and natural gas prices, costs, actual drilling results,
additional reservoir information that is obtained and other factors. While a certain number of the unbooked drilling locations
have been derisked by drilling existing wells in relative close proximity to such unbooked drilling locations, the majority of other
unbooked drilling locations are farther away from existing wells where management has less information about the
characteristics of the reservoir and therefore there is more uncertainty whether wells will be drilled in such locations and if
drilled there is more uncertainty that such wells will result in additional oil and gas reserves, resources or production.

The following provides additional information on the Company's estimation of unbooked locations.
43

                                             Schedule A continued

Deep Basin Vertical well count :
Approximately 2,499 gross prospective sections at approximately 1.5 wells per section minus 10% for areas
that are inaccessible or limited by spacing requirements minus approximately 1,000 existing wells. Includes
450 locations in the Outer Foothills area.
Total Vertical Locations ~ 2,373

Deep Basin Horizontal well count :
Approximately 2,499 gross prospective sections in the Deep Basin at approximately 3 wells per section in
multiple horizons i.e. the Wilrich, Falher, Notikewin, Cardium, Dunvegan, Viking, Bluesky, Gething,
Cadomin, or Nikanassin. Less existing horizontals, less 20% of existing vertical producers. In some instances
there will be less than 3 wells per section at full development and in other cases there will be more than 3.5
wells per section due to the fact that there are multiple horizons. Total Horizontal Locations ~ 6,491

NE BC Well count :
Approx. 450 gross sections in NE BC at 12-16 wells per sections in multiple lobes (2-5 depending upon
location) in the West Montney yielding 3,763 locations and approximately 3 wells per section in the East
Montney yielding 465 locations.
TOTAL NE BC = 4,228 locations

Spirit River well count:
602 gross sections within the Charlie Lake/Montney Fairway x 2-4 wells per section = 2,188 wells
Minus approximately 362 existing wells
Total Spirit River ~ 1,826 wells

Total gross locations ~ 14,919
44

                                                                         Schedule B

Prospective locations are unbooked locations that are not included in inventory. Unbooked locations are internal estimates based
on the Company's prospective acreage and an assumption as to the number of wells that can be drilled per section based on
industry practice and internal review. Unbooked locations do not have attributed reserves or resources (including contingent and
prospective). Unbooked locations have been identified by management as an estimation of the Company's multi-year drilling
activities based on evaluation of applicable geologic, seismic, engineering, production and reserves information. There is no
certainty that the Company will drill all unbooked drilling locations and if drilled there is no certainty that such locations will
result in additional oil and gas reserves, resources or production. The drilling locations on which the Company will actually drill
wells, including the number and timing thereof is ultimately dependent upon the availability of funding, regulatory approvals,
seasonal restrictions, oil and natural gas prices, costs, actual drilling results, additional reservoir information that is obtained and
other factors. While certain of the unbooked drilling locations have been derisked by drilling existing wells in relative close
proximity to such unbooked drilling locations, the majority of other unbooked drilling locations are farther away from existing
wells where management has less information about the characteristics of the reservoir and therefore there is more uncertainty
whether wells will be drilled in such locations and if drilled there is more uncertainty that such wells will result in additional oil
and gas reserves, resources or production.
45

                                              Forward Looking Information

Certain information contained in this presentation constitutes forward-looking information within the meaning of applicable securities laws.
This information relates to future events or the Company's future performance. All information other than information of historical fact is
forward-looking information. The use of any of the words "anticipate", "plan", "contemplate", "continue", "estimate", "expect", "intend",
"propose", "might", "may", "will", "shall", "project", "should", "could", "would", "believe", "predict", "forecast", "pursue",
"potential" and "capable" and similar expressions are intended to identify forward-looking information. This information involves known
and unknown risks, uncertainties and other factors that may cause actual results or events to differ materially from those anticipated in such
forward-looking information. No assurance can be given that these expectations will prove to be correct and such forward-looking
information should not be unduly relied upon. This information speaks only as of the date of this presentation or, if applicable, as of the date
specified in those documents specifically referenced herein. In addition, this presentation may contain forward-looking information
attributed to third-party sources.

Without limitation of the foregoing, this presentation contains forward-looking information pertaining to the following: the reserve potential
of the Company's assets; the anticipated production from the Company's assets and anticipated future cash flows from such assets; the
Company's growth strategy and opportunities; the Company's capital exploration and development programs and future capital
requirements; the estimated quantity and value of the Company's proved and probable reserves; expectations regarding the ability to raise
capital and to continually add to reserves; the Company's estimates of future interest and foreign exchange rates; the Company's
environmental considerations; the Company's assumptions regarding commodity prices; the Company's expectations regarding reduction in
its operating costs; the timing of commencement of certain of the Company's operations and the level of production anticipated by the
Company; the potential for production disruption and constraints; supply and demand fundamentals for crude oil and natural gas; the
Company's access to adequate pipeline and other gathering, transportation and processing capacity; the Company's access to third-party
infrastructure; the Company's drilling and recompletion plans; the Company's expected capital expenditures; expected debt levels and
credit facilities; industry conditions pertaining to the oil and gas industry; the Company's plans for, and results of, exploration and
development activities; the planned construction of the Company's gathering, transportation and processing facilities and related
infrastructure; the timing for receipt of regulatory approvals; the Company's treatment under governmental regulatory regimes and tax
laws and potential changes in such regimes and laws; the Company's future general and administrative expenses; and the Company's
expectations regarding having adequate human resource staffing.
46

                                           Forward Looking Information

With respect to forward-looking information contained in this presentation, assumptions have been made regarding, among other things:
future crude oil and natural gas prices; future interests rates and currency exchange rates; the Company's ability to obtain qualified staff
and equipment in a timely and cost–efficient manner; the regulatory framework governing royalties, taxes and environmental matters; the
Company's ability to market production of oil and natural gas successfully; the Company's future production levels; the applicability of
technologies for recovery and production of the Company's reserves; the recoverability of the Company's reserves; future capital
expenditures to be made by the Company; future cash flows from production meeting the expectations stated in this presentation; future
sources of funding for the Company's capital program; the Company's future debt levels; geological and engineering estimates in respect of
the Company's reserves; the geography of the areas in which the Company is conducting exploration and development activities; the impact
of competition on the Company; and the Company's ability to obtain financing on acceptable terms.

Actual results could differ materially from those anticipated in this forward-looking information as a result of a number of factors including
the risk factors set forth in the Company's reports and documents on file with Canadian securities regulatory authorities at www.sedar.com
or the Company's website at www.tourmalineoil.com, which risk factors should not be construed as exhaustive. See specifically "Forward-
Looking Statements" and "Risk Factors" in the Company's most recently filed Annual Information Form and "Forward-Looking
Statements" in the Company's most recently filed Management's Discussion and Analysis.

Included in this presentation are estimates of the Company's 2020-2025 cash flow and cash flow per share which are based on various
assumptions as to production levels, commodity prices and other assumptions and in the case of the years other than 2020 & 2021 are
provided for illustration only and are based on budgets and forecasts that have not been finalized and are subject to a variety of
contingencies including prior years' results. To the extent such estimates constitute a financial outlook, they were approved by management
of the Company in November 2020 and are included to provide readers with an understanding of the Company's anticipated cash flow based
on the capital expenditures and other assumptions described and readers are cautioned that the information may not be appropriate for
other purposes.

In addition, information relating to "reserves" is deemed to be forward-looking information, as it involves the implied assessment, based on
certain estimates and assumptions, that the reserves described exist in the quantities predicted or estimated, and that the reserves described
can be profitably produced in the future. See also "Statement of Reserves Data and Other Oil and Gas Information" and "Certain Reserves
Data Information" in the Company's Annual Information Form.

Readers are cautioned not to place undue reliance on this forward-looking information, which is given as of the date it is expressed herein or
otherwise and the Company undertakes no obligation to update publicly or revise any forward-looking information, whether as a result of
new information, future events or otherwise, unless specifically required to do so pursuant to applicable law.
You can also read