Corporate Presentation PEA Results, January, 2020
←
→
Page content transcription
If your browser does not render page correctly, please read the page content below
Corporate Presentation PEA Results, January, 2020
DISCLAIMER

This presentation (in this projected form and as verbally presented) (Presentation) is provided on the basis that neither Generation Mining Limited (Gen
Mining), nor its officers, shareholders, related bodies corporate, partners, affiliates, employees, representatives and advisors make any representation or
warranty (express or implied) as to the origin, validity, accuracy, reliability, relevance, currency or completeness of the material contained in the
Presentation and no responsibility is taken for any errors or omissions. Nothing contained in the Presentation is, or may be relied upon as, a promise,
representation or warranty, whether as to the past or the future.
Gen Mining excludes all warranties (including implied warranties) and all liability that can be excluded by law for any loss, claim, damage, cost or
expense of any nature (including that arising from negligence) arising out of the Presentation (or any accompanying or other information) whatsoever,
nor by reason of any reliance upon it. Gen Mining accepts no responsibility to update any person regarding any inaccuracy, omission or change in
information in this Presentation or any other information made available to a person or any obligation to furnish the person with any further information.
The Presentation contains "forward-looking statements". Where the Presentation expresses or implies an expectation or belief as to future events or
results, such expectation or belief is expressed in good faith and is believed to have a reasonable basis. However, forward-looking statements are
subject to risks, uncertainties and other factors, which could cause actual results to differ materially from future results expressed, projected or implied
by such forward looking statements. Such risks include, but are not limited to, price volatility, currency fluctuations, increased production costs and
variances in ore grade, recovery rates or other matters from those assumed in mining plans, as well as political and operational risks and governmental
regulation and judicial outcomes. Gen Mining does not undertake any obligation to release publicly any revisions to any "forward-looking statement" to
reflect events or circumstances after the date of the Presentation, or to reflect the occurrence of unanticipated events, except as may be required under
applicable securities laws. Statements relating to reserve and resource estimates are expressions of judgment, based on knowledge and experience
and may require revision based on actual production experience.
Such estimates are necessarily imprecise and depend to some extent on statistical inferences and other assumptions, such as metal prices, cut-off
grades and operating costs, which may prove to be inaccurate. Information provided relating to projected costs, capital expenditure, production profiles
and timelines are expressions of judgment only and no assurances can be given that actual costs, production profiles or timelines will not differ
materially from the estimates contained in this Presentation.
All persons should seek appropriate professional advice in reviewing or considering the Presentation and all other information with respect to Gen
Mining and evaluating the business, financial performance and operations of Gen Mining. Neither the provision of the Presentation nor any information
contained in the Presentation or subsequently communicated to any person in connection with the Presentation is, or should be taken as, constituting
the giving of investment or financial product advice to any person in respect of dealing in Gen Mining securities, and no such information should be
taken to constitute a recommendation or statement of opinion that is intended to influence a person in making a decision to deal in Gen Mining
securities.
This Presentation does not purport to contain all of the information that may be required to evaluate all of the factors that would be relevant in
determining whether to deal in Gen Mining securities, including but not limited to any person's objectives, financial situation or needs. Each person must
not rely on the information provided but should make, and will be taken to have made, its own investigation, assessment and analysis of the information
in this Presentation and other matters that may be relevant to it in considering whether to deal in Gen Mining securities. Gen Mining owns the copyright
in this Presentation.
                                                                                                                                                               2
                                                                                                                                                               2
INVESTMENT HIGHLIGHTS

 PUREPLAY PGM DEVELOPER IN TIER ONE JURISDICTION

 ✓   Acquired a 51% interest in the largest undeveloped Palladium
     property in North America. Has an option to increase interest to 80%

     Independent resource calculation estimates 8.6 million ounces
 ✓   (measured and indicated) of Palladium Equivalent on the
     Marathon property, plus another 915,000 oz PdEq inferred

 ✓   Property located near excellent infrastructure, including highway,
     rail, power, and near the mining town of Marathon, ON

 ✓   Completed PEA within six months of acquiring project

 ✓   Main deposit studied in the PEA is royalty-free

                                                                            3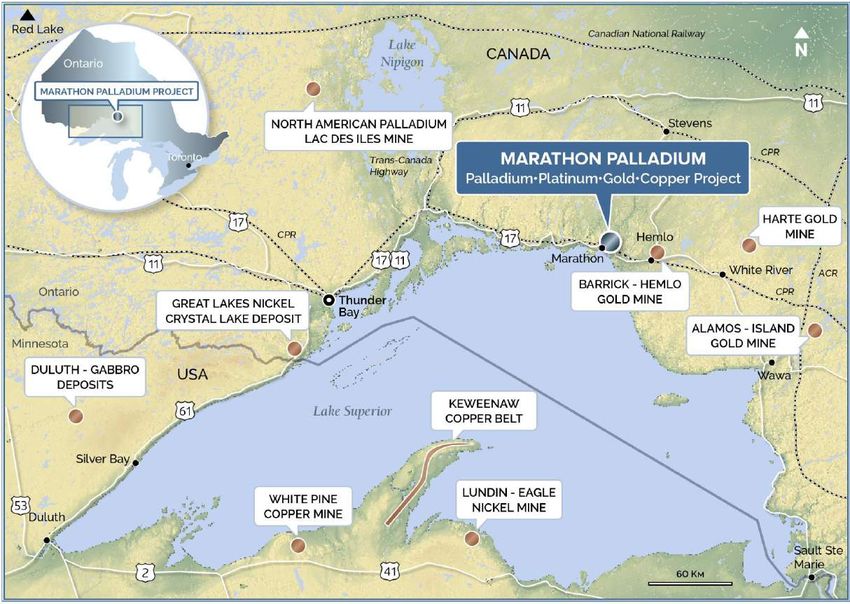
MARATHON M&I + I RESOURCES*

    3,828,000                               1,244,000                                 473,000
 oz PALLADIUM M&I                         oz PLATINUM M&I                             oz GOLD M&I

 1.02 Billion                               8,668,000                                 915,000
   lbs COPPER M&I                             oz PD EQ M&I                        oz PD EQ Inferred

* Open pit Measured, Indicated & Inferred Resources as noted, as estimated by P&E Mining Consultants, Sept 9, 2019
and Dec. 2, 2019. Further detail on page 14. Includes the Marathon, Geordie and Sally deposits.
                                                                                                                     4
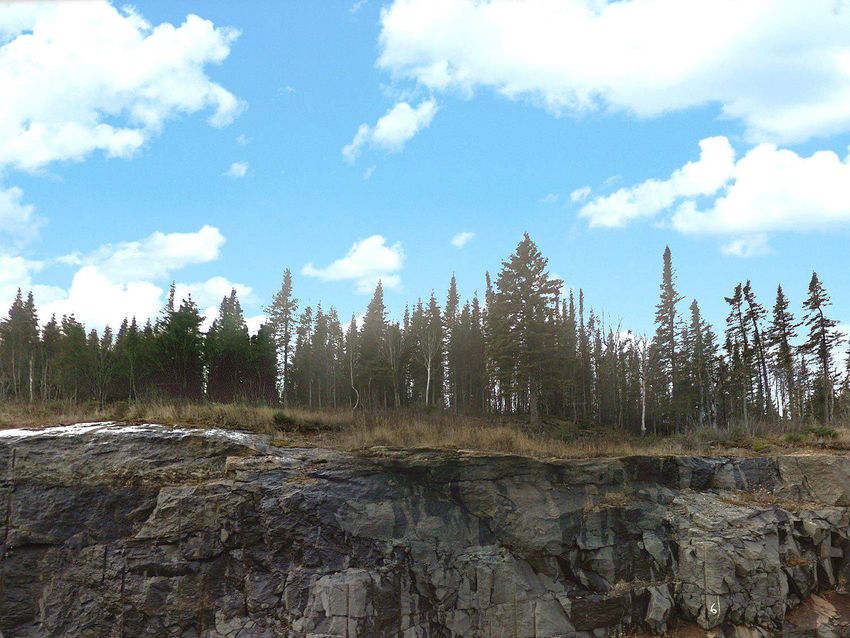
LOCATION

           5
INFRASTRUCTURE

 Located on Trans-Canada Highway,
 served by CPR main rail line
 Property next to Marathon airport
MARATHON HISTORY & OWNERSHIP

    Developed from 1985 to 2010 by various companies, eventually owned
    by Marathon PGM Corporation

    Over 203,000 metres of drilling in 1,094 holes

    Stillwater took over Marathon in 2010 for US$118 million, sold 25% to
    Mitsubishi for $US81 million in 2012

    Sibanye Gold acquired Stillwater Mining in 2017

    Generation Mining bought initial interest from Sibanye in July, 2019, can
    bring ownership to 80% by spending C$10 million in four years

    Sibanye can re-acquire additional 31% (bringing total to 51%) by paying
    31% of capex into the joint venture on production decision

*Varying royalties on remaining land package
                                                                                7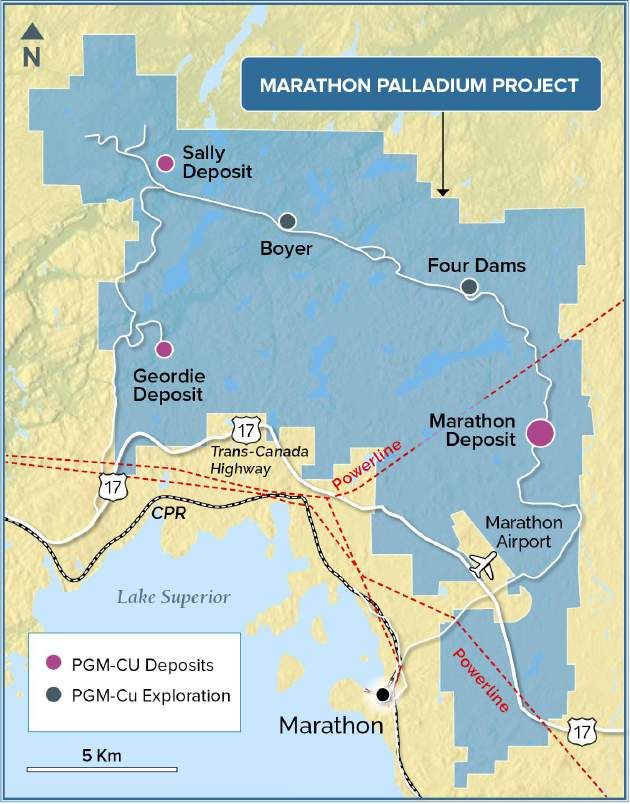
PEA HIGHLIGHTS

     ROBUST ECONOMICS IN TIER ONE JURISDICTION

 ✓   Completed PEA within six months of acquisition, including new
     resource evaluations on three deposits

 ✓   14-year mine life producing averaging 194,000 palladium
     equivalent ounces per year

 ✓   Base Case IRR of 30%, after-tax NPV of C$871 million at
     5% discount rate and 2-year trailing metal prices

 ✓    At spot price (Dec 31, 2019) IRR of 45.8% and after-tax NPV
      of $1,541 million at 5% discount rate

 ✓   AISC operating cost net of by products US$586 per ounce

                                                                     8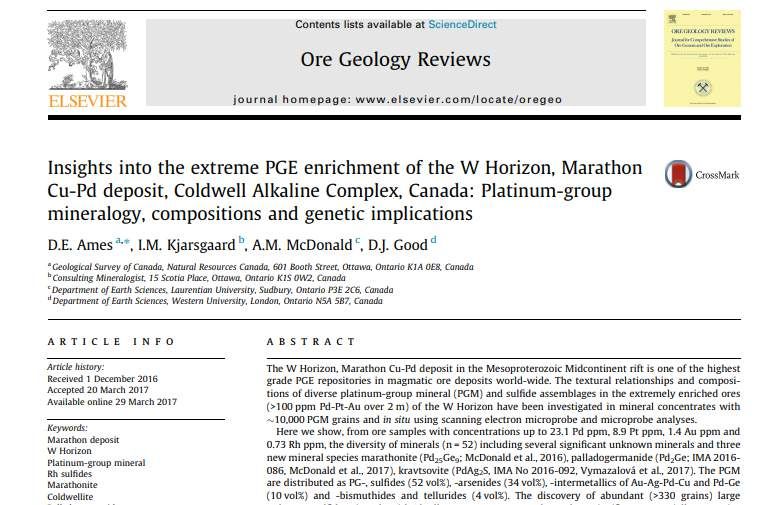
2020 MARATHON PALLADIUM PEA
(100% BASIS)

PRODUCTION                                             VALUATION (BASE CASE)

Throughput (initial)                     14,000 tpd    Pre-Tax NPV (5%)                C$1,184 million
Throughput (after expansion)             22,000 tpd    Pre-Tax IRR                                 35%
Recovered Pd Equivalent (LOM)          2,716,000 oz    After-Tax NPV (5%)                  C$871 million
Average Pd Equivalent Output/Year        194,000 oz    After-Tax NPV (8%)                  C$648 million
Avg Pd Only Output/Year*                 107,000 oz    After-Tax IRR                               30%
Palladium Equivalent Grade                  1.24 g/t
                                                       VALUATION (RECENT SPOT PRICES***)
Strip Ratio (Waste to Mill Feed)                 3:1
Mine Life                                  14 Years    After-Tax NPV (5%)              C$1,541 million
                                                       After-Tax IRR                             45.8%

COST

Preproduction Capital (C$)             C$431 million
LOM Average Cash Cost (US$)**            US$504/oz
LOM Average AISC (US$)**                 US$586/oz

* Not including byproducts
** Palladium only, net of byproducts
***Dec 31/19

                                                                                                           9
                                                                                                           9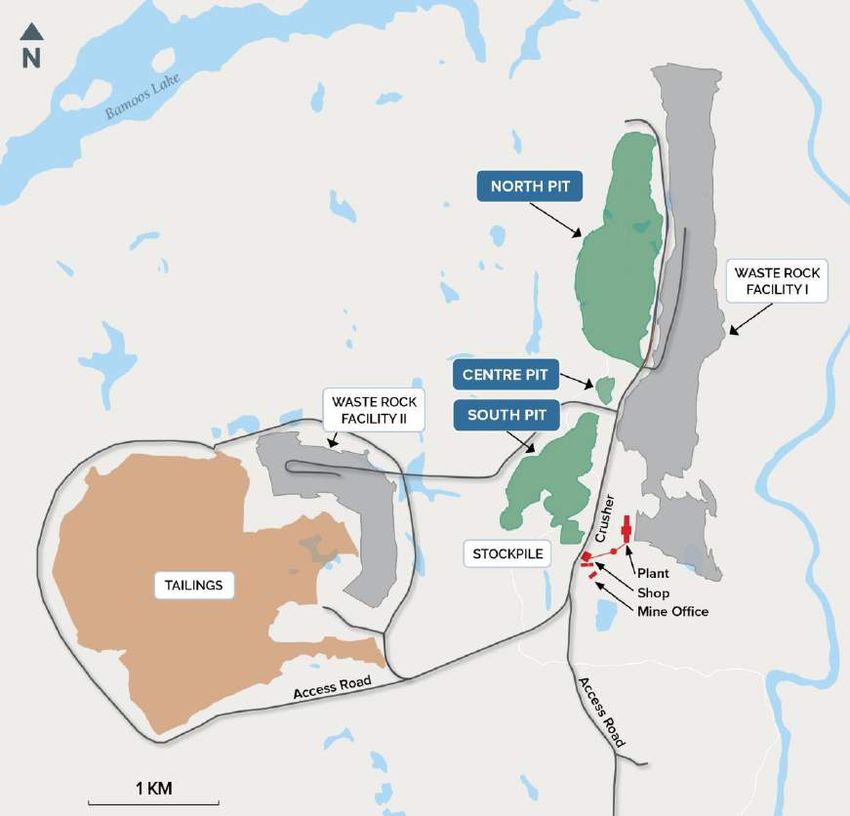
CAPEX AND OPEX

INITIAL CAPITAL COSTS ($C MILLIONS)
Pre-Stripping                           15.3
Mining                                  40.6
Processing Plant                       272.8
Tailings Management Facility            14.3
Site Infrastructure                     54.0
Contingency                             34.1
Total Initial Capital                  431.0

SUSTAINING CAPITAL ($ MILLIONS)
Mining                                 128.1
Processing Plant                        38.3
Tailings Management Facility            67.0
Closure                                 30.0
Contingency                             13.5
Total Sustaining Capital               277.0

LOM OPERATING COSTS ($C PER TONNE)
Mining Cost per tonne mined material
                                        2.34
(waste and mineralized material)
Mining Cost per tonne plant feed        9.23
Processing Cost per tonne plant feed    8.92
G & A per tonne plant feed              0.97
Total Cost per tonne plant feed        19.12
                                               10
ECONOMIC SENSITIVITIES*
SENSITIVITY TO PALLADIUM PRICE
US$/oz Pd 700 900 1,100 1,275 1,500 1,700 1,900
NPV (5% discount after-tax C$M) 255 469 684 871 1,112 1,326 1,540
IRR % 13.4 19.6 25.3 30.0 35.8 40.8 45.7
Payback (years) 6.4 4.0 2.9 2.5 2.1 1.8 1.6
IRR SENSITIVITY TO OPEX AND CAPEX AFTER-TAX (%) DISCOUNT RATE SENSITIVITY AFTER-TAX (C$M)
% -20 -10 0 +10 +20 0% 1,427
OPEX 38.1 33.7 30.0 26.9 24.3 5% 871
CAPEX 33.9 32.0 30.0 27.9 25.8 6% 790
8% 648
NPV SENSITIVITY TO OPEX AND CAPEX 10% 531
AT 5% DISCOUNT RATE AFTER-TAX (C$M)
% -20 -10 0 +10 +20
OPEX 973 922 871 820 769
CAPEX 1,048 960 871 782 694
* Presented on a 100% Ownership Basis
11MARATHON MAIN DEPOSIT
CROSS SECTION
Deposit dips
moderately west
providing optimal
open pit mining
scenario
Mineralization has
a true thickness
ranging from 4m to
183 m, averaging
35m
Deposit is open at
depth with potential
for UG expansion
from bottom of pit
Source: Miller, J.D., Smyk, M.C. and Hollings, P.N., eds. 2010. Cu-Ni-PGE deposits in mafic
intrusions of the Lake Superior region: A field trip for the 11th International Platinum Symposium;
Ontario Geological Survey, Open File Report 6254, 166p. 12
12MARATHON SITE PLAN
13
13MARATHON METALLURGICAL STUDIES
RECOVERIES TO
Several studies done at accredited labs METAL
CONCENTRATE
from 1960s - 2014
Palladium 82.9%
Initial grind to 150 microns Copper 89.7%
Float copper and PGM concentrates Platinum 74.5%
Gold 73.2%
Regrind copper to 20 microns
Silver 71.5%
Regrind PGM to 10 microns
Both concentrates refloated “Concentrate will be very low in
deleterious elements commonly
Combine to single concentrate for shipping seen in copper
No studies for 6 years - further testing may concentrate…and not expected
result in higher recoveries to draw any penalties.”
Exen Consulting, Dec, 2019
14
14PEA FUTURE OPPORTUNITIES
Only 37% of total Marathon Property Resources
were used in PEA
o Deeper Marathon Deposit resources (additional 90 million
tonnes, similar grade, higher strip ratio)
o Geordie Deposit (801,000 oz* indicated, 505,000 oz* inferred)
o Sally Deposit (767,000 oz* indicated, 389,000 oz* inferred)
Possibility of locking in higher palladium prices
with end users before construction
Additional metallurgical testwork to improve
recoveries (last work was eight years ago)
Option to sell royalty or stream – no existing royalties
Study started by Stillwater to sell waste rock as gravel --
Lafarge already doing it nearby
Many, many exploration targets – looking for higher grade
15
* Palladium equivalent 15PALLADIUM MARKET
Price has increased 350% since 2016
85% used for autocatalysts
A typical automobile uses 3-7 grams palladium
Pd loads per vehicle increasing globally by
regulation to reduce emissions*
Annual demand of -/+11 million+ ounces
6.88 million oz mined worldwide in 2018*
Further 3.21 million oz recovered from recycling*
800,000 oz deficit in 2018 according to
Johnson Matthey
1-1.5 million ounce deficit annually 2019-2021
16
*Johnson MattheyPALLADIUM MARKET
2,000
Palladium Market Price, Supply and Demand Balance Historic and Forecast
2,500
2,000 Palladium Price
1,500
1,500
Supply/Demand Balance (koz Pd)
1,000
Palladium Price ($USD)
1,000
500
0
-500
500
-1,000
-1,500
-2,000 0
A
A
2001A
2002A
2003A
2004A
2005A
2006A
2007A
2008A
2009A
2010A
2011A
2012A
2013A
2014A
2015A
2016A
2017A
2018A
2019E
2020E
2021E
2022E
17
*S&P Global Market Intelligence, Metals Focus 17PALLADIUM MARKET
New Chinese & European regulations will result Near-term production increases
in “step change” in palladium demand PRODUCTION
MINE YEAR
-- Johnson Matthey INCREASES (OZ)
Norilsk 1,000,000 2025*
Demand Inelasticity: Demand is increasing
as governments continue to focus on Platreef 200,000 2021-2
reducing emissions Eurasia 75,000 2021
*JP Morgan
Both palladium and platinum are now in
deficit – substitution by platinum would likely
cause a spike in it’s price, offsetting any gains
“We expect to see double-digit
Low substitution risk: Palladium is a more
growth in palladium consumption
effective converter than platinum.
over the 2019 – 2020 period”
Hybrid cars require more palladium than Johnson Matthey
straight ICE autos
18ADVANCED PALLADIUM PROJECTS
UPFRONT AFTER-TAX DISCOUNT PD PRICE PAYBACK PDEQ MARKET MARKET
IRR
PROJECT OWNER CAPEX NPV RATE ASSUMPTION PERIOD OZ CAP CAP/OZ
(C$) (C$M) (%) (US$/oz) (%) (Years) M,I&I M,I&I
North
In In In
Lac des Iles American $637M 8% 1,040 5M+ C$1.1B C$220
Production Production Production
Palladium
Ivanhoe $744 97M+
Platreef $1,542M 8% 825 14% 5.30 C$4.6B* C$47*
Mines (64%) (64%)
New Age
River Valley $495M $139M 5% 1,200 10% 7.00 3.9M $4.2M C$1.1
Metals
The Platinum
$1,110M $212M 19M**
Waterberg Group 8% 1,055 13% 11.40 C$143M C$15
(100%) (50%) (50%)
Project Metals
Eurasia $502M
Monchetundra $234M 8% 1,200 n/a n/a 2M+ C$170M C$85
Mining (80%)
Generation $431M $518M 7.7M***
Marathon 8% 1,275 30% 2.5 C$42M C$5.5
Mining (100%) (80%) (80%)
OTHER PROJECTS
Arctic
Capital One n/a n/a n/a n/a n/a n/a 12M+ n/a n/a
Platinum
Pedra Branca Valore n/a n/a n/a n/a n/a n/a 1.06M C$27M C$25.4
Palladium
LK n/a n/a n/a n/a n/a n/a 1.16M C$19M C$16.3
One
Source: Haywood, Company websites, Generation Mining PEA, company websites
*Ivanhoe is mainly a base metal company, includes roughly equal amounts Pd & Pt, Pt valued at $1250/oz in DFS
**reflects PGM’s 50% ownership; ***assumes 80% ownership
19COMPARABLE GOLD DEVELOPERS*
North American precious metals developers with great access to infrastructure
and capital trade at an average valuation of ~US$50/oz
Generation Mining trades at a fraction of its peers’ valuation despite holding
the largest Historic MI&I AuEq resource
$180 M&I Resource Inferred Resource EV/ AuEq MI&I Average EV/oz 6.0
$160
EV $4 PER OZ EQ 5.0
$140
AVERAGE
$120 EV/OZ: $65 4.0
Resources (Moz AuEq)
EV/oz (US$/oz AuEq)
$100
3.0
$80
$60 2.0
$40
1.0
$20
$0 0.0
OSK HRT VIT PGM SBB BGM MOZ TML MAX LGD GENM
*Company Filings, Capital IQ, Note: OSK shown as Windfall only, GENM resources on an 80% basis post financing 20GENERATION MINING TIMELINE
Key Steps for 2019
2019 EVALUATE
PURCHASE BUILD PRELIMINARY
DRILLING & POTENTIAL
MARATHON TECHNICAL ECONOMIC
EXPLORATION PRODUCTION
PROJECT TEAM ASSESSMENT
CAMPAIGN SCENARIOS
TIMELINE (ESTIMATED)
Q2 2019 Q3 2019 Q4 2019 2020
Asset Acquisition ✓
Build Technical Team ✓ ✓
Update Historic Resource ✓
Exploration ✓ ✓
PEA Study ✓ ✓
New Listing
Permitting
Feasibility Study
21MANAGEMENT
JAMIE LEVY President, CEO & Director KERRY KNOLL Exec. Chairman & Director
25 years in financing and management of Cdn mining Co-founded several successful mining companies over
companies. Was CEO of Pine Point Mining which 35 years including Wheaton River, Thompson Creek
was acquired by Osisko Metals. Formerly Vice President and Glencairn Gold. Former editor of The Northern
of Pinetree Capital. Miner Magazine.
ROD THOMAS, P.Geo. VP, Exploration & Director PATRICIA MANNARD Interim CFO & VP, Finance
Geologist with 40 years experience in Canada and abroad. Managed administrative and financial aspects of
Former Exploration Manager BHP Minerals Eastern NA and exploration companies for 30 years, including
General Manager of VM Canada (subsidiary of NEXA Res.) Pine Point Mining from 1993-2018.
JOHN MCBRIDE Senior Exploration Geologist TABATHA LABLANC Manager of Sustainability
Worked on the Company’s Marathon Project periodically 25 years of environmental & community relations, including
since 2007, and continuously as project geologist since TransCanada Pipelines, North American Palladium,
2013. He obtained an MSc. in geology from Lakehead Bowater-Abitib & oversaw the environmental assessment at
in 2010. the Marathon Project for Stillwater Canada Inc. in 2012-14.
22DIRECTORS
JAMIE LEVY President, CEO & Director KERRY KNOLL Exec. Chairman & Director
25 years in financing and management of Cdn mining Co-founded several successful mining companies over
companies. Was CEO of Pine Point Mining which 35 years including Wheaton River, Thompson Creek
was acquired by Osisko Metals. Formerly Vice President and Glencairn Gold. Former editor of The Northern
of Pinetree Capital. Miner Magazine.
ROD THOMAS, P.Geo. VP, Exploration & Director BRIAN JENNINGS Director
Geologist with 40 years experience in Canada and abroad. Chartered Accountant with extensive experience in
Former Exploration Manager BHP Minerals Eastern NA and financial management of resource companies, and
General Manager of VM Canada (subsidiary of NEXA Res.) formerly Vice-President Corporate Restructuring at
Ernst and Young.
STEPHEN REFORD Director
PHILLIP C. WALFORD Director
Geophysicist and professional engineer for 35 years,
President of Paterson, Grant & Watson Limited, Geologist, President and CEO of Marathon Gold since
an international geophysical consulting company. 2009. Was President and CEO and a founder of
Marathon PGM Corp. which sold Marathon palladium
project to Stillwater in 2010.
PAUL MURPHY Director
Chairman of Alamos Gold, was Chief Financial Officer
of Guyana Goldfields, former partner and head of mining
group for PricewaterhouseCoopers
23CORPORATE STRUCTURE
Capital Structure Key Shareholders
Shares Outstanding 93.3M Sibanye Stillwater ~12%
Warrants Zebra Holdings
28.2M ~12%
(Weighted average exercise price: C$0.34) (Lukas Lundin)
Options 7.3M Osisko Mining ~9%
(Weighted average exercise price: C$0.208)
Fully Diluted Shares Management
128.8M ~9%
Outstanding and Directors
Basic Market Rob McEwen
Capitalization C$42M ~3%
(Share price: C$0.44)
Holdings
24INVESTOR RELATIONS
JAMIE LEVY
President & CEO
jlevy@genmining.com
Phone: 416 567-2440
100 King St West, Suite 7010
Toronto, Ontario, Canada M5X 1B1
25APPENDIX
EXPLORATION UPSIDE
AND TABLES
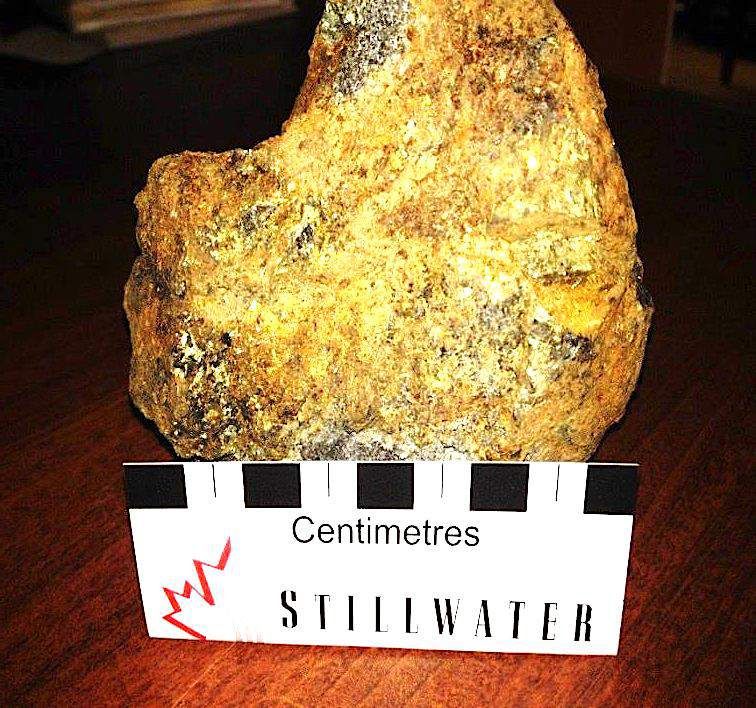
26HIGH GRADE SAMPLE FROM SALLY
Sample K008054, 188.28g/t TPGM, 9.11% Cu, 0.60% Ni, 6.4% S
27INVESTIGATION
INTO HIGH GRADE SOURCE
Ore Geology Reviews 90 (2017) 723-747
Sample K008054, 188.28g/t TPGM,
9.11% Cu, 0.60% Ni, 6.4% S
28INVESTIGATION
INTO HIGH GRADE SOURCE (2)
Conclusion
“An important aspect of this study ...
of the Marathon deposit, is that conduit-style
environments are capable of producing such extreme
PGE-enriched orebodies similar to that of Noril'sk
disseminated ores and late - stage reef deposits in
the shallow parts of large layered intrusions (e.g.
Skaergaard, Bushveld) ... The formation of these
enriched ores likely resulted from early sulfide
segregation ... in a deep reservoir.”
29GENMINING OPEN PIT RESOURCES
Tonnes Pd Pt Cu Au Ag PdEq Pd Pt Cu Au Ag PdEq
(k) (g/t) (g/t) (%) (g/t) (g/t) (g/t) (koz) (koz) (Mlb) (koz) (koz) (koz)
MARATHON PIT CONSTRAINED MINERAL RESOURCE ESTIMATE AT C$13/TONNE NSR CUT-OFF (1-7)
M&I 179,248 0.56 0.18 0.20 0.07 1.6 1.24 3,238 1,064 796 390 9,335 7,130
Inferred 668 0.37 0.12 0.19 0.05 1.4 0.95 8 3 3 1 31 21
MARATHON PIT CONSTRAINED MINERAL RESOURCE ESTIMATE SENSITIVITY AT C$25/TONNE NSR CUT-OFF
M&I 116,071 0.73 0.23 0.25 0.08 1.7 1.56 2,735 850 639 300 6,326 5,826
Inferred 144 0.62 0.16 0.28 0.05 0.9 1.41 3 1 1 0 4 7
GEORDIE PIT CONSTRAINED MINERAL RESOURCE ESTIMATE AT C$15/TONNE NSR CUT-OFF (8-14)
Indicated 17,268 0.56 0.04 0.35 0.05 2.4 1.44 312 20 133 25 1,351 801
Inferred 12,899 0.51 0.03 0.28 0.03 2.4 1.22 212 12 80 14 982 505
GEORDIE PIT CONSTRAINED MINERAL RESOURCE ESTIMATE AT C$25/TONNE NSR CUT-OFF
Indicated 13,852 0.65 0.04 0.40 0.05 2.6 1.65 287 18 122 23 1,168 735
Inferred 6,593 0.61 0.03 0.34 0.04 2.4 1.45 130 7 49 8 508 307
SALLY PIT CONSTRAINED MINERAL RESOURCE ESTIMATE AT C$15/TONNE NSR CUT-OFF (8-14)
Indicated 24,801 0.35 0.20 0.17 0.07 0.7 0.96 278 160 93 56 567 767
Inferred 14,019 0.28 0.15 0.19 0.05 0.6 0.86 124 70 57 24 280 389
SALLY PIT CONSTRAINED MINERAL RESOURCE ESTIMATE AT C$25/TONNE NSR CUT-OFF
Indicated 9,875 0.51 0.30 0.18 0.10 0.8 1.24 162 95 39 31 240 395
Inferred 1,295 0.55 0.30 0.19 0.10 0.7 1.31 23 12 5 4 27 54
See Notes on slide 31 of this presentation
30NOTES
1. Mineral Resources which are not Mineral Reserves do not have demonstrated economic viability.
2. The estimate of Mineral Resources may be materially affected by environmental, permitting, legal, title, taxation, socio-political, marketing, or other
relevant issues.
3. The Inferred Mineral Resource in this estimate has a lower level of confidence than that applied to an Indicated Mineral Resource and must not be
converted to a Mineral Reserve. It is reasonably expected that the majority of the Inferred Mineral Resource could be upgraded to an Indicated Mineral
Resource with continued exploration.
4. The Mineral Resources in this report were estimated using the Canadian Institute of Mining, Metallurgy and Petroleum (CIM), CIM Standards on Mineral
Resources and Reserves, Definitions and Guidelines prepared by the CIM Standing Committee on Reserve Definitions and adopted by the CIM Council.
5. The Mineral Resource Estimate was based on US$ metal prices of $1,100/oz Pd, $900/oz Pt, $3/lb Cu, $1,300/oz Au and $16/oz Ag. The US$:CDN$
exchange rate used was 0.77.
6. The NSR estimates use flotation recoveries of 93% for Cu, 82% for Pd, 80% for Pt, 80% for Au, 75% for Ag and smelter payables of 96% for Cu, 93%
for Pd, 88% for Pt, 90% for Au, 90% for Ag .
7. The pit optimization used a mining cost of C$2 per tonne, combined processing, G&A and off-site concentrate costs of C$15/tonne and pit slopes of 50°.
8. Mineral Resources which are not Mineral Reserves do not have demonstrated economic viability.
9. The estimate of Mineral Resources may be materially affected by environmental, permitting, legal, title, taxation, socio-political, marketing, or other
relevant issues.
10. The Inferred Mineral Resource in this estimate has a lower level of confidence than that applied to an Indicated Mineral Resource and must not be
converted to a Mineral Reserve. It is reasonably expected that the majority of the Inferred Mineral Resource could be upgraded to an Indicated Mineral
Resource with continued exploration.
11. The Mineral Resources in this report were estimated using the Canadian Institute of Mining, Metallurgy and Petroleum (CIM), CIM Standards on Mineral
Resources and Reserves, Definitions and Guidelines prepared by the CIM Standing Committee on Reserve Definitions and adopted by the CIM Council.
12. The Mineral Resource Estimate was based on US$ metal prices of $1,100/oz Pd, $900/oz Pt, $3/lb Cu, $1,300/oz Au and $16/oz Ag. The US$:CDN$
exchange rate used was 0.77.
13. The NSR estimates use flotation recoveries of 93% for Cu, 82% for Pd, 80% for Pt, 80% for Au, 75% for Ag and smelter payables of 96% for Cu, 93%
for Pd, 88% for Pt, 90% for Au, 90% for Ag .
14. The pit optimization used a mining cost of C$2 per tonne, combined processing, G&A and off-site concentrate costs of C$15/tonne and pit slopes of 50°.
31MARATHON CONCENTRATE SPECS
32
32You can also read