Corporate Tax Revenue and Foreign Direct Investment: Potential Trade-Offs and How to Address Them - Sabine Laudage
←
→
Page content transcription
If your browser does not render page correctly, please read the page content below
Discussion Paper   17/2020

Corporate Tax Revenue and Foreign
Direct Investment: Potential Trade-Offs
and How to Address Them

Sabine Laudage
Corporate tax revenue and foreign direct
investment: potential trade-offs and how to
address them

Sabine Laudage

           Bonn 2020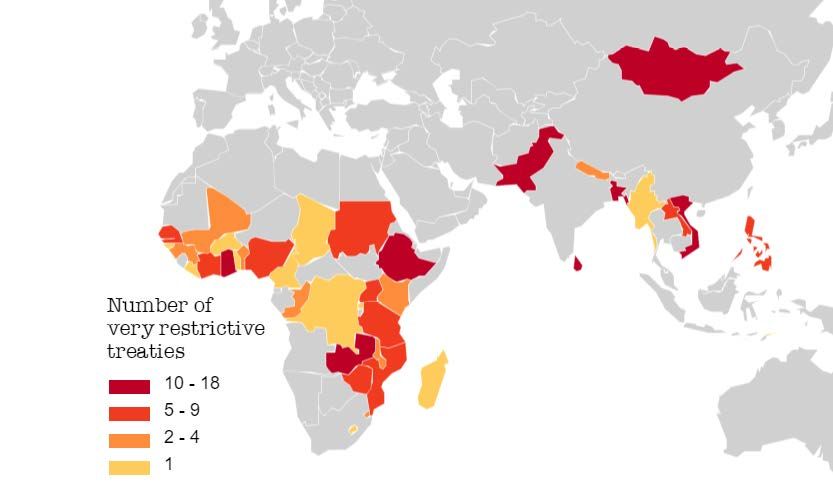
Discussion Paper / Deutsches Institut für Entwicklungspolitik ISSN (Print) 1860-0441 ISSN (Online) 2512-8698 Except as otherwise noted this publication is licensed under Creative Commons Attributtion (CC BY 4.0). You are free to copy, communicate and adapt this work, as long as you attribute the German Development Institute / Deutsches Institut für Entwicklungspolitik (DIE) and the authors. Die deutsche Nationalbibliothek verzeichnet diese Publikation in der Deutschen Nationalbibliografie; detaillierte bibliografische Daten sind im Internet über http://dnb.d-nb.de abrufbar. The Deutsche Nationalbibliothek lists this publication in the Deutsche Nationalbibliografie; detailed bibliographic data is available in the Internet at http://dnb.d-nb.de. ISBN 978-3-96021-128-0 (printed edition) DOI:10.23661/dp17.2020 Printed on eco-friendly, certified paper Sabine Laudage is a researcher with the research programme “Transformation of Economic and Social Systems” at the German Development Institute / Deutsches Institut für Entwicklungspolitik (DIE). Email: sabine.laudage@die-gdi.de Published with financial support from the Federal Ministry for Economic Cooperation and Development (BMZ) © Deutsches Institut für Entwicklungspolitik gGmbH Tulpenfeld 6, 53113 Bonn +49 (0)228 94927-0 +49 (0)228 94927-130 Email: die@die-gdi.de www.die-gdi.de
Acknowledgments
I would like to thank my colleagues Tilman Altenburg, Jakob Schwab, Christian von
Haldenwang, Kathrin Berensmann and Axel Berger for valuable feedback and review on
this paper. Moreover, I thank experts from BMZ and GIZ for commenting on earlier
versions of this study and providing practitioners’ insights.

Bonn, May 2020                                                        Sabine Laudage

Keywords: Corporate tax revenue, FDI, Financing for development, tax incentives, BEPS,
multinational firms
Contents

Acknowledgments
Abbreviations
Executive Summary                                                                     1
1      Introduction                                                                   3
2      Corporate tax revenue and FDI in developing countries                          4
2.1    Relating corporate tax revenue and FDI data                                     5
2.2    Correlating corporate tax revenue and FDI data                                 10

3      Trade-offs between corporate tax revenue and FDI                               12
3.1    Competing for FDI through tax incentives                                       12
3.2    Protecting the corporate tax base                                              19
4      Reforms of the international tax system                                        23
4.1    Increasing tax transparency                                                    23
4.2    Closing digital tax loopholes                                                  25
5      Conclusions and policy recommendations                                         27
References                                                                            29
Appendix                                                                              33

Figures
Figure 1:    Average corporate tax revenue (percentage of GDP) in developing
             countries, 2013–2017                                                      6
Figure 2:    Average FDI inward stock (USD millions) in developing
             countries, 2013–2017                                                      7
Figure 3: Average corporate tax revenue (per cent of GDP) for developing-country
          income groups, 1990–2017                                                     8
Figure 4: Average FDI inward stock and average FDI net inflow (both as a percentage
          of GDP) for developing country income groups, 1990–2017                      9
Figure 5: Scatterplot of corporate tax revenue and FDI inward stock, 2013–2017        11
Figure 6: Average corporate income tax rates in regions, 2000–2016                    13
Figure 7: Restrictive bilateral tax treaties in Africa and Asia                       18

Appendix Tables
Table A1:     List of developing countries with key data and memberships              33
Abbreviations
AEOI   Automatic Exchange of Information
ATAF African Tax Administration Forum
BEPS   Base Erosion and Profit Shifting
BTT    bilateral tax treaty
CFC    controlled foreign company
CIAT   Inter-American Center for Tax Administration
CIT    corporate income tax
DAC    Development Assistance Committee
EOIR   Exchange of Information on Request
EU     European Union
FATF   Financial Action Task Force
FDI    Foreign Direct Investment
FFD    financing for development
GDP    Gross Domestic Product
IMF    International Monetary Fund
LAC    Latin America and the Caribbean
LDC    least-developed country
LIC    low-income country
LMIC   lower-middle-income country
MNC    multinational corporation
ODA    official development assistance
OECD Organisation for Economic Cooperation and Development
SDG    Sustainable Development Goal
UMIC upper-middle -income country
USD    United States Dollars
Corporate tax revenue and foreign direct investment: potential trade-offs and how to address them

Executive Summary

Corporate tax revenue and Foreign Direct Investment (FDI) are two key sources of
development finance, according to the Addis Ababa Action Agenda for Financing for
Development. These sources are important because they enable developing countries to
finance public goods and mobilise private investment for sustainable development.
However, certain tax policies can have ambiguous impacts on corporate tax revenue, and
FDI and challenge the joint mobilisation of the two sources.

Against this background, the paper discusses potential trade-offs faced by developing
countries when mobilising both corporate tax revenue and FDI, and provides solutions that
address these trade-offs. A first trade-off exists between corporate tax incentives aimed at
attracting FDI and the objective of increasing corporate tax revenue. A second trade-off
results from the fact that policies that aim to protect the corporate tax base from erosion
caused by tax avoidance and profit shifting may disincentivise FDI.

Section 2 starts with a descriptive analysis of corporate tax revenue and FDI inward stock
data. One key finding is that all country income groups have been able to attract more FDI
since the 1990s. Total corporate tax revenue relative to GDP has increased for low-income
countries in particular. Furthermore, I find a negative correlation between corporate tax
revenue and FDI inward stock (both as a percentage of GDP) for upper-middle-income
countries, whereas the correlation is close to zero for low-income countries. This correlation
is clearly driven by omitted variables (e.g. economic diversification, institutional capacity and
the type of attracted FDI), but it calls for a more in-depth analysis of the tax-policy instruments
used at the intersection of FDI and the mobilisation of corporate tax revenue. Therefore, this
paper investigates further the potential trade-off indicated by the negative correlation.

The first part of Section 3 goes on to discuss the first trade-off. Decreasing corporate income
tax rates, tax expenditures, and tax incentives in bilateral tax treaties are identified as policy
instruments that might create trade-offs between corporate tax revenue and FDI. These
policy instruments are used by governments to attract FDI, but they can also create revenue
foregone. Several reform proposals are currently under discussion to tackle harmful effects
of tax incentives. For instance, in the Inclusive Framework on Base Erosion and Profit
Shifting (BEPS), developing countries are currently participating in discussions on a global
minimum corporate tax rate. A somewhat unregulated policy area is tax expenditure, which
needs to be strictly limited to projects that fulfil two conditions: (i) investments would not
happen without such incentives, and (ii) expected benefits (e.g. in terms of employment
generation or technology spillovers) outweigh the revenue foregone. This only applies to
efficiency-seeking sectors that attract investors looking for the lowest costs.

Part two of Section 3 turns to the second trade-off: tax-policy instruments that aim to protect
the corporate tax base of countries from base erosion and profit shifting and their potential
effect on FDI. The OECD/G20 BEPS project includes several anti-avoidance rules and
policies that try to limit multinational tax avoidance. The primary goal is to increase
corporate tax revenues. However, initial empirical evidence shows that these rules might
disincentivise foreign investment, if introduced unilaterally. The same applies to policy
instruments to reduce multinational tax evasion via trade misinvoicing.

German Development Institute / Deutsches Institut für Entwicklungspolitik (DIE)                     1
Sabine Laudage

Finally, Section 4 discusses reform proposals for the international tax system: how to
address the trade-offs between FDI and corporate tax revenues. First and foremost, a good
investment environment built on non-tax conditions (qualified workers, good infrastructure,
competitive suppliers, and security) could render at least some tax incentives for FDI
unnecessary. National investment authorities should improve their capability to assess the
expected developmental benefits of FDI and, on that basis, revise their tax-incentive policies
to avoid unnecessary subsidies. In addition, the international tax system needs to improve
by increasing tax transparency and closing digital tax loopholes.

So far, only a few countries have set the agenda in the Global Forum and the OECD/G20
BEPS project. However, the fora are opening up, and developing countries are becoming
actively engaged in the negotiations of future reforms and policy agendas. It is important
that rules against tax avoidance and evasion in line with multilateral decisions by the
Inclusive Framework are swiftly implemented and enforced. Joint multilateral approaches
to combating BEPS, such as the Addis Tax Initiative, might suit the interests of developing
countries better than unilateral action. To participate in information exchange and be able
to enforce complex international tax rules, tax administrations in developing countries need
to build their capacity.

Taxing the digital economy is particularly relevant to middle-income countries, where the
use of digital companies and services spreads fast. Development cooperation should provide
technical assistance regarding taxation of the digital economy, and promote the
digitalisation of tax administrations in developing countries.

2                      German Development Institute / Deutsches Institut für Entwicklungspolitik (DIE)
Corporate tax revenue and foreign direct investment: potential trade-offs and how to address them

1        Introduction

Corporate tax revenue and Foreign Direct Investment (FDI) are two important development
finance sources, which are closely linked with regard to the taxation of Multinational
Corporations (MNCs). In the Addis Ababa Action Agenda (United Nations, 2015), tax
revenues and FDI are identified as two key action areas for the financing for development
(FFD) process. Public revenue is critical for developing countries to provide much-needed
public goods in infrastructure, education and health. Therein, revenue from corporate
taxation plays a significant role in developing countries and amounts to almost 16 per cent
of total revenue (ICTD/UNU-WIDER, 2020). At the same time, mobilising more private
financing for development is essential to finance the Sustainable Development Goals
(SDGs) until 2030 (OECD, 2018b). A major component of international private resources
is FDI. However, it is mainly middle-income and resource-rich developing countries that
are able to attract FDI (UNCTAD, 2018b), whereas least-developed countries (LDCs) rely
more on flows of external aid. Reinforcing and jointly mobilising corporate tax revenue and
FDI is therefore critical for progress in the process of financing for development (FFD).

Developing countries have many reasons for wanting to attract FDI, such as the creation of
new jobs, a greater inflow of private capital, and the stimulation of long-term economic
growth. A good investment environment, with a functioning infrastructure, qualified
workers, competitive suppliers, and security are pre-conditions to attracting a share of FDI
in a competitive arena. However, many developing countries cannot provide such an
investment environment so governments resort to tax benefits, also called tax incentives, to
attract FDI. In about half of the developing countries, new tax incentives were introduced
or strengthened between 2009 and 2015 (Andersen, Kett, & Uexkull, 2017). This involves
the government giving up a part of its right to tax MNCs, while witnessing the erosion of
its corporate tax base due to profit shifting and other tax-avoidance practices by MNCs. To
address tax-base erosion, the government creates new rules and policies, which can have
the adverse effect of creating disincentives to foreign investors because of the higher
compliance costs.

Thus, when policy-makers try to mobilise both FDI and tax revenue from MNCs, they are
likely to face a twofold trade-off. The first trade-off occurs if governments use tax incentives
to attract FDI. The desired positive spillovers of FDI on other domestic sectors and growth
are often lacking, and it is unclear whether the investment, which was attracted by a tax
incentive, might not have happened anyway. Compared to the status quo (no FDI and low
corporate tax revenue), governments are able to attract FDI, but are unfortunately not
collecting tax revenue from the investment. While tax revenue is crucial in providing better
public goods and improving the overall investment environment of a country, tax incentives
form a first trade-off between corporate tax revenue and FDI.

The second trade-off occurs when governments try to protect their corporate tax base from
base erosion and profit shifting. Tax avoidance via profit shifting 1 has become a widespread
phenomenon, which amounts to a loss of about 7 per cent of developing countries’ corporate
tax revenues (Tørsløv, Wier, & Zucman, 2018). In addition, companies might also illegally

1   Profit shifting describes the re-location of profits from a firm in a high-tax country to a firm in a lower-
    tax country, where both firms are part of the same MNC group. The aim is to reduce the overall tax
    burden of the MNC.

German Development Institute / Deutsches Institut für Entwicklungspolitik (DIE)                                    3
Sabine Laudage
relocate their capital in tax havens or evade tax via trade misinvoicing. Tax evasion accounts
for illicit financial flows equivalent to 20 per cent of developing country trade
(Global Financial Integrity, 2019). To address tax avoidance and tax evasion by MNCs, a
number of tax-policy instruments have been developed (e.g. anti-profit-shifting rules).
However, the enforcement of these rules raises compliance costs for MNCs and might
change their investment location decision. Thus, rules and policies currently mainly
developed within the Organisation for Economic Cooperation and Development
(OECD)/G20 BEPS project might be effective in protecting corporate tax bases, but on the
other hand might backfire in terms of putting off FDI.
Limited research on these two trade-offs already exists but has not yet come to clear and
conclusive answers. The first strand of the literature assesses the effects of tax-incentive policies
on FDI and tax revenue. For example, the effect of tax incentives on FDI has been explored by
Klemm and Van Parys (2012), James (2013) and Morisset and Pirnia (2000), who come to
different conclusions for different geographic regions and time periods. The second strand of
the literature aims to quantify the effects of anti-BEPS measures on FDI and tax revenue. The
size of tax avoidance and tax evasion has recently been estimated in various quantitative studies
(see Bradbury, Hanappi and Moore (2018) for an overview). However, the effects of using tax
policies to combat tax avoidance and tax evasion have not been studied much for developing
countries until today (an exception is Hofman and Riedel (2018)).
Against this background, this paper gives an overview on tax-policy instruments that
concern the taxation of MNCs and potentially (dis-)incentivise FDI. 2 The main research
question is: Which tax policy instruments trigger a trade-off between corporate tax revenue
and FDI and how can these trade-offs be addressed by developing countries?
The rest of the paper is structured as follows: Section 2 shows corporate tax revenue and
FDI data for developing countries and identifies interesting correlations. Section 3 discusses
potential trade-offs between corporate tax revenue and FDI originating from different tax
policy instruments. Section 4 goes on to discuss how reforms of the international tax system
can address the trade-off. Finally, Section 5 concludes and provides policy
recommendations for developing countries related to the discussed policy instruments.
2 Corporate tax revenue and FDI in developing countries
Corporate tax revenues and FDI are important sources of development finance in developing
countries. 3 Total tax revenues amount to 15 per cent of Gross Domestic Product (GDP) on
average in LDCs and 22 per cent of GDP in upper-middle-income countries (UMICs) in
2016. Corporate tax revenue ranged between zero and 7 per cent of GDP in developing
countries in 2016 (ICTD/UNU-WIDER, 2020). Trends over recent years show that tax
2 A more holistic view on domestic tax regimes which includes the impact of policy instruments on other
types of taxes (e.g. personal income tax, VAT, licensing fees, etc.) cannot be provided in the scope of
this study, but should be kept in mind and is mentioned in several footnotes.
3 I use the term developing countries to refer to the list of Development Assistance Committee (DAC)
Official Development Assistance (ODA) receivers. The list can be grouped into least developed
countries (LDCs), other low-income countries (LICs), lower-middle-income countries and territories
(LMICs), and upper-middle-income countries and territories (UMICs) (OECD, 2018a).
4 German Development Institute / Deutsches Institut für Entwicklungspolitik (DIE)Corporate tax revenue and foreign direct investment: potential trade-offs and how to address them
revenues are increasing in almost all countries. However, FDI inward stock remains low in
least developed countries (LDCs) while it is increasing for lower-middle-income countries
(LMICs) and UMICs. The average FDI inward stock amounts to USD 6.26 billion in LDCs
and USD 63.89 billion in LMICs and UMICs (UNCTAD, 2018a). How are levels and
changes in these two development finance sources related over time and across countries?
Section 2.1 provides descriptive statistics on corporate tax revenue and FDI data for
developing countries in recent years and shows time-series graphs for country groups. In
Section 2.2, corporate tax revenue and FDI are correlated, and characteristics of different
country groups are identified. It is important to note that the coverage and quality of the
cross-country panel data does not allow for conclusive statements on specific countries, but
rather shows trends for the two variables.
2.1 Relating corporate tax revenue and FDI data
The relation between corporate tax revenue and FDI is diverse across countries in recent
years. Corporate tax revenue levels show some regional patterns, but in general terms reflect
a country’s overall welfare levels, measured, for instance, by the GDP per capita of a
country, and/or its wealth of exportable natural resources. Thus, FDI stocks tend to be higher
in resource-rich countries and UMICs. For all country income groups, I observe upward
trends in corporate tax revenues and FDI inward stock (both as a percentage of GDP),
whereas FDI net inflows are volatile over time. This reflects the global trend towards higher
overall welfare levels but increasing inequality gaps between countries.
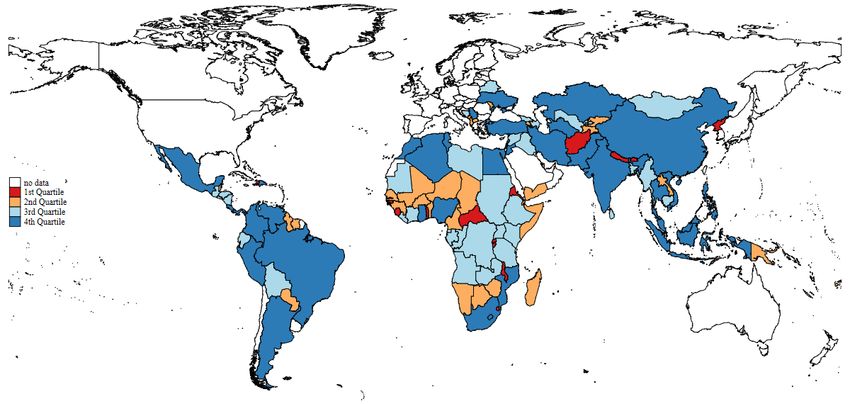
Figure 1 displays the quartiles of average corporate tax revenue (as a percentage of GDP)
for 81 developing countries 4 from the Development Assistance Committee (DAC) list
(OECD, 2018a) for the period 2013 to 2017. Countries marked in red have low corporate
tax revenue, ranging between zero and 1.7 per cent of GDP, and are mainly located in West
and East Africa, South-East Asia, and Latin America. 5 The second quartile, in orange,
includes countries with corporate tax revenues between 1.7 and 2.6 per cent of GDP. These
include countries in West and East Africa, Middle East, and Central Asia. The third and
fourth quartiles (light and dark blue) show countries with corporate tax revenues above the
developing country median (2.6 per cent of GDP). These countries are mainly located in
South America, Southern Africa, Eastern Europe, and East Asia. The levels of corporate tax
revenues seem to be strongly positively correlated with welfare levels, and negatively
correlated with natural resource wealth. Given that many of the countries with the lowest
corporate revenues have large stocks of natural resources (e.g. DR Congo, Mongolia, Nigeria
and Venezuela), they could mobilise more revenue from corporate taxes by efficiently taxing
the MNCs that operate in their countries. This requires more transparency in the extractive
industries and the taxation of MNCs in those countries. However, the extraction of natural
resources often involves state-owned enterprises and high levels of corruption.
4 Corporate tax revenue data are only available for a subsample of developing countries. The list of
countries can be found in Table A1 in the Appendix.
5 Note that the validity of these data is limited because they are not available for all countries and only
display the direct tax revenue from corporate income. Indirect tax revenue from corporations and non-
tax revenues are not displayed.
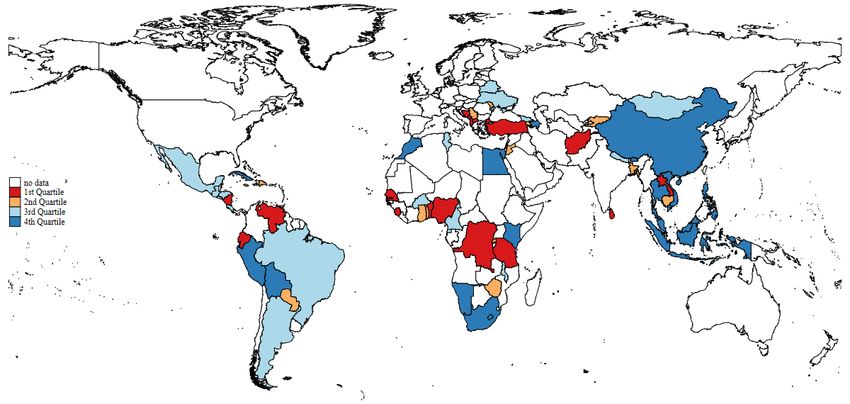
German Development Institute / Deutsches Institut für Entwicklungspolitik (DIE) 5Sabine Laudage Figure 1: Average corporate tax revenue (percentage of GDP) in developing countries, 2013–2017 Notes: The 81 countries are coloured depending on their average corporate tax revenue 2013–2017. The first quartile indicates corporate tax revenue smaller than 1.7 per cent of GDP. The second quartile ranges between 1.7 and 2.6 per cent of GDP. The third quartile ranges between 2.6 and 3.4 per cent of GDP. The fourth quartile indicates corporate tax revenue larger than 3.4 per cent of GDP. Source: Own illustration based on data from Government Revenue dataset, Corporate tax revenues as a per cent of GDP (ICTD/UNU-WIDER, 2020). Figure 2 shows FDI inward stocks (in USD millions) by quartiles for developing countries, averaged for the period 2013 to 2017. Colours follow the same pattern as in Figure 1. Countries marked in red and orange have FDI inward stocks below the median, and countries marked in blue have FDI inward stocks above the median of USD 6.2 billion. FDI flows into LMICs and UMICs are mostly above the median, whereas FDI inward stocks in LDCs are mostly below the median. No strong regional pattern is observable, but resource- rich countries (e.g. Angola, Mongolia and Nigeria) tend to have above-median FDI inward stocks. Note that the FDI inward stock is also positively correlated with GDP levels, since countries with larger economies tend to attract and accumulate more FDI. 6 German Development Institute / Deutsches Institut für Entwicklungspolitik (DIE)
Corporate tax revenue and foreign direct investment: potential trade-offs and how to address them
Figure 2: Average FDI inward stock (USD millions) in developing countries, 2013–2017
Notes: The 134 countries are coloured depending on their average FDI inward stock 2013–2017. The first quartile
indicates a FDI inward stock smaller than USD 1,590.48 million. The second quartile ranges between USD 1,590.48
million and USD 6,244.35 million. The third quartile ranges between USD 6,244.35 million and USD 24,100.65
million. The fourth quartile indicates a FDI inward stock larger than USD 24,100.65 million.
Source: Own illustration based on data from FDI Statistics, FDI inward stock in million USD (UNCTAD,
2018a).
In a next step, I display and analyse how corporate tax revenue and FDI evolved in
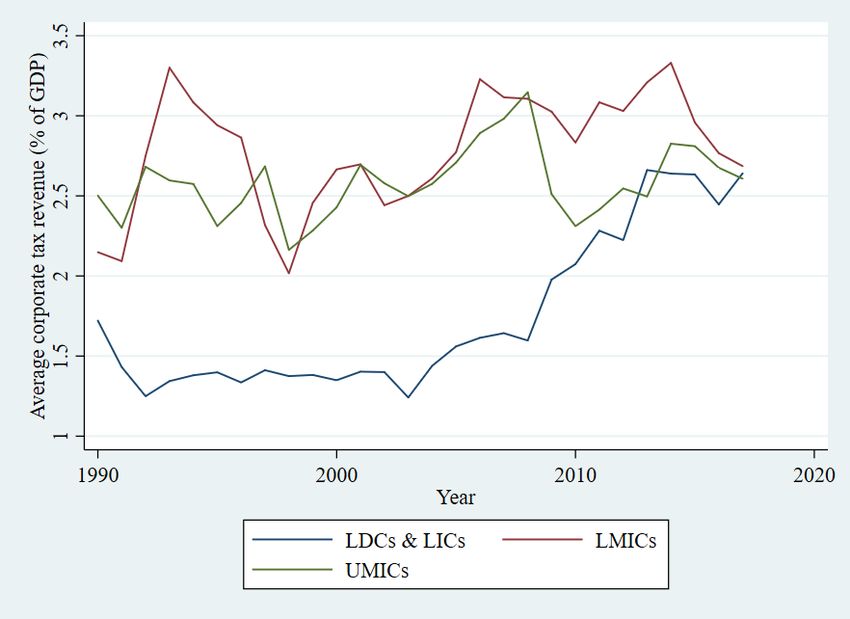
developing country income groups over time. Figure 3 shows how corporate tax revenue
(as a percentage of GDP) 6 has developed since 1990 for the different income groups of
developing countries. Corporate tax revenue has increased for LDCs and low-income
countries (LICs) from below 1.5 per cent in the 1990s to above 2.5 per cent of GDP in 2017,
on average. For LMICs and UMICs, corporate tax revenue fluctuated wildly between 1990
and 2017. On average, LMICs have increased their corporate tax revenue from close to 2 per
cent in 1990 to about 3 per cent of GDP since 2010. For UMICs, corporate tax revenue has
fluctuated a lot but has only increased by one percentage point in 2017 compared to the initial
level of 2.5 per cent in 1990.
6 Note that an increase in corporate tax revenue (as a percentage of GDP) can be due to an increase in
absolute CIT revenue or a decrease in GDP.
German Development Institute / Deutsches Institut für Entwicklungspolitik (DIE) 7Sabine Laudage
Figure 3: Average corporate tax revenue (per cent of GDP) for developing-country income
groups, 1990–2017
Notes: Albania and Botswana are excluded from the group of UMICs because they had very large outlier values in the
1990s (corporate tax revenue above 30 per cent of GDP).
Source: Own illustration based on data from Government Revenue dataset, Corporate tax revenue as a
percentage of GDP (ICTD/UNU-WIDER, 2020) and DAC country list (OECD, 2018a).
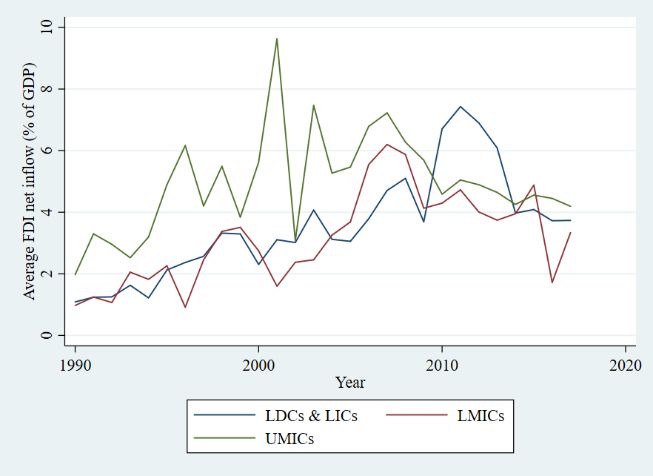
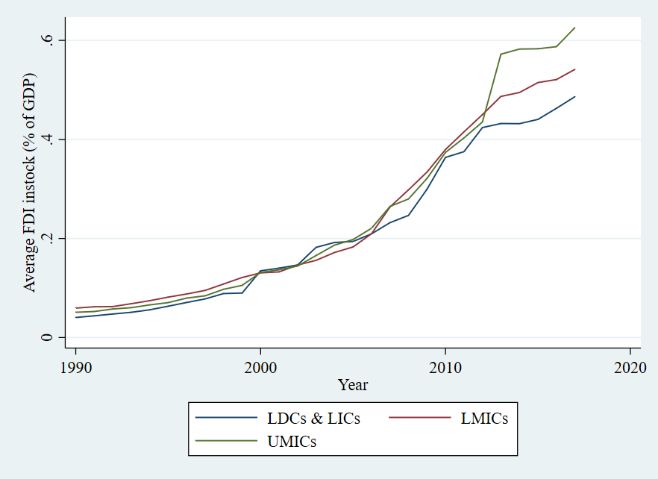
Figure 4 displays the evolution of average FDI inward stocks (left graph) and average FDI
net inflow (right graph) in developing-country income groups from 1990 to 2017. The key
message is that all country groups have succeeded in attracting FDI since the 1990s. In 1990,
FDI inward stocks were below 10 per cent of GDP in all country income groups. Since then,
FDI inward stocks have increased to more than 60 per cent of GDP in UMICs, 49 per cent
of GDP in LMICs, and above 54 per cent of GDP in the group of LDCs and LICs in 2017.
The graph on the right-hand side shows the corresponding yearly FDI inflows (as a
percentage of GDP), which build up the FDI inward stocks in the left-hand side graph. The
yearly FDI inflows are much more volatile. For the group of UMICs, the FDI inflows have
been decreasing since 2008 as a percentage of GDP. The beginning of the drop can be
attributed to the financial crisis, whereas the continuous drop indicates that many emerging
economies in this group have fast-growing economies and their GDP grows at a faster rate
than FDI inflow. Similarly, FDI inflows into LMICs (as a percentage of GDP) follow an
upward trend until the economic crisis and then decline. In LDCs and LICs, FDI net inflow
(as a percentage of GDP) shows also an upward trend until 2011, and since then follows a
downward trend. The declining trend of FDI inflow into developing countries is alarming
for progress on the financing for development agenda, as pointed out in a recent OECD
report on financing for sustainable development (OECD, 2018b).
8 German Development Institute / Deutsches Institut für Entwicklungspolitik (DIE)Corporate tax revenue and foreign direct investment: potential trade-offs and how to address them
Figure 4: Average FDI inward stock and average FDI net inflow (both as a percentage of GDP)
for developing country income groups, 1990–2017
Notes: Country groups include countries as stated in the DAC list of 2018 and are fixed for all years.
Source: Own illustration based on data from FDI Statistics, FDI inward stock in million USD divided by
GDP in million USD (UNCTAD, 2018a), FDI net inflow as a percentage of GDP (World Bank, 2019), and
DAC country list (OECD, 2018a).
A comparison of Figures 3 and 4 shows that both corporate tax revenue and FDI have been
increasing for the groups of developing countries. Corporate tax revenues fluctuated
strongly for LMICs and UMICs, whereas they significantly increased for LDCs and LICs
since 2004. 7 Aggregate FDI inward stocks (as a percentage of GDP) continuously increased
for all three country income groups. Average FDI net inflow (as a percentage of GDP) was
much more volatile and followed an upward trend on average in all income groups until the
economic crisis, but has since declined.
Summing up, all country income groups have been able to attract FDI since 1990, while the
absolute FDI inward stock in LDCs and LICs is still low. At the same time, corporate tax
revenue became relatively more important for these countries. UMICs experienced large
increases in FDI, whereas the relative increase in corporate tax revenue (as a percentage of
7 This is partly due to the fact that LICs and LDCs only started to report their tax revenues in a
comparable way during the depicted time period.
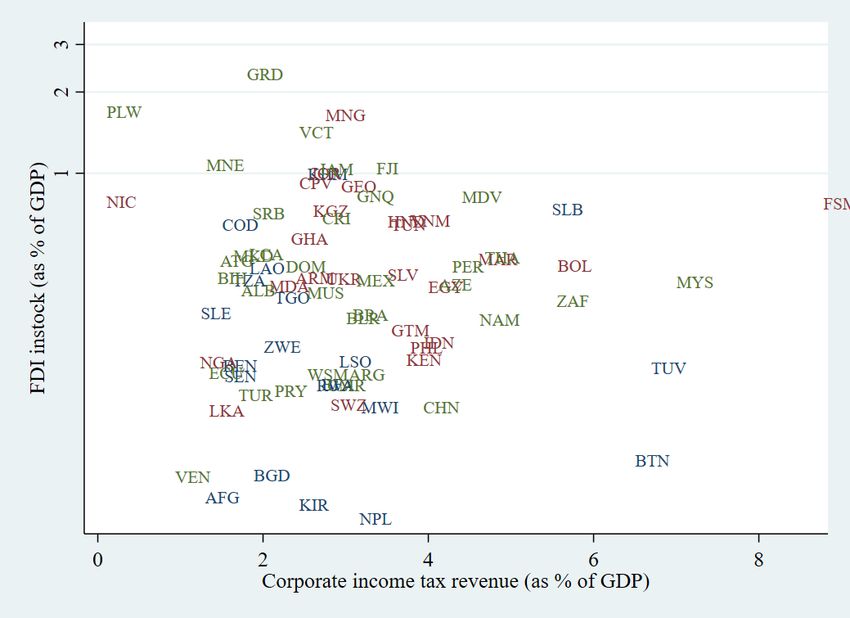
German Development Institute / Deutsches Institut für Entwicklungspolitik (DIE) 9Sabine Laudage GDP) is small. This poses the interesting question of whether FDI is attracted by tax incentives and/or by allowing for tax avoidance via profit shifting. If any of the two apply, the attraction of FDI would come with a trade-off for revenue mobilisation. This trade-off will be further discussed in Section 3. 2.2 Correlating corporate tax revenue and FDI data Correlating corporate tax revenue and FDI data across developing countries gives a diverse picture. On the one hand, some countries with higher FDI inward stocks tend to collect high corporate tax revenues, and vice versa. On the other hand, some countries show converse trends in corporate tax revenue and FDI – in other words, have large FDI inward stocks and small corporate tax revenues (both as a percentage of GDP), and vice versa. Is positive or negative correlation between corporate tax revenue and FDI inward stocks observable across different country income groups? This subsection tries to identify some general patterns in the link between corporate tax revenue and FDI relative to GDP across countries and income groups. Figure 5 plots corporate tax revenue against FDI inward stocks (both as a percentage of GDP) for 80 developing countries averaged over the period 2013 to 2017. The high dispersion suggests an ambiguous relation between the two development finance sources across developing countries, and it remains difficult to find a clear pattern across all developing countries. The overall correlation between corporate tax revenue and FDI inward stocks is negative and close to zero (−0.0921). Calculating the correlation coefficients for the three different country income groups reveals some more but limited insights into the link. For LICs and LDCs, I calculate a negligible negative correlation of −0.0159 and for LMICs the correlation is close to zero as well (0.013). This indicates that for poorer developing countries there is no clear pattern observable in the relation between corporate tax revenue and FDI inward stock measured relative to their GDP levels. Putting both variables in relation to GDP controls for differences in income levels across countries, but not for other possible omitted variables (e.g. export orientation and institutional capacity). For instance, countries that export more can collect more taxes from the exported goods and services, while at the same time an existing exporting infrastructure can help to attract further FDI. Similarly, countries with better institutions might be able to collect more revenue from corporations and provide a good investment environment. Hence, it is possible that the correlation is driven by these omitted variables. 10 German Development Institute / Deutsches Institut für Entwicklungspolitik (DIE)
Corporate tax revenue and foreign direct investment: potential trade-offs and how to address them

 Figure 5:      Scatterplot of corporate tax revenue and FDI inward stock, 2013–2017

 Notes: The y-axis has a logged scale. Blue country codes indicate LDCs and LICs, red country codes are LMICs, and
 green country codes are UMICs.
 Source: Own illustration based on data from FDI Statistics (UNCTAD, 2018a) and Government Revenue
 dataset (ICTD/UNU-WIDER, 2020).

On the contrary, for UMICs, the correlation between corporate tax revenue and FDI is
stronger and negative (−0.2336). Upper-middle income countries with higher FDI inward
stocks tend to have lower corporate tax revenues (both relative to GDP), and countries with
lower FDI inward stocks tend to have higher corporate tax revenues. Again, this negative
correlation might be driven by omitted variables. However, the negative correlation
indicates a potential trade-off for the joint mobilisation of corporate tax revenue and FDI in
UMICs. This trade-off can, for instance, be due to tax incentives provided by governments
to foreign investors. If a country provides tax incentives, it is able to attract more FDI, but
also collects relatively fewer direct taxes from corporations.

Moreover, the trade-off might depend on the type of FDI. In general, we can differentiate
between four different types of FDI: i) natural resource-seeking investment, ii) market-
seeking investment, iii) strategic asset-seeking investment, iv) efficiency-seeking
investment (Dunning, 1980). The different types of FDI are related to different investors’
motivations. The first three types of FDI (i–iii) are unlikely to respond to tax incentives,
whereas efficiency-seeking FDI can be attracted via tax incentives (Andersen et al., 2017).
Efficiency-seeking FDI flows to locations where production costs are lowest. Tax incentives
lower investors’ production costs and thus can help attract efficiency-seeking FDI. In
particular, efficiency-seeking FDI accumulates in competitive and export-oriented sectors.
Thus, tax incentives should only be provided for selected sectors that countries want to
strategically develop to better integrate into global value chains.

To conclude, the descriptive data analysis presented provides insights into how corporate
tax revenue and FDI inward stocks differ across developing countries and over time, but
does not allow for a conclusive link between the two development-finance sources.

German Development Institute / Deutsches Institut für Entwicklungspolitik (DIE)                                 11
Sabine Laudage
However, the partly negative correlation between corporate tax revenue and FDI indicates
a potential trade-off between the two sources. Therefore, the following section continues to
discuss tax-policy instruments that potentially trigger a trade-off between the two sources
and reviews empirical literature that assesses the interactive effects.
3 Trade-offs between corporate tax revenue and FDI
Differences in corporate tax revenue and FDI between countries and over time can be due
to trade-offs between the two development finance sources, which are provoked by different
tax-policy instruments discussed in this section. A first set of instruments are tax incentives
for MNCs to attract FDI, which include low corporate income tax (CIT) rates, tax
expenditures, and special provisions in bilateral tax treaties for foreign investors. The
controversy surrounding tax incentives is discussed regarding their effectiveness to attract
FDI and their impact on public revenue collection. If FDI attracted through tax incentives
does not create the desired spillover effects on employment and the domestic supplier
markets, they are often considered costly and inefficient. Thus, tax incentives can contribute
to a trade-off between corporate tax revenue and FDI (see Section 3.1).
A second set of policy instruments tries to protect the corporate tax base from tax avoidance
and tax evasion by MNCs. These include, for instance, a multilateral instrument for tax
treaties, anti-profit-shifting rules and anti-tax-evasion policies. Governments aim to increase
their corporate tax revenue by fighting tax avoidance and tax evasion by MNCs. However,
stricter rules to fight tax avoidance and evasion might disincentivise FDI, and lead investors
to choose other low-tax countries for their investments. Initial empirical evidence on this
trade-off remains low for developing countries and is discussed further in Section 3.2.
3.1 Competing for FDI through tax incentives
Tax incentives are an instrument widely used by developing countries to attract FDI. A new
database on tax incentives for corporate investments reveals that 49 to 72 per cent of the
107 developing countries in the sample offer types of tax incentives (e.g. tax holiday,
preferential tax rate, or tax allowance). Furthermore, the data show that new or more
generous tax incentives were introduced in about half of the developing countries between
2009 and 2015 (Andersen et al., 2017). 8 The share of countries in Sub-Saharan Africa is
especially large; 65 per cent of countries made tax incentives more generous in at least one
sector over the study period. This subsection focuses on three different types of incentives
primarily used in developing countries: low corporate income tax rates, tax expenditures,
and tax incentives in bilateral tax treaties; it discusses their potential impact on the trade-off
between corporate tax revenue and FDI.
8 The new database by the World Bank Group only includes information on direct corporate tax
incentives, but excludes information on indirect tax incentives (e.g. customs duties, VAT exemptions, or
subsidies).
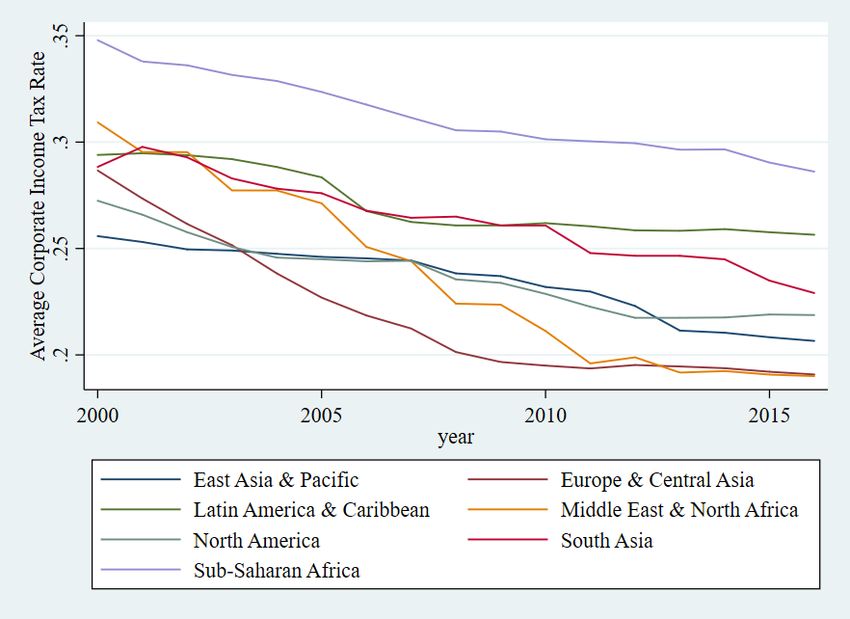
12 German Development Institute / Deutsches Institut für Entwicklungspolitik (DIE)Corporate tax revenue and foreign direct investment: potential trade-offs and how to address them Racing corporate tax rates to the bottom Corporate income tax (CIT) rates are decreasing in most regions of the world as a consequence of increasing competition over scarce FDI. This trend started in OECD countries with a decrease in the OECD’s average CIT rate from 30 per cent in 2000 to 22 per cent in 2018. Another shock was experienced when the United States cut its statutory CIT rate from 35 to 21 per cent in 2018 (OECD, 2019b). Developing countries are joining the “race-to-the-bottom” of corporate tax rates. In all regions, average CIT rates decreased during the period 2000 to 2016 (see Figure 6). Average CIT rates remain highest in Sub- Saharan Africa and Latin America & the Caribbean (LAC), with CIT rates above 25 per cent in 2016. In South Asia, North America, and East Asia & Pacific average CIT rates range between 20 and 25 per cent in 2016. Average CIT rates are lowest in the Middle East & North Africa and Europe & Central Asia in 2016 (below 20 per cent). Lowering corporate income tax rates creates direct losses in public revenues, which are often compensated for by individual income tax payments and indirect tax revenues that put more load on the low- and middle-income classes. Figure 6: Average corporate income tax rates in regions, 2000–2016 Notes: The data include statutory CIT rates for up to 193 countries in an unbalanced panel. All countries are included for which data were available. Source: Own illustration based on data collected from EY Worldwide Corporate Tax Guides (Ernst & Young, 2000-2016). The race-to-the-bottom of CIT rates was accompanied by a growing number of tax havens and high-risk third countries in the developing world with notoriously low corporate tax rates and high levels of financial secrecy. Only recently did the number of jurisdictions on these black and grey lists began to decrease because countries were put under public pressure and started to comply with good tax governance standards. Several tax haven lists have been published by international organisations (e.g. OECD) and NGOs (e.g. Tax Justice Network), which use different criteria to define tax havens and high-risk third countries. In German Development Institute / Deutsches Institut für Entwicklungspolitik (DIE) 13
Sabine Laudage

this study, I follow the European Council list on non-cooperative tax jurisdictions (Annex
I) and countries on their watch list (Annex II) (European Council, 2020). 9 On the initial
European Commission list of non-cooperative jurisdictions on tax matters from 2017, 17
countries were listed as non-cooperative and 47 countries as on the watch list
(European Council, 2017). Countries are considered as non-cooperative if they do not
cooperate with the European Union (EU) on tax matters (also named black list). On the
watch list (also named grey list), countries are listed if they cooperate with the EU in
improving their tax-cooperation ambitions (e.g. by joining the Global Forum and the
Inclusive Framework on BEPS, or eliminating harmful tax regimes). While countries have
been removed and added in the following years on a biannual evaluation, in February 2020
the list only included 12 non-cooperative countries and 13 countries on the watch list
(European Council, 2020). This constitutes a clear decrease in the number of tax havens and
seems to show effectiveness of the public shaming of countries on the black and grey lists.
Among the 12 countries on the black list in 2020 are five developing countries (Fiji, Palau,
Panama, Samoa and Vanuatu). The watch list includes 10 developing countries. Most of
these countries have invested heavily in the financial sector over the past decades in order
to attract FDI. In addition to low corporate tax rates, tax havens provide many other financial
services to MNCs and banks, while maintaining high levels of financial secrecy. This
attracts international investors to channel their investments via shell companies in tax
havens or to store their wealth and profits in offshore bank accounts. In order to cooperate
on tax transparency, these countries need a perspective for diversifying their economy and
becoming less dependent on the financial and banking sector.

In addition, the European Commission published a list of 11 high-risk third countries in
2016 (European Commission, 2016). According to the EU Anti-Money Laundering
Directive, these countries have “strategic deficiencies in their anti-money laundering and
countering the financing of terrorism regimes”. This list has been amended as well (bi-)
annually and increased to 16 jurisdictions in 2020 (The Law Society, 2020). Almost all
countries on the high-risk third-country list are developing countries (except for Trinidad
and Tobago). Since the number of high-risk third countries has increased, efforts on tackling
anti-money laundering and terrorism financing also need to be increased. Tax-related illicit
financial flows originating from these countries create huge revenue losses worldwide. The
Financial Action Task Force (FATF) has developed risk-assessment guidance to combat
money laundering, which is implemented in an increasing number of developing countries.

Empirical evidence on the effects of lower CIT rate and tax havens on FDI and tax revenues
exists. The effect of CIT rates on FDI and corporate tax revenue shows that lower CIT rates
can attract FDI in some countries, but not all, whereas the effect on tax revenue is uncertain.
Abbas and Klemm (2013) observe a partial race-to-the-bottom where statutory CIT rates
are reduced but effective CIT rates in developing countries are not reduced more than in
developed countries. Klemm and Van Parys (2012) find that lower CIT rates increase FDI
in LAC but not in Africa. On the contrary, Boly, Coulibaly and Kéré (2019) find for Africa
that lower CIT rates can increase FDI inflow in host and neighbouring countries. Bellak and
Leibrecht (2009) use bilateral effective average tax rates and find that tax lowering can
attract more FDI in Eastern European countries. Kawano and Slemrod (2016) find that

9    Table A1 of the Appendix provides a full list of developing countries that are on the EU list of non-
     cooperative tax jurisdictions and high-risk third country list, categorised as NC = Non-cooperative list,
     W = Watch list, and HR = High-risk third country list.

14                          German Development Institute / Deutsches Institut für Entwicklungspolitik (DIE)
Corporate tax revenue and foreign direct investment: potential trade-offs and how to address them reforms reducing CIT rates are often accompanied by reforms to broaden the corporate tax base, which makes effects on tax revenues hard to predict. The literature on tax havens finds that 30 per cent of world FDI stock is channelled through tax havens, so-called offshore FDI (Haberly & Wójcik, 2015). There is a notion that tax havens take away FDI from other countries. However, another study finds that tax havens can in fact be good neighbours for developing countries because being geographically close to a tax haven can create spillovers in FDI for neighbouring countries (Blanco & Rogers, 2014). The effect of tax havens on third countries’ revenues is agreed to be negative and harmful to overall welfare in the literature. Slemrod and Wilson (2009) developed a theoretical model that predicts that the elimination of the largest tax havens can increase overall welfare for high-tax countries and the remaining tax havens. Therefore, decreasing CIT rates and the presence of tax havens can contribute to the trade- off between revenue mobilisation from corporations and FDI attraction that many developing countries face. 10 On the one hand, low CIT rates reduce revenue collected from the corporate tax base, but on the other hand, countries hope for a comparative advantage to attract FDI and increase economic growth by cutting their CIT rates below the regional average. As stated earlier, tax incentives (including CIT rates) are only effective in attracting efficiency-seeking FDI, but not other types of FDI such as market-seeking or natural- resource-seeking FDI. Thus, lowering the broad statutory CIT rate seems to be inefficient at attracting more FDI but rather creates revenues foregone. It is more efficient to direct well-designed tax incentives to strategic sectors that can attract efficiency-seeking FDI. How could this trade-off be addressed? The introduction of a minimal corporate tax rate in regions or even better for all countries could partly solve the trade-off, reduce regional tax competition, and ensure a fair collection of revenue from CIT. Currently, the Inclusive Framework on BEPS discusses the introduction of a global minimum corporate tax rate for their members (Pillar Two of BEPS Action 1 (OECD, 2019d)). Defining a global minimum tax rate for corporations would solve one aspect of the problem of international tax competition and bring back lost revenues. However, it is unclear so far how this minimum tax rate should be enforced globally, and how countries will be held accountable for the actual implementation of this regulation. In particular, developing countries lack information on how such a global reform would impact their own revenues. Two important risks of this reform proposal are, first, that all countries lower their official corporate tax rates to the minimum level and countries with initial higher tax rates lose revenue. Second, countries make use of other tax incentives to lower the effective tax rates for corporations and undercut their regional competitors (e.g. via tax expenditures). Therefore, an international reform on corporate income tax rates must go hand in hand with a review of tax expenditure regimes and a continuous monitoring of effective tax rates. Giving away tax expenditures Corporate tax expenditures are fiscal incentives that governments give to foreign firms in order to influence their locational and behavioural decision regarding FDI. They present 10 Only the direct effects of decreasing corporate tax rates on FDI and corporate tax revenue are considered here. However, it is noteworthy that there might also be positive indirect effects on other types of tax revenue (e.g. personal income tax, VAT, goods and services taxes, etc.). German Development Institute / Deutsches Institut für Entwicklungspolitik (DIE) 15
Sabine Laudage

another form of tax incentives given to MNCs and pose a risk to revenue collection.
According to an International Monetary Fund (IMF) definition, tax expenditures create
“revenue foregone, attributable to provisions in the tax law that allow special exclusions,
exemptions, deductions, credits, concessions, preferential rates, or deferral of tax liabilities
for select groups of taxpayers or specific activities” (IMF, 2018). Andersen et al. (2017)
find that developing countries often use tax holidays for corporate income tax and mainly
grant them to the infrastructure and manufacturing sectors, depending on location
conditions. 11 Other tax expenditures by developing countries include patent boxes and fiscal
regimes in special economic zones (Redonda et al., 2018).

The controversy surrounding the effectiveness of tax expenditures in attracting FDI and
promoting economic growth is discussed in the empirical literature. Klemm and Van Parys
(2012) find that longer tax holidays effectively attract FDI to LAC countries but not to
African countries. Similarly, Van Parys and James (2010) find no positive effect of tax
holidays on FDI in African countries, but improving other factors of the investment
environment helps to increase FDI (e.g. increasing the number of legal guarantees for
investors or reducing the complexity of the tax system). A comprehensive literature review
of tax incentives and FDI concludes that tax incentives need to be combined with non-tax
factors in order to be effective (Munongo, Akanbi, & Robins, 2017). Thus, the effectiveness
of tax expenditures depends on the country context, in other words, the investment
environment, political and macroeconomic stability, domestic market size, infrastructure,
labour market skills, and the sector and scope of investment (World Bank, 2018). In
particular, tax expenditures can be ineffective in LDCs if the basic investment environment
is lacking (Andersen et al., 2017). Another example of ineffective tax incentives are tax
exemptions in extractive industries, which are often hidden in individual contracts. Firms in
extractive industries might invest even without receiving additional tax expenditures. In
those cases, governments do not need to provide tax expenditures. Lastly, environmentally
harmful tax expenditures such as for fossil fuels create negative externalities, which should
be stopped (Redonda et al., 2018).

Tax expenditures often contribute to the trade-off between tax revenue and FDI if the
amount of attracted FDI does not compensate for the amount of tax revenue lost. However,
efficiently designed tax expenditures can attract FDI and at the same time create positive
spillovers of FDI to compensate for losses in tax revenue. 12 There are no empirical studies
yet that estimate simultaneously the quantitative impacts of tax expenditures on FDI and tax
revenue. This is due to the unavailability of data and the difficulty in disentangling the
effects of tax expenditures from the effects of other confounding factors. However, if tax
expenditures are carefully designed and only directed at selected sectors, they can be
successful in attracting efficiency-seeking FDI. In particular, tax expenditures should be
strictly limited to projects that fulfil two conditions: (i) investments would not happen
without such incentives, and (ii) expected benefits (e.g. in terms of employment generation
or technology spillovers) outweigh the revenue foregone. At the same time, a good
investment environment should be a pre-condition for giving tax expenditures to foreign
firms (Andersen et al., 2017). Environmentally harmful tax expenditures have to be

11 This study only looks at direct corporate income tax incentives, but excludes customs exemptions and
   indirect tax exemptions from their analysis.
12 Positive spillover effects on employment and supplier markets can create indirect effects on other types
   of tax revenue (e.g. personal income tax, goods and services taxes, licenses fees etc.).

16                         German Development Institute / Deutsches Institut für Entwicklungspolitik (DIE)
Corporate tax revenue and foreign direct investment: potential trade-offs and how to address them

eliminated (e.g. for fossil fuels) and governments should increase the transparency of the
size and types of their tax expenditures (Redonda et al., 2018).

Providing tax incentives in bilateral tax treaties

Tax incentives for FDI are also provided in bilateral tax treaties (BTTs), which regulate the
taxation of cross-border financial flows between two countries. Tax treaties are initially
designed to avoid double taxation, which is still one of the biggest hurdles for international
investors. Hence, for two developed countries with symmetric cross-border flows, a BTT is
beneficial for both contracting countries regarding the equal sharing of taxation rights and
the creation of more tax certainty for foreign investors.

On the contrary, developing countries have signed more than 2000 BTTs since the 1960s,
among which many are with developed countries. This implies an asymmetric relationship
between the two contractor countries because developing countries take the role of capital
importers, whereas industrialised countries are mainly capital exporters. The design of the
BTTs, however, does not take the asymmetric capital flow relationship equitably into
account, and thus many developing countries give up parts of their tax rights through
restrictive clauses in asymmetric BTTs (Hearson, 2018). Tax-incentive provisions in
restrictive BTTs include zero withholding tax rates on dividends, interests and royalties, or
a loose permanent establishment definition for foreign firms. Permanent establishment
definitions in BTTs reduce the tax rights of capital-importing countries because
establishments of foreign firms can only be taxed after a certain period of time. Similarly,
dividend, interest and royalty payments escape the countries of value creation without the
payment of withholding taxes, but are taxed in the owner country of the foreign investor –
or in offshore financial centres to which ownership of intellectual property has been shifted
in order to lower a firm’s tax burden. The ActionAid Tax Treaty dataset analyses the
restrictiveness of more than 500 BTTs concluded by 43 African and Asian developing
countries up to 2016/2017 (ActionAid/ICTD, 2017). Figure 7 shows that Bangladesh,
Ethiopia, Ghana, Mongolia, Pakistan, Sri Lanka, Vietnam and Zambia have signed more
than ten BTTs that highly restrict their tax rights as capital-importing countries.

German Development Institute / Deutsches Institut für Entwicklungspolitik (DIE)                     17
Sabine Laudage

 Figure 7:           Restrictive bilateral tax treaties in Africa and Asia

 Notes: Permission rights granted on this graphic by ActionAid International. Note that some of the treaties in the data
 might have been subject to negotiations since the collection of the dataset in 2016/17.
 Source: ActionAid/ICTD (2017), ActionAid Tax Treaties Dataset, accessed on 6 May 2020 via:
 https://www.ictd.ac/dataset/action-aid-tax-treaties-dataset/; all rights reserved, used with permission.

The core problem of restrictive BTTs is that they create losses in revenue for the capital-
importing countries, but also trigger negative spillover effects on other countries. For
instance, restrictive tax treaties can be used to channel investment from country A via
country B to country C because between countries A and C no BTT is in place, whereas
country B has a good network of BTTs. This behaviour has become known as treaty
shopping and helps MNCs to avoid paying withholding taxes. van‘t Riet and Lejour (2018)
find that treaty shopping generates revenue losses via tax avoidance of MNCs, while FDI
stocks of the most central countries in the tax treaty network are increasing. Petkova, Stasio
and Zagler (2019) support the evidence that the network of BTTs, and not individual BTTs,
is the driver of FDI attraction. At the central nodes of the tax-treaty network are often tax
haven countries. Beer and Loeprick (2018) analyse African BTTs involving the regional tax
haven Mauritius and find that they do not increase FDI, but rather increase MNCs’
incentives for profit shifting and treaty shopping. The evidence that the conclusion of single
tax treaties can increase FDI inflow is limited and controversial. Initial evidence by
Neumayer (2007) shows that BTTs are only effective in attracting FDI in middle-income
countries, but not in LICs. On the contrary, Janský and Šedivý (2019) calculate the potential
revenue costs of BTTs for a sample of 14 developing countries as amounting to up to 0.17
per cent of GDP. A recent paper by Azémar and Dharmapala (2019) finds that tax-sparing
provisions in BTTs are actually successful at increasing FDI inflow in developing countries.
Tax-sparing provisions in BTTs protect tax incentives given by host countries, so that they
are not leveraged by a residence country’s tax levied on the investment.

The empirical literature shows that BTTs have a high potential to contribute to the trade-off
between corporate tax revenue and FDI in developing countries. For LDCs and LICs in
particular, BTTs bear a high risk of creating revenue losses, if not carefully designed. Thus,
some countries such as Uganda have started to renegotiate old BTTs to achieve a fairer share

18                            German Development Institute / Deutsches Institut für Entwicklungspolitik (DIE)
Corporate tax revenue and foreign direct investment: potential trade-offs and how to address them

of taxing rights. Special caution is needed if a country concludes a BTT with a tax haven
country. Due to the lack of proof that BTTs really increase FDI, and the limited capacities
of tax administrations to estimate potential benefits up-front, developing countries should
carefully consider if, and with whom, they want to enter into a BTT. Furthermore,
developing countries should consider signing the OECD’s Multilateral Instrument, 13 which
protects them from BTT-related tax avoidance and treaty shopping (OECD, 2013).

To conclude, tax incentives (e.g. low CIT rates, tax expenditures and restrictive BTTs)
represent a high risk to countries’ corporate tax revenues, whereas their impact on FDI is
often negligible. In addition, they can cause harmful spillover effects on third countries via
increased tax competition or treaty shopping. Therefore, tax incentives should be carefully
designed and targeted at efficiency-seeking FDI in order to avoid a trade-off between
corporate tax revenue and FDI (World Bank, 2018). National investment authorities should
improve their capabilities to assess the expected developmental benefits of FDI and, on that
basis, revise their tax-incentive policies to avoid unnecessary subsidies. Under the concept
of Good Financial Governance, German development cooperation already supports tax
administrations and regional tax organisations to implement international tax reforms and
eliminate harmful tax instruments. This support should be broadened to facilitate the uptake
of new international standards and regulations in partner countries.

3.2       Protecting the corporate tax base

While revenue foregone due to tax incentives and restrictive BTTs lies in the governments’
own decision, the corporate tax base in developing countries is being further eroded by legal
tax avoidance and illegal tax evasion by MNCs. Several studies have estimated the enormous
size of revenue losses due to base erosion and profit shifting. Rough estimates range between
USD 80 billion and USD 647 billion a year worldwide, depending on the data and
methodology used (Bradbury et al., 2018; Cobham & Janský, 2018; Crivelli, De Mooij, &
Keen, 2015; Janský & Palansky, 2017; Tørsløv et al., 2018). Further empirical findings show
that FDI-related profit shifting of MNCs is causing even greater relative losses in corporate
tax revenue in developing countries than in developed countries (Johannesen, Tørsløv, &
Wier, 2019). In addition, corporate tax evasion due to trade misinvoicing in developing
countries is estimated at 19 to 24 per cent of developing countries’ trade
(Global Financial Integrity, 2019). These rough estimates indicate that the potential to
increase domestic revenues is enormous if multinational tax avoidance and tax evasion can
be condemned, whereas the impacts on investment and other real-economy effects are
ambiguous. Stricter international tax rules are needed to bring back the revenue losses due to
international tax avoidance and evasion.

This subsection discusses different tax-policy instruments that address the problems of
multinational tax avoidance and tax evasion. The instruments are designed to protect
domestic corporate tax bases by fighting base erosion and profit shifting (BEPS) and
combating corporate tax evasion. However, it is unknown if the anti-avoidance rules and
anti-evasion policies may negatively impact FDI and thus create a trade-off between
revenue gains and investment losses.

13
      Multilateral Convention to Implement Tax Treaty Related Measures to Prevent Base Erosion and Profit
      Shifting.

German Development Institute / Deutsches Institut für Entwicklungspolitik (DIE)                        19
You can also read