Cost-effectiveness of integrating on-site Renewable Energy and Storage in High Power Charging stations for Electric Vehicles - UPCommons
←
→
Page content transcription
If your browser does not render page correctly, please read the page content below
Cost-effectiveness of integrating on-site
Renewable Energy and Storage in High Power
Charging stations for Electric Vehicles
Case study of 2 IONITY stations in Spain and Sweden.
Master’s thesis in Electrical Engineering

ALBERT GODAY SAGARRA

DEPARTMENT OF ELECTRICAL ENGINEERING

CHALMERS UNIVERSITY OF TECHNOLOGY
Gothenburg, Sweden 2021
www.chalmers.se
MASTER’S THESIS 2021

 Cost-effectiveness of integrating on-site
Renewable Energy and Storage in High Power
 Charging stations for Electric Vehicles

Case study of 2 IONITY stations in Spain and Sweden

 ALBERT GODAY SAGARRA

 Department of Electrical Engineering
 CHALMERS UNIVERSITY OF TECHNOLOGY
 Gothenburg, Sweden 2021

 ii
Cost-effectiveness of integrating on-site Renewable Energy and Storage in High Power
Charging stations for Electric Vehicles.
Case study of 2 IONITY stations in Spain and Sweden
ALBERT GODAY SAGARRA

© ALBERT GODAY SAGARRA, 2021

Supervisor: Anders Grauers, Department of Electrical Engineering

Master’s Thesis
Department of Electrical Engineering
Chalmers University of Technology
SE-412 96 Gothenburg, Sweden
Telephone +46 (0)31-772 10 00

Gothenburg, Sweden 2021

 iii
ABSTRACT

The fast pace introduction of Electric Vehicles into the European markets has intensified
the need for High Power Charging stations along highways to enable long-distance
travelling as convenient as with an internal combustion engine car. To make sure that the
system is cost-effective regarding the electrical grid connection and that it has the lowest
environmental footprint, the integration of on-site renewable energy production and
battery energy storage is studied. Two IONITY high-power charging stations in Spain
and Sweden are analysed. The objective is to find a viable solution regarding the electrical
supply, considering the grid tariffs and the solar and wind resources for each location.
The simulations are performed using HOMER Energy software, which optimizes the
system based on the Net Present Cost. Several cases are studied setting different grid size
limits to determine the need for on-site battery storage in locations where the distribution
grid does not have enough capacity. In Spain, a system with much solar PV will have a
significantly lower cost than only connecting the chargers directly to the grid. In Sweden,
solar PV or wind turbines have a similar cost than connecting only the chargers directly
to the grid. Storage would be cost-effective if costs lower to 150 €/kWh or in cases with
both a low demand for charging and low power grid connection. However, the grid
connection needs to be oversized, so it meets the future demand, which all the tendencies
show will be growing due to stricter emissions regulations and to government’s
willingness.

Keywords: high power charging; renewable energy; solar PV; storage; electric vehicles;
IONITY.

 iv
v
ACKNOWLEDGEMENTS

I would like to express my very great appreciation to Professor Anders Grauers for the
constant supervision done in the last months. It has been especially important the way he
has given me advice, always in a constructive manner and with lots of techniques
regarding the way to research or draft this document, that I can now say I have very well
learnt. His expertise with Electric Vehicles and the way of thinking of the future in this
disruptive sector has empowered me with lots of ideas, some of which are written in this
Thesis. I would also like to thank him for the atmosphere created in our weekly, sadly
online, meetings which was very quiet and always with positivism, new ideas and great
advice. Then he made possible the contact with Göteborg Energi, which provided me
solar PV production data, that has been very helpful to have real values for the Swedish
case and not historically modelled ones. For this reason, I wish to acknowledge the help
provided by Henrik Forsgren and Martin Johnson of Göteborg Energi.

Dr. Francisco J. Márquez-Fernández of Lund University provided me with very valuable
advice regarding the technical and economical characteristics of a solar PV plant as well
as other important points.

Then, I wish to acknowledge the help provided by Björn Röhle of Transsolar for the
Sortimo Campus simulation and Mikel Borrega of Ingeteam for the DC bus architecture
in their HPC design.

Responses of the survey provided by the Electric Vehicle Users Association of Spain
(AUVE) and the Electric Vehicle Association (EVA) Scotland were greatly appreciated.
For this reason I would also like to thank Martin Lee of the EV news daily podcast to
share with his audience my survey. Finally, I am particularly grateful for all the IONITY
staff that answered the survey as well as other people who did it via the social networks
post I made.

I would also like to extend my thanks to Jan Haugen, Henrik Siegel, Allard Sellmeijer
and Unai Baldús from IONITY for the advice given related to details of the IONITY
stations studied and ideas for the suggested implementation.

Finally, I wish to thank my parents for the support given that even with distance has been
important and to express gratitude to the Erasmus friends of Göteborg for their
encouragement throughout my study.

 vi
vii
CONTENTS

LIST OF ABBREVIATIONS .......................................................................................... 0
1. INTRODUCTION ..................................................................................................... 1
 1.1. Background ........................................................................................................ 1
 1.2. Aim of the project .............................................................................................. 2
 1.3. Limitations ......................................................................................................... 2
 1.4. Method ............................................................................................................... 2
 1.5. Outline of the thesis ........................................................................................... 4
2. HIGH POWER CHARGING AND EXAMPLES .................................................... 5
3. ELECTRIC VEHICLE USER SURVEY ................................................................. 7
 3.1. Survey structure ................................................................................................. 7
 3.2. Survey results description .................................................................................. 7
4. DESCRIPTION OF THE SOFTWARE USED ...................................................... 12
 4.1. Setup and economics ....................................................................................... 12
 4.2. Electric load – Electric Vehicle charging ........................................................ 12
 4.3. Utility ............................................................................................................... 12
 4.4. Data for Renewable Energy resources ............................................................. 13
 4.5. Components ..................................................................................................... 13
 4.6. Results .............................................................................................................. 13
5. MODELLING ......................................................................................................... 14
 5.1. Locations chosen.............................................................................................. 14
 5.2. Electric Vehicle chargers profile model .......................................................... 15
 5.3. Utilities setting ................................................................................................. 17
 Utility in Spain ......................................................................................... 18
 Utility in Sweden ...................................................................................... 19
 5.4. Renewable energy resources of the model....................................................... 21
 Solar resource ........................................................................................... 21
 Wind resource ........................................................................................... 21
 5.5. Components of the model ................................................................................ 21
 Photovoltaic panels ................................................................................... 21
 Wind turbines ........................................................................................... 22
 Battery storage .......................................................................................... 22
 Converter .................................................................................................. 23
 5.6. Overview of the costs per technology .............................................................. 23

 viii
6. RESULTS................................................................................................................ 24
 6.1. Briviesca station (Spain) .................................................................................. 24
 Possible sellback in Briviesca, Spain ....................................................... 24
 Sellback not possible in Briviesca, Spain ................................................. 29
 Sensitivity analysis for Briviesca, Spain .................................................. 29
 Cost-effectiveness of battery storage in Briviesca, Spain ........................ 31
 6.2. Spekeröd station (Sweden) .............................................................................. 32
 Sensitivity analysis for Spekeröd, Sweden ............................................... 36
 Cost-effectiveness of battery storage in Spekeröd, Sweden ..................... 37
7. SUGGESTED IMPLEMENTATION ..................................................................... 38
 7.1. Briviesca (Spain).............................................................................................. 38
 7.2. Spekeröd (Sweden) .......................................................................................... 39
8. DISCUSSION ......................................................................................................... 41
 8.1. Charging profile discussion ............................................................................. 41
 8.2. Grid limit discussion ........................................................................................ 41
 8.3. Other general discussions ................................................................................ 42
 8.4. Spanish results discussion ................................................................................ 42
 8.5. Swedish results discussion ............................................................................... 43
 8.6. Comparison of the Swedish and Spanish results ............................................. 43
 8.7. Survey results discussion ................................................................................. 44
9. CONCLUSIONS ..................................................................................................... 45
 9.1. Limitations ....................................................................................................... 46
 9.2. Implications for future practice ........................................................................ 46
 9.3. Future work ...................................................................................................... 46
BIBLIOGRAPHY .......................................................................................................... 47

 ix
LIST OF ABBREVIATIONS

AC – Alternating Current
BESS – Battery Energy Storage System
CAPEX – Capital Expenditure
CCS – Combined Charging Standard
CPO – Charge Point Operator
DC – Direct Current
DSO – Distributor Service Operator
EV – Electric Vehicle
GHI – Global Horizontal Irradiance
HPC – High Power Charging
HV – High Voltage
ICE – Internal Combustion Engine
Li-ion – Lithium-ion
LV – Low Voltage
LVDB – Low Voltage Distribution Board
MaaS - Mobility as a Service
MSP – Mobility Service Provider
MV – Medium Voltage
OEM – Original Equipment Manufacturer
O&M – Operation and Maintenance
PV – Photovoltaic
PVGIS – Photovoltaic Geographical Information System
RE – Renewable Energy
1. INTRODUCTION
Among all challenges that our society has for climate change, reducing the emissions
from road transportation is one of the most important ones. Electric Vehicles (EVs) are
key elements to reduce CO2 emissions as well as to improve air quality in metropolitan
areas. However, for making the transition possible from internal-combustion engines
(ICEs) to electrical, charging infrastructure is needed. Home or work charging at low
power is the easiest and cheapest way to charge an EV and does not imply as many
challenges as fast charging infrastructure. Fast charging is used for long distances travels
as well as for people that cannot charge at home. Because of the lower range of EVs
compared to ICEs cars, stops every 200-300 km are needed when travelling with EVs.
Therefore, a network of High Power Charging (HPC) stations is vital to make long
distance travelling almost as fast as vehicles with combustion engines, but with a much
lower environmental impact. On-site renewable energy (RE) supply for HPC stations is
a way to both reduce the cost for high power charging and reduce the CO2 emissions from
the electricity generation. Finally, from a customer perspective, it will be friendlier as the
final user will see that the energy he is consuming comes directly from RE sources. In the
same way it will give more reasons to the public to switch to EVs.

1.1. Background
The author became interested in electromobility back in 2018 when he wrote the Bachelor
Thesis titled Implementation of fast charging points for EVs in a service station at
Universitat Politècnica de Catalunya. The conclusions of the Thesis were that it is cost-
effective to install a fast-charging station in a service station that has a significant traffic
flow and that seemingly minor factors such as the possibility to pay by credit card or the
coverage of the charging area with a canopy are very important to improve the user
experience. Then it was found that stations with at least two chargers and not single
points, need to be implemented all over the country so the risk of queue is minimized. All
these factors, as well as planning a bigger electrical connection than the initially needed,
are vital to accelerate the transition to EVs.

The internship at IONITY, a European company that implements and operates HPC
stations along the major highways has given experience in the technical details needed
for this type of stations as well as with the permitting procedures in Spain. Moreover, it
has deepened with the features of the hardware suppliers as well as with the advance of
the implementation in Europe and particularly in Spain. Back in 2018, there were only
fast charging publicly owned points, while now private companies are starting to install
them. Lastly, since the presentation of the Bachelor Thesis there has been a close contact
with the EV user association of Spain (AUVE) and this has helped to see the customer
experience when charging.

Other research in this field performed by Domínguez-Navarro et al. [1] showed that
integration of renewable energy in a fast-charging station can improve its profitability,
but it needs a connection to the grid or a storage system to balance the intermittence of
RE. However, the way this study used to model the EV demand was based in probabilistic
distributions, which do not follow the real ones. Then, J. Brombach, F. Mayer, J. Winkler
and others [2] revealed the possibility of integrating wind energy systems to charging
infrastructure, even though only the technical part is detailed, with a lack of the economic
viability of it and results of case studies. According to another paper of A. Khan, S.

 1
Memon and T. Sattar [3], it is technically viable to integrate solar energy to a fast-
charging station with electrical control systems.

1.2. Aim of the project
This thesis has the main goal of enabling a fast and cost-effective roll out of HPC stations
by exploring how the total cost can be reduced by:
 • Producing electricity with RE
 • Reducing the cost for grid connection when it is shared by both HPC and RE
 • Finding a cost-effective sizing of the grid connection
 • Analysing if and when on-site energy storage can reduce the overall cost

Therefore, the aim of the thesis is to find synergies which comes from combining HPC
and RE. Two cases will be studied and compared: a IONITY station in Sweden and one
in Spain.

It has been written due to the huge deployment of charging infrastructure that is already
happening and will continue to grow. In a moment where there is an important demand
of these stations it is key to profit the lowering prices of RE technology to effectively
integrate both. Technically, it will be better because the grid will not have to support that
much power and it will allow distributed zero-emission generation. Then, it can also be
economically viable as, apart of saving from the energy and part of demand charge of the
grid, it will allow to sell the not used energy back, making considerable revenues.

1.3. Limitations
The main source for the RE resources is the Photovoltaic Geographical Information
System (PVGIS) from the European Commission for the wind speed and photovoltaic
(PV) production of Spain. Regarding the PV production of Sweden, the data of Göteborg
Energi is used. There is a limitation of time records in these data: 2007-2016 in the case
of PVGIS and 2020-YTD 2021 for the data of Göteborg Energi.
The core tool used in this study is the software HOMER Grid/Pro. Hence, the results are
limited to the calibration of the model and the accuracy of the simulations of this program.
The potential costs of buying or renting the lands where the PV panels would be installed
are not considered in this study. Regarding the comparison of building a Medium Voltage
(MV) line, there the rights to be paid to the landowners to install the electrical
infrastructure are neither considered.
The potential solutions evaluated in this thesis are just some alternatives that could be
implemented in the chosen locations, although there are other multiple options that could
have been studied such as hydrogen storage.

1.4. Method
First, a literature study on previous papers discussing the topic was reviewed. Then the
objectives of the Thesis were fixed, and a plan of the tasks made.

Prior to developing a detailed model, rough calculations were done using the online
REopt tool of the National Renewable Energy Laboratory (NREL) of the United States.
Then, a search for suitable software for doing the analysis was done. Finally, after trying
different programs such as MATLAB Simulink or TRNSYS, HOMER Pro/Grid was
selected. A major advantage of this software is that it enables to input the different hourly

 2
and monthly grid rates of the utility. Then, it also has an optimizer based on the Net
Present Cost (NPC).

Once the program for doing the simulations was decided, all the data had to be imported.
Solar irradiation and wind speed hourly data were downloaded from the PVGIS tool of
the European Commission and then they were translated to a format suitable to input them
into the model. For Sweden, PV production patterns of Göteborg Energi with a time step
of 15 minutes were given. Following that, data were normalised and input to the model.
Then different hardware’s were chosen for each resource. While solar PV does not differ
that much from the different manufacturers as it is a scalable system, wind turbines of
different capacities had to be selected so a solution with a rounded number could be
found. The possible integration of a Battery Energy Storage System (BESS) was also
input to the model. Once all the technical data from the sources was added, the EV
charging load was inserted. It consists of the charging profiles that were forecasted for
2025. These ones differ from weekdays to weekends and a summer increase was also
considered.

Regarding the economic data, needed for the model, first the Cost of Acquisition
Expenditure (CAPEX) and Operation and Maintenance (O&M) costs of the elements
described above were inserted. Then, the different grid tariffs of Spain and Sweden were
added, with the real different energy and demand charges depending on the hour and time
of the year for both countries.

Prior to run the simulations, the possible capacities available for each component -solar,
wind and BESS- were inserted or optimized by HOMER depending on what was chosen.
To reduce the duration of the simulations, first different capacities were entered to the
model so the scale for each case was known. Then, simulations were run based on this
scale and the program found out the optimal limit.

The results were then verified, and more simulations were done with different grid power
limits. Moreover, a sensitivity analysis with different charging sessions per day was also
done. Finally, the results with the optimal size of PV, wind and the BESS were obtained
as well as the NPC and other economical rates.
In Figure 1.1 the procedure followed for achieving the results can be seen.

 Figure 1.1: Procedure followed for achieving the results.

 3
1.5. Outline of the thesis
This report is divided into 9 Chapters. After the introduction, Chapter 2 contains general
background information regarding HPC stations, as well as existing examples of
integration of RE in a HPC station. Chapter 3 presents the results of the survey of EV
users all over Europe. In Chapter 4 it can be found a description of HOMER Pro and Grid
software, the base tool of this study. In addition, in Chapter 5 the characteristics of the
RE integration are detailed as well as the utility tariffs and the EV charger profile
forecasted. In Chapter 6, the results from the simulations are presented, both the Swedish
and Spanish cases. Chapter 7 consists of the suggested implementation of both cases.
Finally, the discussion about the obtained results can be found in Chapter 8, while the
conclusions drawn in this study are included in Chapter 9 along with the suggested further
investigations.

 4
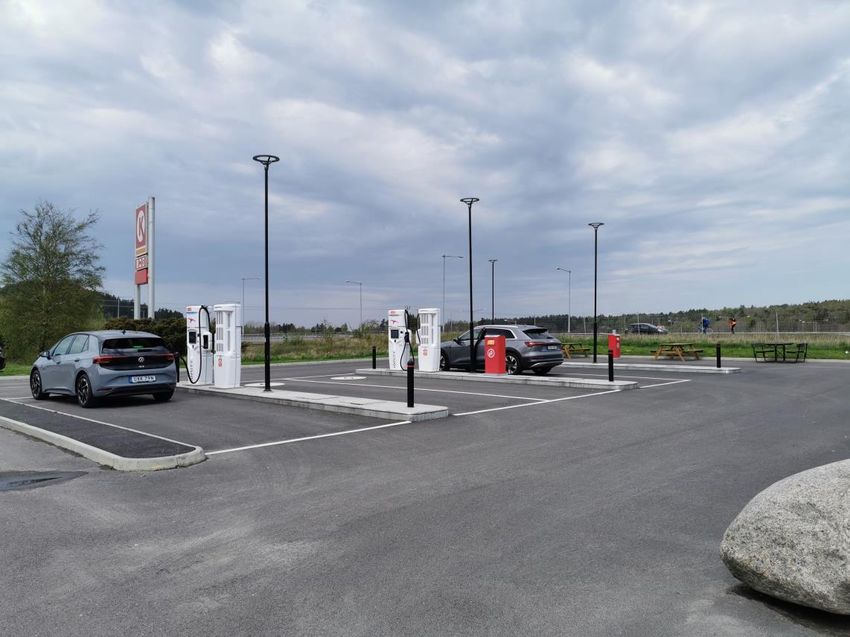
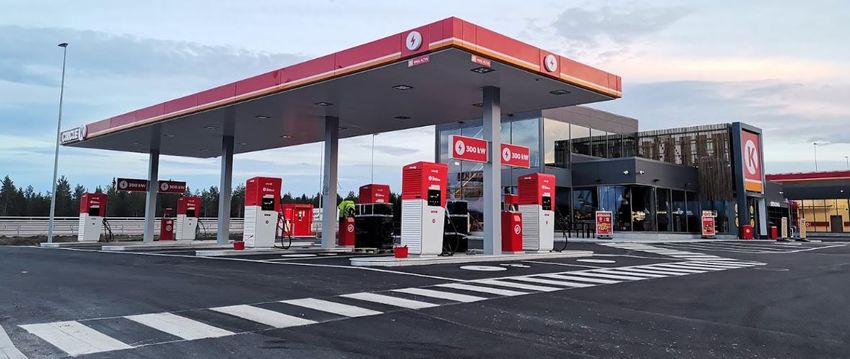
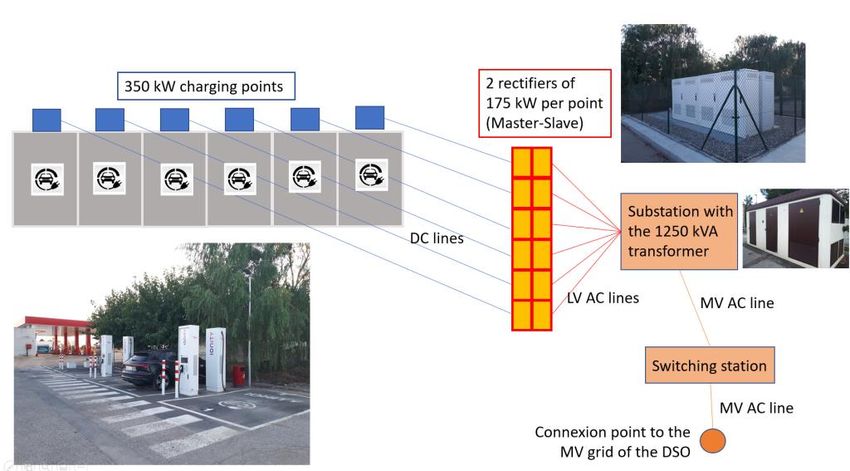
2. HIGH POWER CHARGING AND EXAMPLES

In the last years, with the accelerated launch of different EV models, the infrastructure
for charging them has also evolved. Starting with the easiest way to plug an EV -into a
Schuko 3,7 kW wall plug- until the 350 kW HPC stations, all the options have seen an
important growth.
Charging can be divided into Alternating Current (AC) charging, done usually at night or
at the workplace, with a maximum of 22 kW, and Direct Current (DC) charging, a faster
option usually used for a short stop during a long trip. This last technology is still evolving
and depends on different parameters such as the maximum power that the car can accept,
the battery size, the battery State of Charge (SoC), the ambient temperature and the
maximum output the charger can deliver.

The first DC chargers to appear were the 50 kW ones, that can be seen inside cities, in
supermarkets and service stations. Nearly all the EVs can charge at 50 kW power but the
charging time is about 1 h to have 50 kWh, which is sufficient for about 250 km of range.
One hour is still too much for a short stop done during a long trip. Therefore, to shorten
the charging times, chargers with more than 100 kW of power have been rolled out in the
market since 2018. At the same time, Original Equipment Manufacturers (OEMs) have
prepared their new EVs to be capable of reaching charging powers of 100 kW or more.
However, to protect the battery, the maximum power is only achieved in low SoC and
then it decreases even if the charger can deliver more. This is critical when analysing
HPC and it can be seen in Section 5.2.

Most HPC stations have two or more charging points which can deliver more than 100
kW each. For chargers of more than 175 kW, the power electronic cabinets are set apart
from the charging point itself. This element usually consists of one cable with the
Combined Charging Standard (CCS) connector1, a Human Machine Interface and a RFID
reader. The DC chargers are connected to the Internet via 3G or Ethernet so the Charge
Point Operator (CPO) can remote control them, and the user can also activate them with
an app. Concerning the electrical connection needed for these stations, it is nearly always
done via a transformer connected to the MV grid2. The size of these transformer stations
varies from 400 kVA to 2400 kVA, with common standard sizes being 630, 1000 and
1250 kVA. Then a switching station is needed to be connected to the point given by the
Distributor Service Operator (DSO). The layout of an IONITY HPC station using the
ABB hardware can be seen in Figure 2.1.

Regarding examples of integration of RE to HPC stations, there are some cases that have
been rolled out in the last years. The largest one is the charging hub of Braintree (UK)
built and operated by GRIDSERVE. It consists of 12 DC Chargers – up to 350kW, other
12 DC Chargers – up to 90kW and 6 AC Chargers – up to 22kW apart from 6 TESLA
Superchargers. It has a 200 kWp solar PV installation in its canopies and a 6 MWh BESS
with a 5 MW grid connection [4]. A recent example in the Nordic countries, very similar
to the installation proposed in this study is the newly built Circle K station in

1 Depending on the charger configuration there can be a second cable with the Japanese standard connector
CHAdeMO and a 2nd or 3rd cable with the CCS connector which can be used at the same time, sharing the
power of the charger.
2
 There are examples where back-up batteries connected to a low power LV point, have been used to feed
a HPC station in places where there is no possibility to be connected to the MV grid.

 5
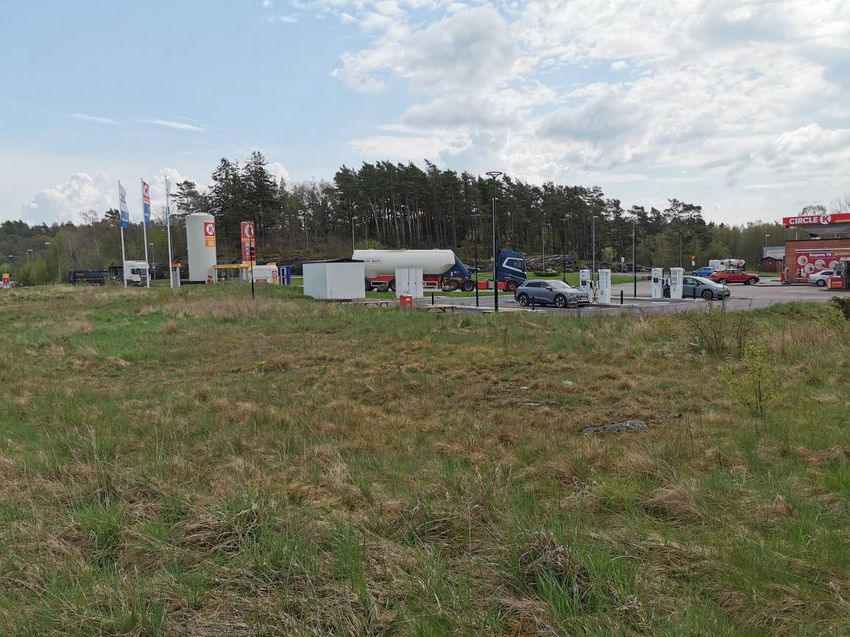
Kongsbergporten, Norway. It has six 300 kW DC chargers with dual charging cables,
which can be used by up to 12 cars at the same time. It is covered by a canopy with solar
panels on it. The canopy of the ‘usual’ gas station is also covered by PV panels and there
is also a BESS [5]. In Figure 2.2 a photo of this station can be seen.

 Figure 2.1: Layout of an IONITY HPC station using the ABB hardware.

 Figure 2.2: Photo of the Circle K HPC station at Kongsbergporten, Norway [6]

Apart from that, all Fastned stations have canopies with solar PV integrated on them,
which have an estimated capacity of 100 kWp. Then, there are other sites that are
currently being built like the Sortimo Campus Electromobility in Zusmarshausen
(Germany), which will be the largest solar filling station in the world. It will have 24 HPC
points of up to 350 kW and 120 fast charges of up to 50 kW. Transsolar developed the
net-zero energy concept for the site and evaluated it with dynamic simulation. The results
show that a 3,000 kWp PV system on the roof of the factory hall with a 1,200 kWh
Lithium-Ion (Li-ion) storage is the optimal solution for this site [7]. In France there is a
project of Kallista Energy, a leading wind turbines company, to deploy 80 HPC stations
connected to these turbines [8]. As stated in their website, hydrogen production unit
powered by wind turbines could be added depending on the progress of this technology.
Surplus energy produced by the wind turbines could later be stored in stationary batteries
too [9].

 6
3. ELECTRIC VEHICLE USER SURVEY
To get to know better the current EV users opinion of the topic of the Thesis as well as to
design the most realistic charging profiles, a survey was conducted. It was sent to different
EV users associations of Europe and got feedback of 2 of them: the Spanish EV user
association (AUVE) and the Electric Vehicle Association (EVA) of Scotland. Then, it
was also published in the Teams General channel of IONITY and in the LinkedIn and
Twitter profiles of the author. In this last one, thanks of the cooperation of the EV news
daily podcast, a bigger audience was reached. Finally, after the first launch on the 22nd of
March 2021 it was opened until the 25th of April 2021 and 293 answers were collected in
total.

3.1. Survey structure
As Figure 3.1 illustrates, it consists of 10 questions separated into 3 sections. The 2nd
section, in purple, is only entered if the user has used a fast-charging station. Then, all the
blue questions are common for everyone.

 Figure 3.1: Structure of the EV user survey with the different sections and questions.

3.2. Survey results description
A brief analysis of each question of the survey is done and showed in this section.

In Figure 3.2 it can be seen that the vast majority of drivers use their EV daily. Only a
3% of them use it once a week.
 How often do you use your EV?
 1% 3%
 22% 2-3 times a week
 Daily
 Monthly
 Only weekends
 74% Weekly

 Figure 3.2: Results of the question of how often your EV is used.

 7
As it is stated in Figure 3.3, a major part of the users has the CCS European standard
connector. Only a 14 % of them have the CHAdeMO -Japanese- one, while a 6 % does
not have any. Finally, a 7 % have the Tesla type 2 DC connector of Model S and X.

 What type of fast charging connector does
 your vehicle have?
 CCS (European standard,
 7% mainly all the new cars have
 6% it)
 CHAdeMO (Nissan, Lexus,
 old Citroëns and Peugeots)
 14%

 None (includes Type 2 43
 kW Renault Zoe)
 73%
 Tesla Model S/X

 Figure 3.3: Results of the question regarding the type of fast charging connector of the vehicle.

Figure 3.4 illustrates that a major part of the use of fast charging stations is done when
travelling long distances. However, nearly a quarter of the drivers who answered the
survey, use them once a week or more. Then there is a 3 % that say their EV cannot fast
charge and a 4 % who has never used one. These users will not be answering the following
section.

 How often do you use fast charging stations?

 3-4 times per week
 7% Daily
 Weekly
 1% In the weekends
 16% 4%
 My EV cannot
 fast charge
 3%

 Never used
 one, nor a HPC
 Only when travelling station
 long distances 4%
 65%

 Figure 3.4: Results of the question regarding the frequency of use of fast charging stations.

Next four questions: section of use of fast charging stations (273 answers)

As it can be seen in Figure 3.5, more than a half of the survey respondents only use HPC
stations when travelling long distances. A 10 % of them uses HPC at least once a week.
It is interesting to point out that a 37 % of the drivers have never used one.

 8
How often do you use HPC stations?
 3-4 times per week Daily In the weekends
 3% 0% 1%
 Weekly
 6%
 Never used one
 37%
 Only when
 travelling long
 distances
 53%

 Figure 3.5: Results of the question regarding the frequency of use of HPC stations

The hour when the users polled mostly use HPC stations is seen in Figure 3.6. This result
is not very reliable as this might change depending on the route and holidays. However,
it can be extracted that the majority of them use it by midday and then there is a little peak
by 18 h.
 When do you mostly use HPC stations?
 50

 40
 N. of answers

 30

 20

 10

 0
 0 2 4 6 8 10 12 14 16 18 20 22
 Hours of the day

 Figure 3.6: Results of the question regarding the time of use of HPC stations.

Figure 3.7 shows the mean State of Charge (SoC) of the battery when arriving to a HPC
station. It is interesting to see that the majority of the answers are between 15 % and 27%,
with a mean of 22,5 % because it shows that drivers will profit of a high charging power,
which is achieved in lower SoCs.

 Figure 3.7: Results of the question related to the State of Charge of the battery when arriving to a
 HPC station.

 9
The graph in Figure 3.8 shows the average fast charging power of the EVs the participants
to the survey chose. The major part of the powers range between 45 and 130 kW. The
mean is 77,6 kW.

 Figure 3.8: Average fast charging power based on the question regarding the model of EV the
 surveyed users have.

Section of use of fast charging stations ends

Figure 3.9 indicates the aspects the drivers surveyed value the most when using a HPC
station. Depending on the preference they chose, a score was given. It results that the
most voted is location and then availability followed by price. In number 4 the use of
renewable energy sources, number 5 services available and finally in number 6, the less
valued, the canopy covering the charging spots.
 Aspects more valued when using a HPC station
 2500
 Score based on preferences

 2000

 1500

 1000

 500

 0
 Location Availability Price Use of Services Canopy
 (not having to renewable available covering the
 queue) energy (café, toilets) charging spots
 sources
 Figure 3.9: Results of the question regarding the aspects more valued when using a HPC station.

 10
As Figure 3.10 indicates, nearly all the drivers would prefer charging in a renewable
energy powered HPC station if they had the opportunity to do it.

 Would you prefer charging in a renewable energy
 powered HPC station if you had the opportunity
 to do it?

 No, for me the
 energy used for
 charging does
 not impact my
 decision of where
 to charge
 Yes 9%
 91%

 Figure 3.10: Results of the question regarding the preference of charging in a RE powered HPC
 station.

The last questions the users polled had to answer was if a canopy covering the charging
area would impact the decision on where to fast charge. As seen in Figure 3.11, one third
of the drivers say it is always important to have the car covered and another third states
that only when it rains or snows. Finally, the remaining 30 % of them say the canopy is
not important when charging.

 Would a canopy covering the charging area impact
 your decision on where to fast charge in case you
 had different options available?
 Never, for me the
 Yes, it is always important canopy is not important
 to have the car covered, when charging
 especially in summer so 30%
 the temperature of the
 cabin does not increase
 35%

 Yes, but only if
 it rains/snows
 35%

 Figure 3.11: Results of the survey regarding the importance of a canopy when fast charging.

To sum up, the survey verifies the hypothesis that drivers prefer charging in a RE powered
HPC and that more the half of them only uses these stations for travelling long-distances.

 11
4. DESCRIPTION OF THE SOFTWARE USED
After trying different programs to simulate the energy system, the HOMER software was
chosen. Originally developed at the National Renewable Energy Laboratory (NREL) of
the United States, HOMER software provides insight into the complexities and trade-offs
of designing cost effective, reliable microgrids, driving informed decision making so the
design of systems with confidence. The advantages of the program are the following.

 • Simulates real-world performance and delivers an optimized design.
 • Quickly and efficiently determines least-cost options.
 • Combines engineering and economics in one powerful model.

This software has two different programs HOMER Pro and HOMER Grid. HOMER Pro
is made for modelling distributed generation. Its primary focus is on microgrids or multi-
generator island or village utilities, but it can also model unreliable grids, grid extension,
and a broad array of control strategies. HOMER Grid is designed to meet an increasingly
important modelling challenge that is not handled by HOMER Pro: minimizing demand
and time of use charges for Behind-The-Meter projects, from solar plus storage to more
complex systems including wind, backup generators, and combined heat and power [10].

4.1. Setup and economics
The first step to start with the modelling is entering a location so the program knows
where to download data. The location can be specified with geo coordinates. Then the
economic parameters of the discount and inflation rates as well as the project lifetime are
set.

4.2. Electric load – Electric Vehicle charging
An electric load can be imported from a file or modelled with some specifications. In
HOMER Pro it is possible to choose the bus where the load will be connected: AC or DC.
Then, there is a very useful module in HOMER Grid about EV charging. After setting the
number of chargers and the maximum power they can deliver, the charging sessions can
be modelled. This is done by inputting the different types of EVs with their percentage of
population, their maximum charging power and the charging duration.

The daily number of sessions hour-by-hour can be modified per month and differing from
weekdays and weekends. Then, a variability of the charging duration, energy delivered,
day-to-day and time-step can also be entered. Based on these variations, the exact minute
the car arrives will be assigned randomly within the specified hour. Moreover, for every
specified session, a random electric vehicle will be drawn from the EV population inputs.
[11].

4.3. Utility
The detailed tariffs of the electric utilities can be entered. These can be chosen from the
database (for US and Canada), built by entering simple rates or inserted from the tariff
library. In this case, the detailed model can be input with all the specific rates of demand
and consumption. The detail can go as far as with different hourly rates for every month
and if there are different rates per hours, an external file can be imported. Furthermore,

 12
the taxes can be set as well as the holidays, which are important to consider because the
rates are then different than from a weekday.

4.4. Data for Renewable Energy resources
The program allows to enter different types of energy resources: Global Horizontal
Irradiance (GHI), PV production, temperature, fuels and wind speed.
The resources can either be downloaded from the Internet in the same program (data from
NASA) or imported in a csv file. When there are downloaded values in the monthly solar
radiation table, HOMER builds a set of 8760 solar radiation values, or one for each hour
of the year. HOMER creates the synthesized values using the Graham algorithm, which
results in a data sequence that has realistic day-to-day and hour-to-hour variability and
auto-correlation [12]. On the other hand, an imported file can have a time step from 1
hour to 1 minute.

4.5. Components
After inputting the energy resources, the components, that are the hardware used to
transform energy resources to electricity can be entered. These are the solar panels, the
wind turbines, the storage, the converter, and the generator. They can be chosen from a
catalogue with the different capacities available in the market. The cost for the
components can be entered distinguishing between the CAPEX, the cost of replacement
after a specified lifetime, and the O&M costs. However, the power dimension that the
program uses for the simulation does not have to be the one of the chosen components.
Instead, the actual size used in the simulation can either be specified by the user or the
HOMER Optimizer can be allowed to select the optimal size.

4.6. Results
HOMER calculates the most optimal solution based on the Net Present Cost (NPC), with
cash flow calculations. Apart from viewing the most optimal system, the other
combinations with the different components entered can also be seen in a table. The
results are displayed in several ways, such as the aforementioned table, which contains
the architecture chosen, the cost of the system, a comparison of the economics and then
the characteristics of each component like the capital cost, the production and the O&M
cost. For each tariff of the utility there is the demand and energy cost, and the energy
purchased and sold.

The HOMER program also provides several simulation details, in different tabs that
include graphs where many details can be seen for example the cost summary, the cash
flow or the electrical production and consumption. Furthermore, a time series plot is
displayed with detailed information regarding the hourly energy consumption and energy
supply. From there, different loads and resources can be shown.

Finally, an optimization report can also be created by HOMER. This one, compares
different system categories for a sensitivity.

 13
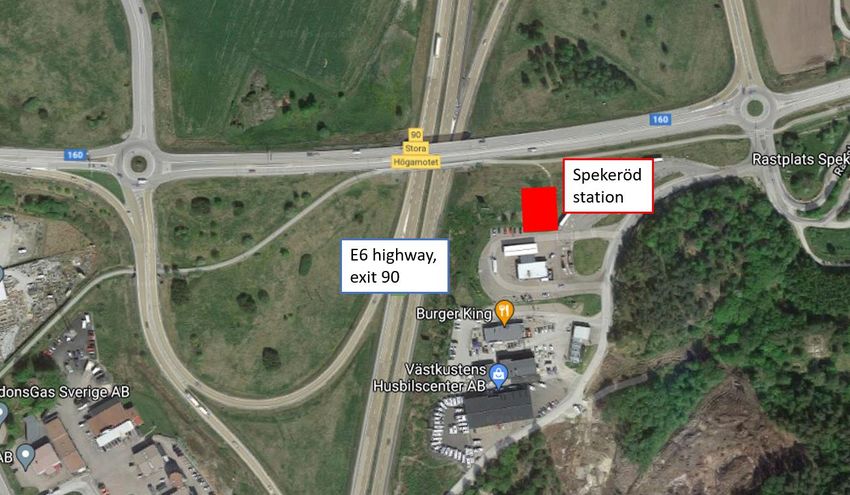
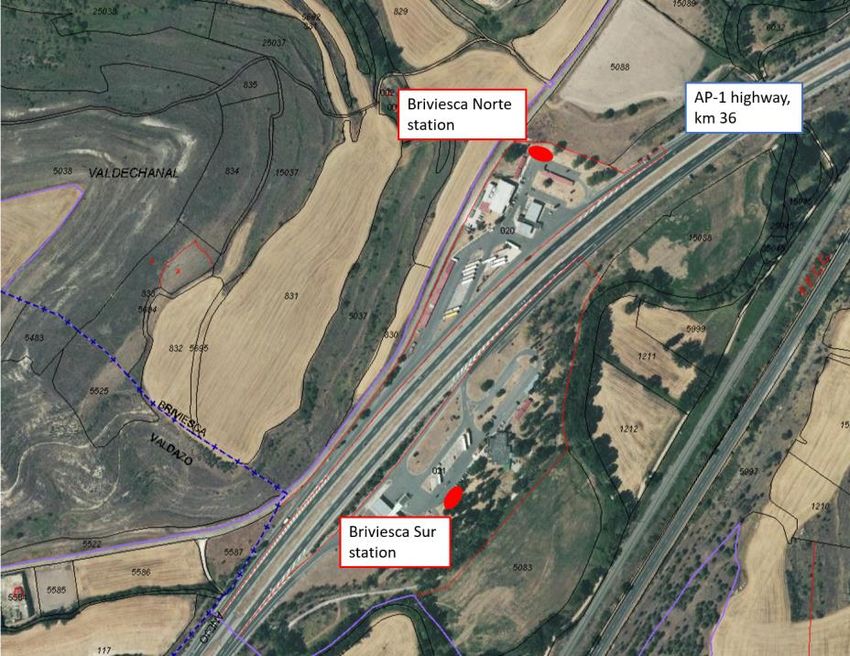
5. MODELLING
In the following section, the locations chosen for the case studies are specified. Then, the
charging profile model used for the load is explained, as well as the detail of the grid
utilities in both countries. The origin and treatment of the energy resources data is
described too. Next, both the technical and economic aspects of the components used,
such as PV panels or wind turbines are detailed. Finally, the economics of the model are
stated.

5.1. Locations chosen
For each country, a HPC station has been chosen to apply the model. In the case of Spain,
the two IONITY Briviesca stations that are currently under construction have been
selected because they will have a high traffic in the route Madrid-Bilbao-French border
at the AP-1 highway. There is one station on each side of the highway, at the State-owned
service areas. The surrounding fields seem good for installing a PV plant. Figure 5.1
shows the location of both stations. They are located 281 km from Madrid and 116 km
from Bilbao. 130 km South of Briviesca, in the same highway to Madrid, the IONITY
Milagros station is already installed and will be in operation soon.

 Figure 5.1: Location of the IONITY Briviesca stations [13].

Regarding Sweden, the IONITY Spekeröd station that is already in operation has been
chosen due to its good location at the E6 highway, close to Gothenburg (42 km) when
coming from Oslo, Norway (251 km). This route can be done hassle free by an EV,
charging here, 118 km North in IONITY Strömstad and 64 km South of Oslo in IONITY
Rygge. The station studied in Spekeröd is located at the Circle K station and has a drive
through access with 4 Tritium 350 kW chargers installed and 8 more parking spaces
prepared for future expansion. Figure 5.2 shows the location of the station.

 14
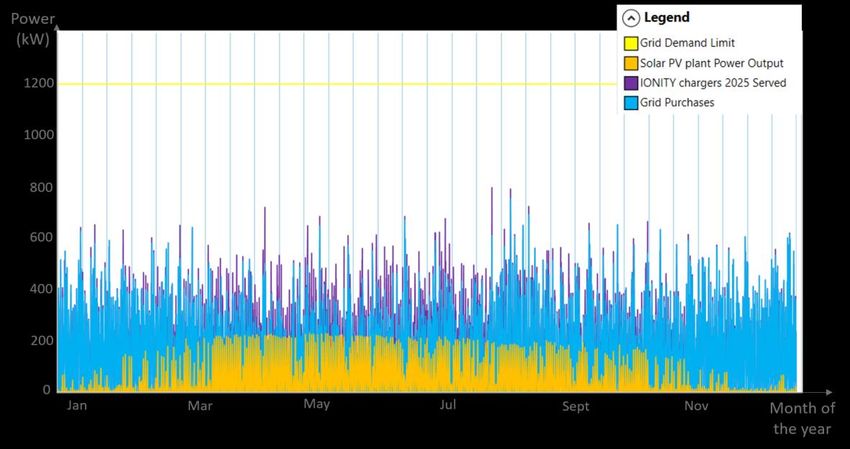
Figure 5.2: Location of the IONITY Spekeröd station [14]

5.2. Electric Vehicle chargers profile model
EVs are currently in the early stage of the market but trends suggest that they may
eventually replace conventional ICE vehicles almost completely. Of course, in some
markets like Norway, the Netherlands, Sweden, or Germany it is already growing very
fast while in others like Spain or Greece the growth is still slow. However, for this study
it does not make sense to pick up the current EV charging profile because, firstly, the
number of sessions per day are still very low and, secondly, the charging power of cars
and battery capacity will be increasing in the coming years. Therefore, a single forecast
of the charging profiles for 2025 is done for both stations.

6 chargers of 350 kW of output power were considered for all the simulations, as it is the
standard IONITY currently has.

The charging profile consists of two parts: The first is the number of sessions per hour,
day and month of the year. The second is a description of the charging session itself, with
the energy delivered, and the charging power as a function of time. Even if these last three
parameters are related to each other, they all need to be described to be able to simulate
the charging sessions.
 • Charging power is important for demand calculations both from grid and from the
 RE installation.
 • Time is vital to see if cars do queue.
 • Energy is key for consumption calculations and like how much RE is needed.

Consequently, the data was forecasted considering different sources: the hourly
distribution of sessions at Fastned stations [15] and the charging time and power of
different EVs from EVdatabase.org [16].

The HPC capable car population that can be observed in Table 5.1 was considered for
2025. The electric urban vehicles are not considered, nor the commercial ones. Trucks
and buses have not been considered as for the moment IONITY does not have plans for
them. The average fast charging power has been considered instead of the maximum
because the probability that 6 cars enter a HPC station in a low SoC that enables them to

 15
charge at their peak power is low. Another reason is that this maximum power is usually
achieved in only some minutes and the time step of the program is of 15 minutes. All data
is from EVdatabase.org except the grey-shaded which is predicted. The duration of a
charging session from 25 % to 80 % is considered because of the survey results, adapting
the value of EVdatabase.org which is from 10 % to 80 % and estimating the time for the
other cases.

 Table 5.1: Average fast charging power of the HPC capable population forecasted for 2025.

 Avg fast Energy
 Battery usable Duration
 Car model charging power Weighing charged
 capacity (kWh) (min)
 (kW) 10-80 % (kWh)
Porsche Taycan 183 1% 83,7 15 45,75
Audi e-tron GT 175 2% 85 13 37,92
Mercedes EQS 150 2% 107,8 20 50,00
Kia EV6 185 5% 77,4 15 46,25
Hyundai IONIQ
 140 10 % 72,6 15 35,00
5
VW ID.5 150 15 % 60 20 42,00
Nissan Ariya 90 10 % 63 25 37,50
Peugeot xxx 100 15 % 60 25 41,67
Tesla Model Y 170 17 % 72,5 18 50,75
BMW i4 120 5% 80 20 40,00
VW ID.3 78 18 % 58 24 31,20
TOTAL 100 %

Therefore, the weighted average charging power and energy charged are of 127 kW and
40,57 kWh respectively.

Then, having the percentage of charging sessions per hour from Fastned, 68 sessions per
weekday and 100 per weekend day were input for 2025 after calculating the optimal
number for 6 chargers in the station. As for the economics results, a 20-year project
lifetime is considered, the number of charging sessions per day is forecasted on a long-
term scenario. In Spain, the market is still in the early adopter phase so the probability of
reaching 68 sessions/weekday in 2025 is very low, even though for 2035 it might be
realistic.

It has to be added that the Fastned distribution of charging sessions was slightly modified
for all weekends and August, because people travel more during these periods.

In Figure 5.3 it can be seen that the data collected from the survey does not differ that
much compared to the one of Fastned. In general, it seems that a survey is perhaps not a
good way of determining a charging profile, as the respondents seem to assume a more
concentrated charging behaviour than the data from Fastned suggest. Especially many
users say that they will charge in weekends at 12 h and in weekdays at 18 h, but data
suggests it is much more spread out in time.

 16
20%
 Survey answers
 18%
 Fastned data
 16%
 % of charging sessions

 14%
 12%
 10%
 8%
 6%
 4%
 2%
 0%
 0 1 2 3 4 5 6 7 8 9 10 11 12 13 14 15 16 17 18 19 20 21 22 23
 Hour of the day

 Figure 5.3: Charging sessions per hour comparison of Fastned data with the survey answers.

Then in Figure 5.4 the average number of sessions per hour in weekdays and weekends
including August can be observed.
 9
 Weekdays Weekends
 8
 7
 6
 5
 4
 3
 2
 1
 0
 0 1 2 3 4 5 6 7 8 9 10 11 12 13 14 15 16 17 18 19 20 21 22 23
 Hour of the day
 Figure 5.4: Average number of charging sessions per hour in weekdays and weekends including
 August. This profile has been used for both stations.

Finally, the car models with their population weighing, the average charging power and
the charging duration were entered in the EV Charging module of HOMER. A variability
of 20 % was set for charging duration and day-to-day. A 10 % timestep variability was
also entered. These values are the ones HOMER has as default.

5.3. Utilities setting
The utility demand and consumption rates are stated below for each country. Since the
boom of renewables some years ago the national electric systems are starting to allow to
sell the produced electricity to the grid. For this reason, both countries studied have
different systems to have revenues from the grid and they will be considered as they play
an important role for the cost-effectiveness of the solution.

 17
Utility in Spain
In Spain electrical tariffs are the same in all parts of the mainland. From the 1st of June
2021, for MV connections between 1 kV and 36 kV tariff 6.1TD applies. This will be the
one considered in the model because for a HPC station there is usually the need of an MV
connection, as Low Voltage (LV) ones are usually only used for connections of a
maximum of 100 kW in Spain.

Tariff 6.1TD has 6 different periods both for power and energy fees that change every
hour and month of the year as it can be later seen in Figure 5.5. P1 is the most expensive
period whereas P6 is the most economic one. This runs always during night (00-08 h),
weekends and national holidays [17].

In Table 5.2 the prices of the 6.1TD tariff are shown. All the tolls and charges are included
as well as the commercial part for the energy fee, that depends on the selected company.
In this case the prices of Som Energia [17] are used as it is one of the only companies that
publish the prices for this 6.1TD rate. The monthly power fee is a fixed charge related to
the power contracted while the energy fee varies.

 Table 5.2: Power and energy fees for the Spanish 6.1TD tariff of Som Energia

 Period Monthly power fee [€/kW] Energy fee [€/kWh]
 P1 2,50979137 0,135
 P2 2,128331918 0,119
 P3 1,225409507 0,099
 P4 0,994064301 0,085
 P5 0,323725479 0,073
 P6 0,173317233 0,069

For EV public charging points, in June 2021 a new tariff (6.1 TDVE) will be implemented
[18] that lowers the power fee and increases a bit the energy fee. As this new tariff will
last until 2023 to incentivise the installation of fast and HPC points, it is not considered
for the results in the forecasted horizon: 2025-2045.

Regarding the remuneration fees for electricity production, the price that Som Energia
has published in its website for the 6.1TD tariff [17] will be used that is of 0,051 €/kWh.

Then a 5,11 % electricity tax should be included as well as the general 21 % VAT tax
(IVA). However, as other elements have been entered without taxes, these are not input
to the program.

These rates have been entered into the program thanks to the Advanced Builder of the
Utility Tariff Library. For the demand, in Spain the power needs to be contracted before
and cannot be changed in a year. In tariff 6.1TD a different power for each period can be
contracted as long as the following equation is true: P1
HOMER Pro can be seen. At HOMER Grid the same thing was done but with a bit
different interface.

 Figure 5.5: Consumption rates during a year for Spain in the 6 different periods

 Utility in Sweden
Sweden has a different system for the distribution charges and for the energy ones. In the
first case it depends on the location of the connection if it is in the North or the South.
The southern zone is considered as it is the most populated one and the one where the
case study station is located.

According to Vattenfall Eldistribution AB [19] for a High Voltage (HV) tariff like N3 in
the Southern area of Sweden, the components of the electricity bill are the ones stated in
Table 5.3.
 Table 5.3: Distribution fees for the N3 tariff of Vattenfall Eldistribution AB

 Component Cost in SEK Cost in €3
 Fixed charge 2.400 SEK per month 235,83 € per month
 Power ‘normal’ fee 27 SEK/kW per month 2,65 €/kW per month
 Power ‘winter’* fee 55 SEK/kW per month 5,4 €/kW per month
 Transmission ‘winter’* fee 0,189 SEK/kWh 0,0186 €/kWh
 Transmission ‘normal’ fee 0,066 SEK/kWh 0,0065 €/kWh
 *‘Winter’ fee: weekdays (except when public holiday) from 6 to 22 h during the months of January,
 February, March, November and December.

Then, for having the energy price, the hourly price needs to be added as well as the tax.
The hourly price is determined by Nord Pool Group and varies from hour to hour
depending on the demand and supply that hour. For the stations in Sweden the zone SE3
will be considered as it is the one of Gothenburg and the Spekeröd station, see Figure 5.6.
There is also a supplemental surcharge of the grid company of 0,0078 SEK/kWh (0,00077
€/kWh3). Then a 0,356 kr/kWh (0,0348 €/kWh3) tax of Skatteverket (Swedish Tax
Agency) needs to be added.

3
 Exchange rate: 1 € = 10,176 SEK, 26/03/2021

 19
Figure 5.6: Different areas of the Nord Pool market

According to Vattenfall Eldistribution [20] 4 , the reimbursement for own electricity
production (when producing less than used in a calendar year) for HV connections in the
South of Sweden is as follows in Table 5.4. Finally, the general 20 % VAT should be
added, but as it is explained in the case of Spain, it is not considered.

 Table 5.4: Reimbursements for electricity production in Sweden

 Component Revenue in SEK Revenue in €3
 Energy compensation ‘winter’* time 0,10 SEK/kWh 0,01 €/kWh
 Energy compensation other time 0,028 SEK/kWh 0,0027 €/kWh
 *‘Winter’ fee: weekdays (except when public holiday) from 6 to 22 h during the months of January,
 February, March, November and December.

All these fees have been added to the Tariff Builder of HOMER Grid. The hourly energy
price of 2020 has been downloaded from Nord Pool website [21] and input it to the
program. In Figure 5.7 the distribution of the different rates for demand can be seen.
There is no graph for the energy tariff as it varies hourly.

 Figure 5.7: Distribution of the different rates for demand during a year in Sweden

4
 The terms presuppose that the customer is a withdrawal customer. This means that the main purpose of
the customer facility is something other than production, e.g. residential, agricultural or industrial.

 20
5.4. Renewable energy resources of the model
Solar and wind resources are input to the model to allow the optimizer to use solar PV
and wind power for the solution.

 Solar resource
Regarding solar resource in Spain, it has been entered data of the hourly production mean.
This has been downloaded from the PVGIS website of the European Commission, that
seems to be the most reliable source for it. This data already takes into account the effect
of clouds as it is based on satellite images which are used to identify the presence and the
thickness of clouds [22]. Concretely, the PV production hourly values from 2005 to 2016
of a 1200 kWp plant with 14 % system losses [22] have been downloaded from the
PVGIS-SARAH database for Briviesca location. Then the mean of the 12 years has been
calculated and imported to HOMER.

The data used for the solar resource in the simulations done for Sweden are directly the
PV production patterns of a large PV installation that Göteborg Energi has within its
operational area. It is important to highlight that thanks to this approach the results are
much more realistic because it already considers variables that could interfere with the
solar irradiation data such as snow covering the panels and shadows. As Gothenburg is at
42 km South from Spekeröd, the values are considered valid to use for the station.
The “raw data” consists of the percentage of PV production in a 15-minute time step from
May 2019 to February 2021. As the program only accepts 1 year of data it has only been
considered the 2020 15-min production and the pattern in this interval has been imported
to HOMER.

 Wind resource
For wind speeds, the same approach has been considered for both countries. The Typical
Meteorological Year (TMY) values of the hourly wind speed at 10 m from 2007 to 2016
have been downloaded from the PVGIS website of the European Commission. Then it
has been imported to HOMER.

5.5. Components of the model
The components considered for a possible solution are PV panels, wind turbines, battery
storage and a converter for the DC-AC bus.

 Photovoltaic panels
As the PV production data is directly imported, the program does not consider the
technical data of the panels. However, when downloading the data from PVGIS for the
Spanish station, the following parameters were set or calculated by the European
Commission tool.

 • Mounting type: fixed
 • Optimized slope and azimuth: 35° and 3° respectively
 • PV technology: Crystalline silicon
 • System loss: 14 %

For Sweden, the details of the Göteborg Energi installation are unknown, except that the
angle is of 30°.

 21
The Imported PV production is linked to the AC bus as the production data already
considers the inverter.

Regarding the costs, these have been considered for 2025, the same year of the chargers’
profile forecast. According to IRENA [23], solar PV installation costs would continue to
decline dramatically in the next three decades, averaging in the range of 340 to 834
USD/kW by 2030, compared to the average of 1210 USD/kW in 2018. Therefore, a price
of 700 USD/kW has been set for 2025, which is 579 €/kW5. Concerning the replacement,
this will be done every 25 years and is forecasted in an 80 % of the total installation cost:
463,2 €/kW. Finally, the O&M costs for Europe were of 9 USD/kW and year for 2017
according to IRENA [24], with a reduction of a 17 % every doubling of the capacity. In
2025 the capacity is expected to grow 30 % in Europe [23] so the costs will approximately
be reduced by 10 % to 8,1 USD/kW and year (6,7 €/kW5 and year).

 Wind turbines
In this case, as the wind speed is entered, the different types of wind turbines need to be
chosen. The 100 kW wind turbine model of Norvento and the 250 kW model of WES
were chosen as they where found to be the most suitable solutions after simulating with
other type of wind turbines. In Table 5.5 the details of each wind turbine can be seen.

 Table 5.5: Details of the two wind turbines considered in the simulations. Norvento [25] and WES
 [26]
 Manufacturer Norvento Enerxia Wind Energy Solutions
 Model nED100 WES250
 Capacity 100 kW 250 kW
 Type 3 bladed 2 bladed
 Rotor diameter 24 m 30 m
 Cut in, out wind speed 3 m/s, 20 m/s < 3 m/s, 25 m/s

Regarding the costs, these have been considered for 2025, the same year of the chargers
profile forecast. According to IRENA [25], globally, the total installation cost of onshore
wind projects would continue to decline dramatically in the next three decades, averaging
in the range of 800 to 1350 USD/kW by 2030, compared to the average of 1497 USD/kW
in 2018. Therefore, it has been set a price of 1200 USD/kW for 2025 that is 992 €/kW5.
Concerning the replacement, this will be done every 20 years and is forecasted in an 80
% of the total installation cost: 794 €/kW. Finally, the O&M costs are forecasted at 30
USD/kW and year (24,8 €/kW5 and year) according to the tendency that IRENA indicates
in [24].

 Battery storage
The generic modules of Lithium-Ion (Li-ion) batteries of 100 kWh and 1 MWh have been
considered for both models. They have a nominal voltage of 600 V, a roundtrip efficiency
of 90 % and the minimum SoC is set at 20 % to preserve the battery life. The maximum
charge and discharge currents for the 100 kWh pack are of 167 A and 500 A respectively,
whereas the ones of the 1 MWh one are the same multiplied by 10. Even though these
rates are limited by the converter capacity set.

5
 Exchange rate: 1 € = 1,209 USD $, 24/04/2021

 22
You can also read