COTAN: scRNA-seq data analysis based on gene co-expression
←
→
Page content transcription
If your browser does not render page correctly, please read the page content below
Published online 11 August 2021                                                         NAR Genomics and Bioinformatics, 2021, Vol. 3, No. 3 1
                                                                                                        https://doi.org/10.1093/nargab/lqab072

COTAN: scRNA-seq data analysis based on gene
co-expression
Silvia Giulia Galfrè 1,† , Francesco Morandin 2,† , Marco Pietrosanto                                                      1
                                                                                                                                ,
Federico Cremisi 3,4,# and Manuela Helmer-Citterich 1,*,#
1
 Department of Biology, University of Rome Tor Vergata, Via della Ricerca Scientifica, 00133 Roma, Italy,
2
 Department of Mathematical, Physical and Computer Sciences, University of Parma, Parco Area delle Scienze,
53/A, 43124 Parma, Italy, 3 Scuola Normale Superiore di Pisa, Piazza dei Cavalieri, 7, 56126 Pisa, Italy and 4 Institute

                                                                                                                                                                  Downloaded from https://academic.oup.com/nargab/article/3/3/lqab072/6348150 by guest on 21 November 2021
of Biophysics, Research National Council of Pisa, Area di Ricerca San Cataldo, Via G. Moruzzi, 1, 56124 Pisa, Italy

Received October 22, 2020; Revised June 01, 2021; Editorial Decision July 26, 2021; Accepted August 09, 2021

ABSTRACT                                                                              precedented insight into tissue cellular heterogeneity (2) and
                                                                                      developmental processes (3–5). Currently, there are several
Estimating the co-expression of cell identity fac-                                    techniques to isolate and sequence single cells (6–10). Dif-
tors in single-cell is crucial. Due to the low effi-                                  ferent methods have their own strengths and weaknesses
ciency of scRNA-seq methodologies, sensitive com-                                     and exhibit great variability in the number of cells analyzed
putational approaches are critical to accurately infer                                and in the length of sequenced RNA. Although the most
transcription profiles in a cell population. We intro-                                appropriate choice depends on the biological question of in-
duce COTAN, a statistical and computational method,                                   terest (11), droplet based techniques are the most commonly
to analyze the co-expression of gene pairs at sin-                                    used, because of their high-throughput, acceptable sensitiv-
gle cell level, providing the foundation for single-cell                              ity, good precision and affordable cost per cell (12,13).
gene interactome analysis. The basic idea is studying                                    Single cell transcriptomes can describe known cell iden-
the zero UMI counts’ distribution instead of focusing                                 tity states and uncover new ones. This is frequently achieved
                                                                                      by clustering cells with consistent gene expression (14,15)
on positive counts; this is done with a generalized
                                                                                      or more recently by cell lineage and pseudotime reconstruc-
contingency tables framework. COTAN can assess                                        tion (16). The typical pipeline requires to log-transform
the correlated or anti-correlated expression of gene                                  and normalize raw read counts, yielding ‘expression lev-
pairs, providing a new correlation index with an ap-                                  els’, and to perform multivariate analysis on the lat-
proximate p-value for the associated test of indepen-                                 ter (17,18). Unfortunately, the intrinsic low efficiency of
dence. COTAN can evaluate whether single genes are                                    scRNA-seq (8,9,12) precludes the detection of weakly ex-
differentially expressed, scoring them with a newly                                   pressed genes in many cells, in particular in droplet based
defined global differentiation index. Similarly to cor-                               experiments. This has a critical effect on the analysis of
relation network analysis, it provides ways to plot and                               expression levels, causing the appearance of dropout arte-
cluster genes according to their co-expression pat-                                   facts (19,20), and often restricting the analysis to tools
tern with other genes, effectively helping the study                                  based on zero-inflation and imputation (21–23).
                                                                                         However, the introduction of Unique Molecular Identi-
of gene interactions, becoming a new tool to iden-
                                                                                      fiers (24) greatly reduces amplification noise, and the result-
tify cell-identity markers. We assayed COTAN on two                                   ing UMI counts typically fit simple probabilistic models,
neural development datasets with very promising re-                                   thus allowing approaches not based on normalization (19).
sults. COTAN is an R package that complements the                                        Building on the opportunity given by the presence of
traditional single cell RNA-seq analysis and it is avail-                             UMIs and improving further the multinomial assumption
able at https://github.com/seriph78/COTAN.                                            verified in (19), we developed COTAN, CO-expression Ta-
                                                                                      bles ANalysis, a statistical framework and method of analy-
                                                                                      sis, which uses UMI count matrices without normalization
INTRODUCTION
                                                                                      and does not depend on zero-inflation. Rather, COTAN fo-
Single cell RNA sequencing technology was first imple-                                cuses on zeros and their joint distribution to directly infer
mented in 2009 (1). Since then scRNA-seq provided an un-                              gene relations.

* To   whom correspondence should be addressed. Tel: +39 06 7259 4324; Email: manuela.helmer.citterich@uniroma2.it
†
 The authors wish it to be known that, in their opinion, the first two authors should be regarded as Joint First Authors.
#
  The authors wish it to be known that, in their opinion, the last two authors should be regarded as Joint Last Authors.

C The Author(s) 2021. Published by Oxford University Press on behalf of NAR Genomics and Bioinformatics.
This is an Open Access article distributed under the terms of the Creative Commons Attribution-NonCommercial License
(http://creativecommons.org/licenses/by-nc/4.0/), which permits non-commercial re-use, distribution, and reproduction in any medium, provided the original work
is properly cited. For commercial re-use, please contact journals.permissions@oup.com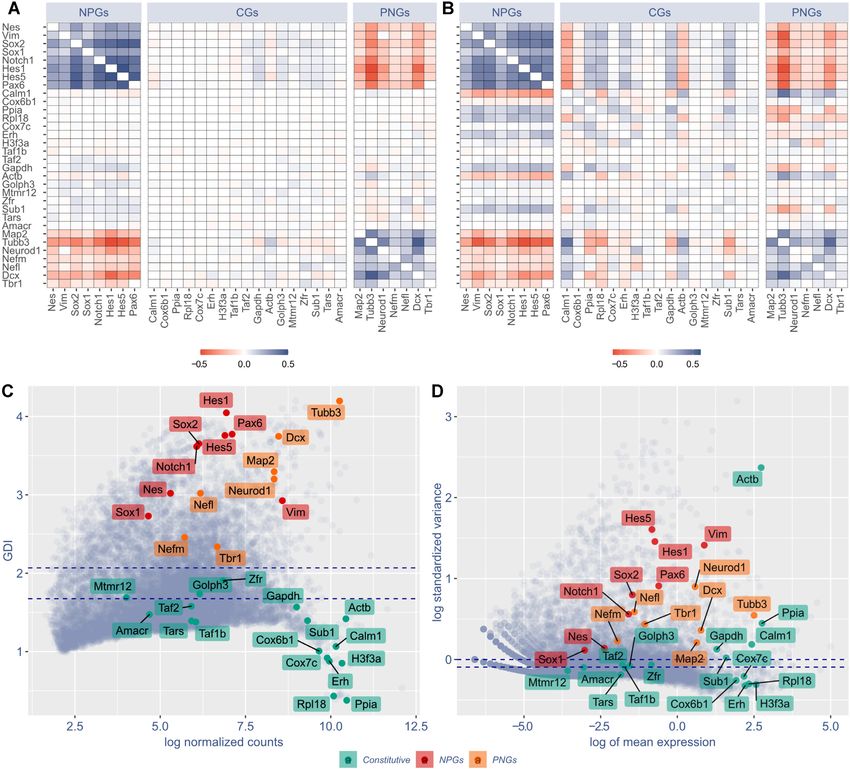
2 NAR Genomics and Bioinformatics, 2021, Vol. 3, No. 3
We tested COTAN on two neural development datasets UMI detection efficiency (UDE) c , which modulates the
as benchmarks of two of the main droplet based tech- UMI count by
niques Drop-seq (8) and 10× Genomics Chromium (9): a
mouse cortex Drop-seq dataset (4) and a mouse hippocam- Rg,c ∼ Poisson(νc g,c ).
pal 10× dataset (25). Indeed, brain embryonic structures For a uniform population of cells, g,c and Rg,c should all
display high cell diversity, with dividing multipotent pro- be independent, conditional on c . On the other hand, for a
genitor cells, newborn neurons differentiating with many mixed population of cells, g,c will be complicate mixtures
distinct identities and glial cells, all co-existing in a mixed of gamma distributions, independent in c but not in g. The
cell population. This makes them particularly suited for subsequent Poisson samplings yielding Rg,c will still be inde-
scRNA-seq studies aiming to depict cell identity states and pendent. These assumptions correspond to the large num-
relationships between gene expressions. bers approximation of the multinomial model proposed
On these datasets COTAN can effectively assess co- in (19) and are in line with similar models discussed in (29).
Downloaded from https://academic.oup.com/nargab/article/3/3/lqab072/6348150 by guest on 21 November 2021
expression and disjoint expression of gene pairs, also in case There is an arbitrary factor in the definition of and ,
of very low UMI counts, yielding for each pair a correla- so we impose that the average of c is 1. In this way, g,c
tion test p-value and a signed coefficient of co-expression has the same scale as Rg,c for the average cell, and hence it
(COEX). may be viewed as a sort of normalized virtual expression.
Notably, Pearson and Spearman correlation are more It is considered a positive random variable, with mean g
noisy and cannot be used directly for the study of gene ex- not depending on c, with unknown distribution, and inde-
pression relationships, which instead is often carried out in- pendent in c. Then E[Rg,c |g,c ] = c g,c , and the expected
directly, through cell clustering and subsequent differential UMI count is given by μg,c := E(Rg,c ) = νc λg , so in partic-
expression analysis between clusters. In fact, the numerous ular higher UDE yields a higher average library size.
available tools show significant differences especially when We estimate the model’s parameters c and g in a sim-
poorly expressed genes are not filtered out (26). The two- ple linear way (for details see Parameter estimation in Sup-
step nature of these methods might introduce biases or loss plementary material). Accuracy and precision of estimators
of information, especially for genes with low expression. were evaluated on synthetic datasets with heterogeneous cell
Moreover, the mutual exclusion for the expression of two types, for which the true values of and were known (see
genes can be hard to assess in this way. Supplementary Figure S1 and Synthetic datasets in Supple-
As a second feature, COTAN can investigate whether sin- mentary material).
gle genes are constitutive or differentially expressed in the We stress that UDE is not supposed to depend on the
population, by scoring them with a global index of differ- genes, and in fact the workflow includes a step to check this
entiation (GDI). important assumption on the data (see Software pipeline).
As a third feature, COTAN can help detecting cell-
identity markers and studying gene interactions. In fact Occurrence of zero UMI counts. The estimate of g,c =
COEX may be used in a way similar to how correlation is g c is the starting point to approximate the probability that
used in gene network analysis (27), but instead of building a Rg,c = 0. In general the population of cells is not uniform, so
network adjacency matrix, we propose a novel dimension- we cannot fix any specific model for the distribution of Rg,c .
ality reduction of the gene space and a related gene cluster Instead we make the assumption that this probability takes
analysis. a simple form, depending on one additional parameter ag ,
MATERIALS AND METHODS ag−1
ag−1
Mathematical framework P(Rg,c = 0) ≈ . (1)
λg νc + ag−1
To ease the reading, the mathematical theory is only drafted
in the main paper. A more elaborate discussion can be found This family of functions corresponds to the probability of
in the Supplementary Material. The companion mathe- zero for a negative binomial distribution with mean g,c
matical paper (28) contains further theoretical materials, and dispersion ag (X has dispersion a if Var(X) = E[X] +
including: a detailed explanation of the models for UMI a E[X]2 ). We stress that we are not assuming Rg,c to have
counts and probability of zero UMI counts; an alternative negative binomial distribution, but just that P(Rg,c = 0) de-
estimation framework based on the square root variance- pends on c and g as in (1).
stabilizing transformation; a proof that the dispersion pa- In fact the value of ag is not estimated as the dispersion
rameter can be uniquely determined; a proof that under of Rg,c , but by fitting the observed number of cells with zero
null hypothesis, COEX has approximately Gaussian distri- UMI counts (see Estimate for ag in the Supplementary ma-
bution; an extension of GPA to deal with differential ex- terial). If the population is uniform, then Rg,c would really
pression. be negative binomial with average g c and dispersion ag
(though in that case it would be better to estimate ag as the
UMI count model. For each gene g and cell c, let Rg,c de- dispersion). In all other cases g and ag encode information
note the UMI count. For a uniform population of cells, it on the occurrence of zero counts for all cell types, encom-
is reasonable to assume that these are negative binomial passing types expressing and not expressing g.
random variables, also known as Gamma-Poisson, mean- Then, given any two genes g1 and g2 and under the null
ing that R ∼ Poisson() with ∼ gamma(, ). Our model hypothesis that their expressions g1 ,c and g2 ,c are in-
is based on the assumption that cells also have a variable dependent, the expected number of cells for which both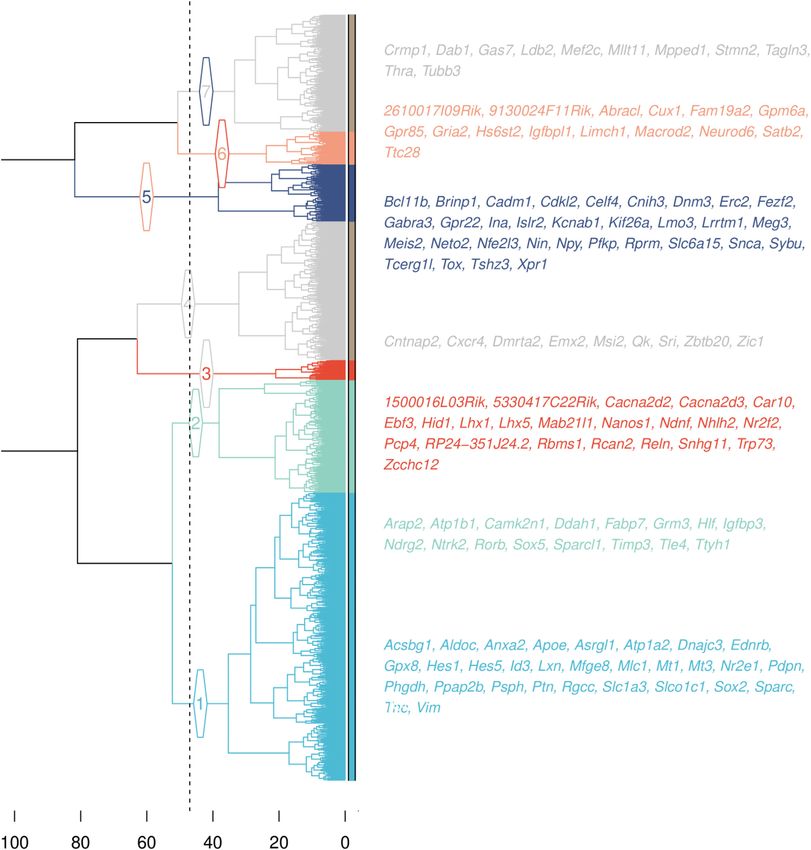
NAR Genomics and Bioinformatics, 2021, Vol. 3, No. 3 3
genes have zero UMI counts is simply 0,0 = c P(Rg1 ,c = cells in each of the four conditions (expressing both genes,
0)P(Rg2 ,c = 0) and can be estimated with Equation (1). This only the first one, only the second one or none). Constitu-
is used as expected counts in the contingency tables in Gene- tive genes that show non-zero UMI count in every cell can-
pair analysis section. not be used and are removed in this step (saving a list of
them).
The expected values of the same 2 × 2 contingency ta-
Software pipeline bles are estimated as described in Occurrence of zero UMI
We developed and tested COTAN on datasets obtained counts and stored again as four n × n matrices correspond-
with droplet based techniques and in particular on ing to the same four conditions. In the implementation, the
10× datasets and Drop-seq datasets. Figure 1 illustrates the estimation of the dispersion parameters ag is determined by
pipeline, which is detailed in this section. Analysis requires simple bisection. In the case of the
genes that would require
and starts from a matrix of raw UMI counts, after removing a negative dispersion, because c e−μg,c > #{c, Rg,c = 0},
Downloaded from https://academic.oup.com/nargab/article/3/3/lqab072/6348150 by guest on 21 November 2021
possible cell doublets or multiplets and low quality or dying we choose instead to impose a zero dispersion model (Pois-
cells (with too high mitochondrial RNA percentage). son distribution) with increased mean (1 + bg )g , yielding
P(Rg,c = 0) ≈ e−(1+bg )μg,c (see also Estimate for ag in the
Data cleaning. The first step consists in removing genes Supplementary material). This choice is consistent with the
that are not significantly expressed (default threshold is to intended universality of the approach, because no distribu-
require one or more reads in at least 0.3% of cells) or un- tion of g,c would give a negative dispersion and because
wanted (such as the mitochondrial ones). g is anyway an estimated quantity and therefore noisy. The
There is then an iterative procedure to filter out outlier positive parameter bg is encoded as −ag so that one single
cells (such as blood cells in a brain cortex dataset). In each parameter can account for both cases. The fraction of genes
iteration the UDE is estimated for all cells and UMI counts with negative ag is reported. In the typical dataset, about
are simply normalized dividing by its value. Cells are then 30% of all genes fall in this case, with values of bg no larger
clustered by Mahalanobis distance (two clusters, A and B, than 0.15 and average under 0.02. These genes are typically
complete linkage clustering) and represented on the plane constitutive genes with low GDI and UMI count compati-
of the first two principal components. The clustering algo- ble with a negative binomial distribution.
rithm detects outlier cells which will fall into the smallest
cluster B (Supplementary Figure S8A). A subsequent plot Main output. For each pair of genes, the software com-
displays the most abundant genes expressed in B, to allow putes the GPA test statistics S, the corresponding 2 (1) p-
the user to check if they are peculiar in any way (Supplemen- value, and the COEX index (see Statistical inference on co-
tary Figure S8C). The user may choose to drop the cells in B expression in Supplementary material). These are saved in
and do another iteration, or to stop the procedure, when the three n × n matrices, and the primary output of COTAN
PCA plot does not show obvious outliers (Supplementary analysis consists of the latter two.
Figure S8B–D).
After the last iteration two final quality checks are per- Computation time. The time required for the analysis is
formed on the estimated UDE of cells. Firstly the PCA plot approximately proportional to the number of cells in the
colored by UDE should not show a clear separation of cells dataset. The most demanding step is the estimation of dis-
with high and low UDE (Supplementary Figure S9A). In persion parameters, but since it is very sensible to the num-
fact, COTAN builds on the assumption that UDE is not ber of cores used, it can become much faster when many
gene-dependent (see UMI count model) and if the PCA plot cores are available. As a reference, a dataset with 5000
is polarized by UDE, this assumption might be false. Sec- cells was analyzed in about 3 min on 11 cores of an In-
ondly, the plot of sorted UDE values will show if the effi- tel(R) Dual Xeon(R) Silver 4214 at 2.20 GHz with 64GB of
ciency drops markedly for a small fraction of cells. If this RAM.
is the case, we usually want to exclude cells below the el-
bow point (see Supplementary Figure S9B and C; we re-
Seurat pipeline
mark that UDE values are normalized to have average 1,
so there is no absolute threshold for efficiency to be accept- Seurat (3.1.0) workflow was performed on E16.5 hip-
able). If cells are removed, another estimation iteration is pocampal dataset (25) following the Guided Clustering Tu-
due. torial www.satijalab.org/seurat/v3.1/pbmc3k tutorial.html
(accessed 20 February 2020), with modifications. Data im-
Tables implementation. Two genome-wide procedures port (CreateSeuratObject) was done using min.cells 3 and
compute the number of cells (observed and expected) min.features 200. The selected range for the number of fea-
in each of the conditions needed by gene-pair analysis tures was between 200 and 4000; the maximum allowed
(GPA, see Gene-pair analysis below and GPA theory in fraction of mitochondrial genes per cell was 7.5%. Normal-
Supplementary material). ization was done using the default parameters. The correla-
For each couple of genes, COTAN needs to build the 2 tion was then calculated on the whole Seurat normalized
× 2 contingency table of zero/non-zero UMI counts. If n is data matrix and the heatmap was plotted subsetting this
the number of genes in the sample, the totality of observed (Figure 2B). Figure 2D was plotted by calling the func-
values of these tables consist in n × n × 2 × 2 integers. In tion FindVariableFeatures with selection method
our implementation, four n × n matrices store the number of VST.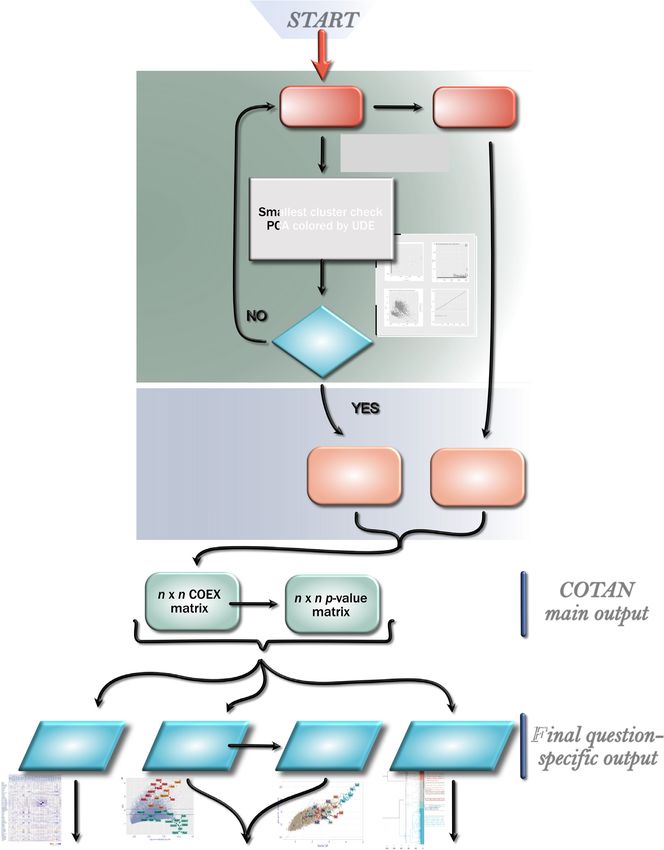
4 NAR Genomics and Bioinformatics, 2021, Vol. 3, No. 3

                                                                                                                                Downloaded from https://academic.oup.com/nargab/article/3/3/lqab072/6348150 by guest on 21 November 2021
Figure 1. Pipeline diagram.

RESULTS                                                             There are a few key concepts in COTAN (see also Mate-
                                                                 rials and Methods). They are drafted here to build a termi-
Overview
                                                                 nology for the subsequent sections, and then detailed in the
High throughput scRNA-seq methods allow the study of             Supplementary Material.
large cell populations, at the cost of suffering low expres-
sion levels. In fact read counts can be so scarce as to in-      Gene-pair analysis. Gene-pair analysis (GPA) is the core
hibit the analysis with traditional approaches of many rel-      of COTAN’s computations. It works on couples of genes,
evant genes (see Supplementary Figure S3). On the other          by comparing the proportion of cells with zero UMI counts
hand COTAN, after parameter estimation, encodes UMI              for both genes, with the expected number under the hypoth-
counts as zero/non-zero. This choice is a critical feature of    esis that the detections of the two genes are independent.
the method, with the aim to increase its sensitivity for genes   This independence holds in particular whenever one of the
with low expression level.                                       two genes is actually expressed in all cells (whether or not
NAR Genomics and Bioinformatics, 2021, Vol. 3, No. 3 5
Downloaded from https://academic.oup.com/nargab/article/3/3/lqab072/6348150 by guest on 21 November 2021
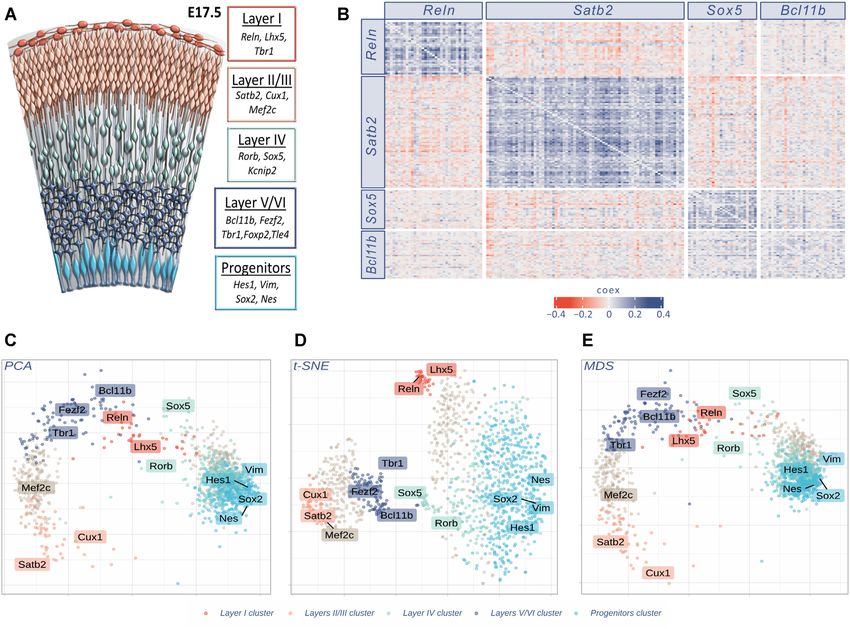
Figure 2. GPA and GDI are able to discriminate constitutive genes (CGs) from neural progenitor genes (NPGs) and pan-neuronal genes (PNGs). (A)
COTAN GPA of selected genes. Cell color encodes COEX index: blue indicates genes showing joint expression, red indicates genes showing disjoint
expression. White indicates independence, meaning that one or both genes are constitutive, or that the statistical power is too low to detect co-expression.
Since the co-expression of a gene with itself is irrelevant, the diagonal is made artificially white. (B) Pearson correlation matrix of the same selected genes as
in (A), using Seurat (34) normalized expression levels (obtained following the website vignettes – Guided Clustering Tutorial). (C, D) Comparison between
COTAN global differentiation index (GDI, C) and Seurat highly variable features (D) analysis. Red labels indicate NPGs, orange labels PNGs, green labels
CGs. Dotted blue lines correspond to the median (lowest) and the third quartile (highest). All plots refer to E16.5 mouse hippocampal cells (25) and genes
are selected to be characteristic of NPGs, PNGs and constitutive genes with both high and low typical expression.
it is detected). If instead the expression of both genes cor- els (see in Supplementary material Negative dataset analysis
relates with the same cell identity states, then there will be and Supplementary Figure S4).
evidence against independence. See GPA theory in Supple- The full potential of GPA is realized when it is performed
mentary material. genome-wide, between all pairs of genes, as this allows to
GPA outputs the p-value for this test and a co-expression extract very detailed information, as exemplified below.
index (COEX) with values in the [−1, 1] range, which es-
timates the deviation from the proportion which was ex- Differentiation indices. Genome-wide GPA tests can be
pected under independence (positive for co-expression and used to score single genes according to their propensity
negative for disjoint expression). The mathematical deriva- to show either joint or disjoint expression against other
tion of this p-value is not rigorous, so its properties were genes.
tested on negative datasets where it was found to be more Fixing a gene g and looking at the distribution of the
robust than standard correlation analysis on expression lev- p-values of g against all other genes (Supplementary Fig-6 NAR Genomics and Bioinformatics, 2021, Vol. 3, No. 3
ure S5), one can compute the global differentiation index Operatively, for each gene pair, COTAN constructs the
(GDI) of g, which is low (typically below 1.5, see Supple- observed and expected co-expression tables and then per-
mentary Figure S2) for constitutive genes and high for dif- forms the GPA, computing p-value and COEX. See also
ferentially expressed genes, thus allowing a systematic pro- Tables implementation and Main output.
cedure for detecting the latter type in the transcriptome. The two genome-wide matrices of COEX and p-values
If the same approach is restricted to the p-values of g are COTAN’s main output. Both are n × n, symmetric ma-
against genes in a subset V (i.e. of genes related to some trices, where n is the number of genes.
function), we get instead the local differentiation index rela- Starting from there, several possibilities are available.
tive to V (LDI), which is more specialized and sensitive than COEX can be directly plotted as a heatmap, for all genes
GDI for most applications (Supplementary Figure S6). or for a selection. One can compute the differentiation in-
See also Filtering differentially expressed genes in the Sup- dices (GDI and LDI) of genes to restrict attention to those
plementary material. whose expression manifestly depends on cell identity states.
Downloaded from https://academic.oup.com/nargab/article/3/3/lqab072/6348150 by guest on 21 November 2021
Finally, by restricting the COEX matrix to a rectangular
Co-expression space. The genome-wide COEX matrix can submatrix and through a suitable nonlinear transformation,
be used to embed genes in what we call co-expression space: one can embed the genes in the co-expression space and
a multidimensional representation of genes which is partic- then perform cluster analysis and dimensionality reduction.
ularly powerful for investigating relations between differen-
tially expressed genes. This is reminiscent of correlation net- GPA and GDI of mouse hippocampus
work analysis (30), in that a nonlinear transformation is ap-
plied to a correlation matrix (COEX in our case) to recover We assayed COTAN on a scRNA-seq dataset of embry-
a notion of distance between genes. onic hippocampus (25), focusing on a collection of selected
The geometry of this space is based on co-expression pat- Constitutive Genes (CGs) (31), Neural Progenitor Genes
terns: genes are close to each other when their activation (NPGs) (32,33) and Pan-Neuronal Genes (PNGs) (32,33).
is synchronized through different cell types and far apart COTAN’s GPA effectively discriminated between CGs,
otherwise. This allows genes to be effectively clustered by showing COEX near zero against all genes, and NPGs
co-expression and represented in plots, after dimensionality or PNGs, having positive or negative COEX when tested
reduction. See also Filtering differentially expressed genes in against one another (Figure 2A). Notably, each NPG pos-
the Supplementary material. itively correlated with other NPGs and negatively with
PNGs, and vice-versa, indicating COTAN capability to cor-
rectly infer joint or disjoint expression of two genes at single
cell level.
Workflow
We compared COEX to correlations coefficients com-
We implemented COTAN as an R package available on puted on gene expression levels, obtained by Seurat (34).
GitHub. Figure 2A and B compare heatmaps of COEX and Pearson
The tool should be applied on post-quality-control UMI correlation (Spearman correlation being slightly worse).
counts (after doublets and dying cells have been removed). COEX proved more accurate in discriminating between
There are two required steps to get the main output matri- CGs, NPGs and PNGs, indicating COTAN as better suited
ces, and then several options are available depending on the in analyzing the co-expression of couples of genes at sin-
question to be investigated (see Figure 1). gle cell level. To make the comparison more quantitative,
The first step is the model parameters estimation. In par- we computed the average of the absolute value of these in-
ticular, the parameters needed by the model are the UDE dices for the two cases of no correlation and correlation. For
for the cells and the mean and dispersion for the expression pairs of genes with at least one CG, the average of absolute
of genes (denoted by c , g and ag , see Mathematical frame- values of COEX was 0.0136, while it was 0.0488 and 0.0526
work). The estimation of UDE allows to make cell expres- for Pearson and Spearman correlation indices. For the pairs
sion roughly comparable and hence the user has the choice with no CG gene, it was respectively 0.213, 0.236 and 0.223.
to filter out cells with uncommon expression, with an it- This is confirmed by correlation p-values (obtained from
erative estimating-cleaning-estimating procedure (see Data GPA over 2252 cells for COTAN and from Fisher infor-
cleaning). mation over 2080 cells for correlations), with false positive
At the end a plot is displayed to assess the most important rates (p-value < 10−4 , out of 391 cases) of 1.8%, 29.2% and
assumption of the model, namely that UDE is not corre- 31.51% respectively for COTAN, Pearson and Spearman.
lated with cell differentiation in the sample (see UMI count False negative were 13, 12 and 15 out of 105 cases respec-
model and Software pipeline). tively (see also Supplementary Figure S4 for comparison on
The second step, tables creation, begins by computing the negative datasets).
probability of zero UMI counts for each cell–gene combi- We then compared GDI to the highly variable feature
nation, given the estimated parameters. These probabilities analysis of Seurat (34). GDI efficiently discriminates be-
allow to devise the GPA test, which is based on generalized tween CGs, which lay below the median (with two excep-
2 × 2 contingency tables (also indicated as co-expression tions, Golph3 and Zfr), and NPGs and PNGs, located above
tables) which collect the joint occurrence of zero UMI the third quartile (Figure 2C). While, highly variable fea-
counts for two genes (see GPA theory, in Supplementary tures analysis of Seurat (Figure 2D) was much less precise
material). in discriminating between CGs and cell identity genes (com-NAR Genomics and Bioinformatics, 2021, Vol. 3, No. 3 7
pare Figure 2D to C) with, for example, the two neuronal were performed (Figure 3C–E). For these plots, genes were
markers Dcx and Map2 close to Gadph and Sub1. colored according to the cluster analysis results (detailed be-
low).
Gene clustering of mouse cortex Notably, each gene cluster shows univocal correspon-
dence with all the primary markers of one of the major cor-
Correlation analysis approaches are commonly used to tical cell identities at the developmental stage of analysis,
identify cell clusters with consistent global gene expres- proving COTAN ability to gather genes with similar nature
sion. Conversely, gene network analysis tools (27) such as regarding cell identity.
WGCNA (30) use correlation to build co-expression net-
works and from them infer gene clusters. COTAN does Investigating marker genes with cluster analysis
something similar, using COEX as a correlation matrix
and building on it to determine clusters of genes. It does The cluster analysis of the previous section used Ward’s
Downloaded from https://academic.oup.com/nargab/article/3/3/lqab072/6348150 by guest on 21 November 2021
not construct a co-expression network as an intermedi- minimum variance hierarchical method (36), based on the
ate step and instead directly groups together genes with distance matrix of the co-expression space. The resulting
similar co-expression patterns against selected genes in the tree presents a natural cutting gap at seven clusters (possible
sample. alternatives being at 2, 4 or 5 clusters––see Figure 4).
We used COTAN to investigate a dataset of mouse em- Each of the five pairs of primary markers was found un-
bryonic cortex (4), because the molecular identity of its divided in a different cluster. From them we assigned the
many cell types is well described (32). We firstly selected identity of the five clusters and in particular: cluster 1, con-
from literature (32) robust primary markers for layer I taining Vim and Hes1, was identified as a set of genes re-
(Reln), layers II/III (Satb2), layer IV (Sox5) and layers lated to progenitors identity; cluster 2, containing Sox5 and
V/VI (Bcl11b), see Figure 3A. Then, for each marker we se- Rorb, was identified as genes related to layer IV identity;
lected its most correlated genes. We used COEX > 0 for all cluster 3, containing Reln and Lhx5, was identified as genes
genes and GPA p-value8 NAR Genomics and Bioinformatics, 2021, Vol. 3, No. 3
Downloaded from https://academic.oup.com/nargab/article/3/3/lqab072/6348150 by guest on 21 November 2021
Figure 3. Gene clustering in scRNA-seq analysis. (A) The six layers of differentiated neurons and progenitor cells of late embryonic cortex are depicted in
different colors, together with known markers of cell identity (32,40). (B) GPA heatmap of the 170 genes showing strong joint expression with the genes
indicated in labels: Reln, Satb2, Sox5 and Bcl11b respectively markers of layers I, II/III, IV and V/VI. The heatmap shows the reciprocal relationship
between all genes pairs; significant joint expression is indicated with blue (positive COEX values) while significant disjoint expression is indicated in
red (negative COEX values). (C, D) and (E) Different dimensionality reduction plots (Principal Component Analysis, t-distributed Stochastic Neighbour
Embedding and Multidimensional Scaling, respectively) of 1235 genes (10% highest LDI). t-SNE plot was performed using initial dimensions 20, maximum
iterations 3000, perplexity 30, eta = 200 and theta = 0.4. Colors identify clusters as specified in Investigating marker genes with cluster analysis. Labels
correspond to the ten primary markers, together with four other known layer identity markers (Tbr1, Mef2c, Nes and Sox2) as additional landmarks. All
plots refer to E17.5 mouse cortex cells (4).
coherently labelled genes, with known cortical expression DISCUSSION
pattern in the Allen Brain Atlas database.)
We introduced COTAN, a novel method for the analysis of
COTAN identified a much higher number of layer mark-
scRNA-seq data with UMI counts. COTAN is based on a
ers compared to the conventional methods applied in (5)
flexible model for the probability of zero UMI counts and a
(see supplementary file STable1.csv). Among all possi-
generalized contingency table framework for zero/non-zero
ble new layer markers detected by COTAN, we analyzed
UMI counts for couples of genes.
the ones presenting nucleic acid binding gene ontology
We described the application of COTAN to datasets of
(GO:0003676). Complete tables are attached as supplemen-
mouse embryonic hippocampus and cerebral cortex, that
tary files (STable1.csv and STable2.csv). Supple-
show high and documented cell identity diversity.
mentary Figure S11 shows the E18.5 ISH collection of the
We found that COTAN is well suited to identify gene
genes available from Allen Brain Atlas website. Most of the
pairs which are jointly or disjointly expressed in the sam-
genes show ISH pattern consistent with layer identity as
ple. This is graphically summarized through heatmap plots
identified by COTAN, with few exceptions.
(as in Figures 2A and 3B) or numerically with two quanti-
In conclusion, gene co-expression space can extract spe-
ties: an approximate p-value (for a test on independence)
cific information from the dataset serving as a suitable
and the COEX index, which is a signed measurement of
base for gene clustering and novel cell identity marker
co-expression (positive and blue in the heatmaps for joint
identification.NAR Genomics and Bioinformatics, 2021, Vol. 3, No. 3 9 Figure 4. Hierarchical clustering of genes. The dotted line denotes the height of the tree cut forming seven clusters. Branches and leaves colors indicate Downloaded from https://academic.oup.com/nargab/article/3/3/lqab072/6348150 by guest on 21 November 2021 cluster identity: cluster 1, in light blue, indicates progenitor identity, cluster 2, in aquamarine, indicates layer IV identity, cluster 3, in red, indicates layer I identity, cluster 5, in dark blue, indicates layers V/VI identity and cluster 6, in pink, denotes layers II/III identity. The two clusters in gray (4 and 7) do not contain primary markers and are likely inconsistent with projection neuron identity. The gene names reported are the ones identified as secondary markers (see Gene clustering of mouse cortex). expression; negative and red, when the expression of one features, but with constitutive genes and not-constitutive gene tends to exclude the expression of the other). genes more separated (as shown in Figure 2). In addition, COTAN can quantitatively and directly extricate gene re- with the LDI it is possible to focus this analysis on spe- lationships, also for lowly expressed genes. cific biological features, uncovering information that may Building on the p-values, COTAN can compute for each be hidden or confounded by whole genome approaches. gene new scores (GDI and LDI) to assess which genes are Finally, exploiting all the information in the matrix of differentially expressed. The GDI is a useful tool to detect COEX for many genes (through the co-expression space), differentially expressed genes, similarly to Seurat’s variable COTAN can cluster genes with consistent differential
10 NAR Genomics and Bioinformatics, 2021, Vol. 3, No. 3

Table 1. Number of layer markers found by Loo et al. (5) with their respective layer according to the original paper (columns) and according to COTAN
and WGCNA (rows). Bold text denotes consistent identification by the two methods. Plxna4 in purple, see text. The second table has the same data as
the first one, but excluding all genes belonging to the set V of secondary markers, as these were selected by co-expression with the primary markers and
hence their assignment to the correct clusters might be favored by the method. The third table shows the four modules identified by WGCNA. Two of them
included the primary markers of layer I and progenitor cells and were so identified. The third one contained no primary marker and five markers by Loo
et al. (5). The fourth one included no marker. Several marker genes were outside all four modules
                                                                                                     Markers from Loo et al. (5)
                                                                               Layer I         Layers II/III        Layers V/VI           Progenitor
Markers detected by COTAN                           Layer I                       4
                                                    Layers II/III                                    3                    1
                                                    Layer IV                                                                                   1
                                                    Layers V/VI                                                           7

                                                                                                                                                           Downloaded from https://academic.oup.com/nargab/article/3/3/lqab072/6348150 by guest on 21 November 2021
                                                    Progenitor                                                                                 8
                                                    Other cluster                                                         1                    2
Markers outside V detected by COTAN                 Layer I
                                                    Layers II/III                                    2                    1
                                                    Layer IV                                                                                   1
                                                    Layers V/VI                                                           5
                                                    Progenitor                                                                                 5
                                                    Other cluster                                                         1                    2
Markers detected by WGCNA                           Layer I                       2
                                                    Progenitor                                                                                 7
                                                    Other module 1                                                                             5
                                                    Other module 2
                                                    Not in a module               1                  4                    9                    2

expression at single cell level, allowing to confirm previously               FUNDING
known cell-identity markers and enabling the discovery of
                                                                              AIRC [project [to MHC] (grant number IG 23539).
new ones.
                                                                              Conflict of interest statement. None declared.
  It should be noted that COTAN is most useful when the
population of cells is not too heterogeneous, because if there
are too many cell types then most genes will be differentially
expressed. In those cases the interpretation of results might                 REFERENCES
become difficult.                                                               1. Tang,F., Barbacioru,C., Wang,Y., Nordman,E., Lee,C., Xu,N.,
  In conclusion, COTAN is a novel approach that lays the                           Wang,X., Bodeau,J., Tuch,B.B., Siddiqui,A. et al. (2009) mRNA-Seq
groundwork to directly infer single-cell gene interactome                          whole-transcriptome analysis of a single cell. Nat. Methods, 6,
and relationship, and represents an alternative to indirect                        377–382.
                                                                                2. Zeisel,A., Hochgerner,H., Lönnerberg,P., Johnsson,A., Memic,F.,
approaches (30,39) in the panorama of single cell data anal-                       Van Der Zwan,J., Häring,M., Braun,E., Borm,L.E., La Manno,G.
ysis methods.                                                                      et al. (2018) Molecular architecture of the mouse nervous system.
                                                                                   Cell, 174, 999–1014.
                                                                                3. Briggs,J.A., Weinreb,C., Wagner,D.E., Megason,S., Peshkin,L.,
                                                                                   Kirschner,M.W. and Klein,A.M. (2018) The dynamics of gene
DATA AVAILABILITY                                                                  expression in vertebrate embryogenesis at single-cell resolution.
Data analysis in this paper was based on two public                                Science, 360,eaar5780.
                                                                                4. Yuzwa,S.A., Borrett,M.J., Innes,B.T., Voronova,A., Ketela,T.,
datasets, as described below. For GPA and GDI of mouse                             Kaplan,D.R., Bader,G.D. and Miller,F.D. (2017) Developmental
hippocampus we analyzed the cells from time point E16.5                            emergence of adult neural stem cells as revealed by single-cell
of the mouse dentate gyrus dataset with GEO number                                 transcriptional profiling. Cell Rep., 21, 3970–3986.
GSE104323 (25). Cells removed during cleaning were 33 out                       5. Loo,L., Simon,J.M., Xing,L., McCoy,E.S., Niehaus,J.K., Guo,J.,
                                                                                   Anton,E.S. and Zylka,M.J. (2019) Single-cell transcriptomic analysis
of 2285. For Gene clustering of mouse cortex we analyzed the                       of mouse neocortical development. Nat. Commun., 10, 134.
cells from time point E17.5 of the mouse embryonic cortex                       6. Picelli,S., Faridani,O.R., Björklund,Å.K., Winberg,G., Sagasser,S.
dataset with GEO number GSM2861514 (4). Cells removed                              and Sandberg,R. (2014) Full-length RNA-seq from single cells using
during cleaning were 17 out of 880.                                                Smart-seq2. Nat. Protoc., 9, 171–181.
   The COTAN package is publicly available on GitHub at                         7. Hashimshony,T., Senderovich,N., Avital,G., Klochendler,A., de
                                                                                   Leeuw,Y., Anavy,L., Gennert,D., Li,S., Livak,K.J.,
https://github.com/seriph78/COTAN. All data and analysis                           Rozenblatt-Rosen,O. et al. (2016) CEL-Seq2: sensitive
described in this manuscript are available as a repository at                      highly-multiplexed single-cell RNA-Seq. Genome Biol., 17, 77.
https://github.com/seriph78/Cotan paper or as a web site at                     8. Macosko,E.Z., Basu,A., Satija,R., Nemesh,J., Shekhar,K.,
https://seriph78.github.io/Cotan paper/.                                           Goldman,M., Tirosh,I., Bialas,A.R., Kamitaki,N., Martersteck,E.M.
                                                                                   et al. (2015) Highly parallel genome-wide expression profiling of
                                                                                   individual cells using nanoliter droplets. Cell, 161, 1202–1214.
                                                                                9. Zheng,G.X., Terry,J.M., Belgrader,P., Ryvkin,P., Bent,Z.W.,
SUPPLEMENTARY DATA                                                                 Wilson,R., Ziraldo,S.B., Wheeler,T.D., McDermott,G.P., Zhu,J. et al.
                                                                                   (2017) Massively parallel digital transcriptional profiling of single
Supplementary Data are available at NARGAB Online.                                 cells. Nat. Commun., 8, 14049.
NAR Genomics and Bioinformatics, 2021, Vol. 3, No. 3 11
10. Klein,A.M., Mazutis,L., Akartuna,I., Tallapragada,N., Veres,A., development revealed by single-cell RNA sequencing. Nat. Neurosci.,
Li,V., Peshkin,L., Weitz,D.A. and Kirschner,M.W. (2015) Droplet 21, 290–299.
barcoding for single-cell transcriptomics applied to embryonic stem 26. Soneson,C. and Robinson,M.D. (2018) Bias, robustness and
cells. Cell, 161, 1187–1201. scalability in single-cell differential expression analysis. Nat. Methods,
11. Chen,G. and Shi,T. (2019) Single-cell RNA-seq technologies and 15, 255–261.
related computational data analysis. Front. Genet., 10, 317. 27. Cha,J. and Lee,I. (2020) Single-cell network biology for resolving
12. Zhang,X., Li,T., Liu,F., Chen,Y., Yao,J., Li,Z., Huang,Y. and Wang,J. cellular heterogeneity in human diseases. Exp. Mol. Med., 52,
(2019) Comparative analysis of droplet-based ultra-high-throughput 1798–1808.
single-cell RNA-Seq systems. Mol. cell, 73, 130–142. 28. Galfrè,S.G. and Morandin,F. (2020) A mathematical framework for
13. Ziegenhain,C., Vieth,B., Parekh,S., Reinius,B., raw counts of single-cell RNA-seq data analysis. arXiv doi:
Guillaumet-Adkins,A., Smets,M., Leonhardt,H., Heyn,H., https://arxiv.org/abs/2002.02933, 07 February 2020, preprint: not peer
Hellmann,I. and Enard,W. (2017) Comparative analysis of single-cell reviewed.
RNA sequencing methods. Mol. cell, 65, 631–643. 29. Vallejos,C.A., Marioni,J.C. and Richardson,S. (2015) BASiCS:
14. Stuart,T. and Satija,R. (2019) Integrative single-cell analysis. Nat. Bayesian analysis of single-cell sequencing data. PLoS Comput. Biol.,
Rev. Genet., 20, 257–272. 11,e1004333–e1004333.
Downloaded from https://academic.oup.com/nargab/article/3/3/lqab072/6348150 by guest on 21 November 2021
15. Kiselev,V.Y., Andrews,T.S. and Hemberg,M. (2019) Challenges in 30. Langfelder,P. and Horvath,S. (2008) WGCNA: an R package for
unsupervised clustering of single-cell RNA-seq data. Nat. Rev. weighted correlation network analysis. BMC Bioinformatics, 9, 559.
Genet., 20, 273–282. 31. Ramsköld,D., Wang,E.T., Burge,C.B. and Sandberg,R. (2009) An
16. La Manno,G., Soldatov,R., Zeisel,A., Braun,E., Hochgerner,H., abundance of ubiquitously expressed genes revealed by tissue
Petukhov,V., Lidschreiber,K., Kastriti,M.E., Lönnerberg,P., transcriptome sequence data. PLoS Comput. Biol., 5,e1000598.
Furlan,A. et al. (2018) RNA velocity of single cells. Nature, 560, 32. Greig,L.C., Woodworth,M.B., Galazo,M.J., Padmanabhan,H. and
494–498. Macklis,J.D. (2013) Molecular logic of neocortical projection neuron
17. Vieth,B., Parekh,S., Ziegenhain,C., Enard,W. and Hellmann,I. (2019) specification, development and diversity. Nat. Rev. Neurosci., 14,
A systematic evaluation of single cell RNA-seq analysis pipelines. 755–769.
Nat. Commun., 10, 4667. 33. Bertrand,N., Castro,D.S. and Guillemot,F. (2002) Proneural genes
18. Luecken,M.D. and Theis,F.J. (2019) Current best practices in and the specification of neural cell types. Nat. Rev. Neurosci., 3,
single-cell RNA-seq analysis: a tutorial. Mol. Syst. Biol., 15,e8746. 517–530.
19. Townes,F.W., Hicks,S.C., Aryee,M.J. and Irizarry,R.A. (2019) 34. Butler,A., Hoffman,P., Smibert,P., Papalexi,E. and Satija,R. (2018)
Feature selection and dimension reduction for single-cell RNA-Seq Integrating single-cell transcriptomic data across different conditions,
based on a multinomial model. Genome Biol., 20, 295. technologies, and species. Nat. Biotechnol., 36, 411–420.
20. Svensson,V. (2020) Droplet scRNA-seq is not zero-inflated. Nat. 35. Nitzan,M., Karaiskos,N., Friedman,N. and Rajewsky,N. (2019) Gene
Biotechnol., 38, 147–150. expression cartography. Nature, 576, 132–137.
21. Pierson,E. and Yau,C. (2015) ZIFA: dimensionality reduction for 36. Murtagh,F. and Legendre,P. (2014) Ward’s hierarchical agglomerative
zero-inflated single-cell gene expression analysis. Genome biol., 16, clustering method: which algorithms implement Ward’s criterion? J.
241. Classif., 31, 274–295.
22. Van Dijk,D., Sharma,R., Nainys,J., Yim,K., Kathail,P., Carr,A.J., 37. Kuleshov,M.V., Jones,M.R., Rouillard,A.D., Fernandez,N.F.,
Burdziak,C., Moon,K.R., Chaffer,C.L., Pattabiraman,D. et al. (2018) Duan,Q., Wang,Z., Koplev,S., Jenkins,S.L., Jagodnik,K.M.,
Recovering gene interactions from single-cell data using data Lachmann,A. et al. (2016) Enrichr: a comprehensive gene set
diffusion. Cell, 174, 716–729. enrichment analysis web server 2016 update. Nucleic Acids Res., 44,
23. Huang,M., Wang,J., Torre,E., Dueck,H., Shaffer,S., Bonasio,R., W90–W97.
Murray,J.I., Raj,A., Li,M. and Zhang,N.R. (2018) SAVER: gene 38. Chen,E.Y., Tan,C.M., Kou,Y., Duan,Q., Wang,Z., Meirelles,G.V.,
expression recovery for single-cell RNA sequencing. Nat. Methods, Clark,N.R. and Ma’ayan,A. (2013) Enrichr: Interactive and
15, 539–542. collaborative HTML5 gene list enrichment analysis tool. BMC
24. Islam,S., Zeisel,A., Joost,S., La Manno,G., Zajac,P., Kasper,M., Bioinformatics, 14, 128.
Lönnerberg,P. and Linnarsson,S. (2014) Quantitative single-cell 39. Mohammadi,S., Davila-Velderrain,J. and Kellis,M. (2019)
RNA-seq with unique molecular identifiers. Nat. Methods, 11, Reconstruction of cell-type-specific interactomes at single-cell
163–166. resolution. Cell Syst., 9, 559–568.
25. Hochgerner,H., Zeisel,A., Lönnerberg,P. and Linnarsson,S. (2018) 40. Molyneaux,B.J., Arlotta,P., Menezes,J.R. and Macklis,J.D. (2007)
Conserved properties of dentate gyrus neurogenesis across postnatal Neuronal subtype specification in the cerebral cortex. Nat. Rev.
Neurosci., 8, 427–437.You can also read