COUPON TRENDS 2014 2013 YEAR-END REPORT - Inmar
←
→
Page content transcription
If your browser does not render page correctly, please read the page content below

2014
COUPON
TRENDS
2013 YEAR-END REPORT

Copyright © February 2014, Inmar, Inc.
All rights reserved.
No part of this book may be reproduced
in any form without written permission
from Inmar. Inquiries regarding permission
for use of the material contained in this
book should be addressed to:
Inmar
635 Vine Street
Winston-Salem, NC 27101
866.440.6917
solutions@inmar.com
Disclaimer:
These documents do not constitute
legal advice. Inmar advises all reviewers
to seek advice from legal counsel based
on specific business needs.
On the cover:
A historical photo from United Fruit
Company, Unifruitco Magazine,
October 1948, p. 9.

INMAR drives business results
for our partners through the Application

of ADVANCED ANALYTICS, real-time data

management and industry experience.

WE ANALYZE TRENDS and business strategies,

industry practices and standards,

and technology opportunities to SUPPORT

OUR CLIENTS’ PROMOTIONAL PROGRAMS.

Our clients include some of the world’s

leading consumer packaged goods

manufacturers and retailers that

trust Inmar to securely manage

and settle MORE THAN forty BILLION

DOLLARS in transactions every year.


07 A Message from our Leadership

09 Executive Summary

11 Methodology

12 Key Trends

   13 Distribution
   14 Redemption
   15 Method
   20 FACE VALUE AND PURCHASE REQUIREMENT
   21 Redemption Period

22 Food vs. Non-food

   23 Distribution
   24 Redemption
   25 Method
   34 Face Value and Purchase Requirement
   37 Redemption Period

38 Digital promotions

42 2014 Shopper Study

48 Promotion Planning Tool Kit

   49 Method of Delivery analysis
   56 Promotion Objectives and Methods
   57 Designing a Coupon - Best Practices
   6o Efficient Coupon Scanning
   62 Method Codes and Definitions


A MESSAGE FROM OUR LEADERSHIP 07

A MESSAGE FROM OUR LEADERSHIP
Each year, Inmar’s Coupon Trends Report offers our                loss-of-share to those emerging retailers that are already
clients a review of the last twelve months’ worth of coupon       delighting customers with new methods of engagement.
distribution and settlement data as well as shopper insights      Given the complexity and capital-intensive nature of
and promotional trends — all in an effort to guide marketing      the grocery business, it is entirely understandable that
strategy and tactics in the coming year. This year, before        adoption of of omni channel commerce has not yet been
speaking to the present state of the promotions industry or       widespread. That must change, however, as shoppers are
its future implications, I would like to start by looking back.   eagerly seeking out, and rewarding, those brands and
At the turn of the twentieth century, American consumers          retailers that are able to make their purchase experience
shopped at the market they knew well. The shopkeeper              faster, easier and smarter. It’s not an easy task, but with Big
knew them and stocked what he knew they would buy.                Data, marketers now have what they need to identify and
It was an intensely local and highly personalized economic        engage with shoppers on a truly individual level. Through
ecosystem that was marked by deep-rooted shopper loyalty          effective analysis and application of the data, brands and
and individualized customer service. It was a relationship.       retailers can deliver genuine 1:1 value to consumers – in
All that began to change with the advent of the supermarket.      real time and at scale. Inmar is fully invested in this future
While customers enjoyed the new bounty of choices and             and we look forward to sharing these new capabilities with
cost savings that came with new economies of scale, such          your teams.
efficiencies came at the cost of those personal relationships     The 2014 Inmar Coupon Trends Report points to
with their neighborhood grocer.                                   the emergence of that future — spotlighting continued,
Today, the CPG/grocery industry is at a tipping point.            increasing consumer demand for convenience, savings and
The industry is focused on rebuilding this relationship with      service as well the industry’s efforts to meet those demands.
data-driven customer service. Brands and retailers alike          Exponential consumer adoption of digital promotions,
will be able to know their customers and drive shopper            continued high-volume redemption of paper coupons and
loyalty like never before while creating even greater             the impact of in-store delivery methods on the in-store
industry efficiency in the process. Inmar is at the front of      experience were all part of the promotion story in 2013.
the impending change, which will see successful retailers         This edition of the Inmar Coupon Trends Report provides
aggressively adopt a multi-channel sales solution that will       insight into that activity, contains detailed data points
significantly enhance digital engagement with shoppers. A         on key aspects of the promotion industry and includes
long time coming, and still in its infancy, this movement         results from our Annual Shopper Behavior Survey.
is growing because shoppers are demanding it. They have           We hope you will find this report helpful to your business
learned from their experiences in other industries – banking,     and brand promotional needs. Please know that Inmar
travel, even politics – and are applying their expectations       stands ready to assist you in finding new ways to drive
to the grocery channel. Traditional retailers must respond        revenue while creating a superior shopper experience.
to these clearly expressed consumer desires or risk serious

                                                                                  Regards,

                                                                                  John Ross
                                                                                  Inmar Chief Marketing Officer and
                                                                                  President, Inmar Analytics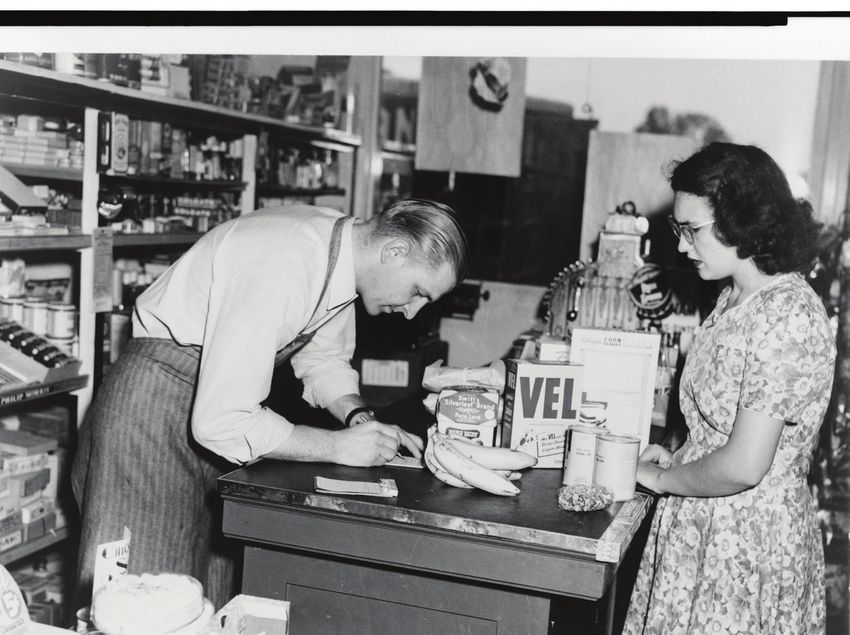

EXECUTIVE SUMMARY 09

EXECUTIVE SUMMARY
While digital coupons, shopper analytics and shifting          the largest share of digital coupon redemption information
consumer tastes continue to shape the GPG and grocery          in the industry. That represents a 120 percent increase
industries, the paper coupon remains a powerful influencer     over the approximately 20 million paperless coupons
among shopopers. Coupon redemption remained steady in          the company settled in 2012.
2013 at 2.9 billion coupons redeemed while distribution        Other methods accounting for sizable portions of coupons
grew 3.6 percent – compared to 2012. Some 329 billion          redeemed included instant redeemable (15.6 percent),
coupons for Consumer Packaged Goods (CPGs) – including         electronic checkout (8.4 percent), shelf pad (5.9 percent),
both traditional, paper coupons and digital, (paperless        internet print at home (5.2 percent) and direct mail
coupons) – were distributed in the U.S. last year. Of the      (4.1 percent).
coupons distributed in 2013, roughly 40 percent were for
food products and 60 percent for non-food products.            As shopper behavior continues to change and offer
                                                               expectations continue to increase, advertisers must employ
The preferred method of distribution for marketers – and       holistic engagement strategies that deliver both mass
the most popular method for redemption by consumers            distributed offers for reach, as well as relevant, targeted
– continues to be Free-standing Inserts (FSIs). FSIs           content through both traditional and digital methods. More
represented 89 percent of all coupons distributed in 2013      than ever, effectively delivering value into the marketplace
and accounted for 41 percent of all redeemed coupons.          requires the careful and consistent application of consumer-
According to the Inmar 2014 Shopper Behavior Study, 49         centric analytics.
percent of shoppers regularly use FSI coupons – making
them the most frequently used method among shoppers            Responding to market conditions, advertisers are making
(when ranked against the other discovery/acquisition           offers more attractive and easier for consumers to redeem.
methods). In terms of redeemed offer count, more than          While the average face value of distributed coupons
one billion of the 2.9 billion coupons redeemed in 2013        declined slightly in 2013 (down 0.6 percent to $1.56),
were FSIs.                                                     the average face value of redeemed coupons grew
                                                               significantly (up 12.4 percent to $1.27). Consumers
At the same time, digital coupons – enabling more              responded to offers they found compelling – motivated to
personalized promotion and deployed by marketers with          action, in large part, by the face value of the offer.
enhanced targeting – continued to grow over the overall
rate of coupon growth and, consequently, increased their       At the same time, the average purchase requirement
share of redemption. These are load-to-card coupons that       of coupons distributed decreased 5.1 percent to 1.48 units
consumers load directly to their shopper loyalty accounts      per offer – compared to 1.56 units in 2012. Redemption
from retailer and publisher websites, as well as other         periods for distributed coupons did not contract (as they
locations. With no paper involved, these offers are applied    have for the last four years) and remained unchanged at 2.2
automatically at checkout and discounts instantly credited     months. Finally, the average redemption period for coupons
when the shopper presents their loyalty card or unique         redeemed expanded 1.9 percent to 5.3 months.
individual identifier.                                         Our experience and shopper insights work reveal consumers
In 2013, more than 66 million digital coupons were redeemed    appear appreciative of lengthier redemption periods and the
industry-wide according to Inmar estimates – a 141 percent     flexibility to use coupons on their own schedule as their
increase over 2012. Inmar, alone, facilitated the redemption   needs warrant.
of almost 44 million digital coupons in 2013, giving it
METHODOLOGY 11

METHODOLOGY

To compile our annual industry
report of packaged goods coupon
                                                  A NOTE ON INDICES
promotions, an Inmar task force                   An index shows which coupons consumers are more likely to use. It is
of associates with marketing,                     calculated by dividing the percent of coupons redeemed by the percent of
promotions, research, coupon                      coupons distributed. Indices above 100 indicate that consumers are more
industry, consulting, statistical                 likely to use those coupons.
and accounting experience
collaborated closely to:
• Consolidate distribution and                    A NOTE ON DIGITAL PROMOTIONS
  redemption data from the Inmar                  True digital promotions are those that traverse the entire coupon process
  coupon database.                                from offer setup through redemption without ever manifesting as paper
• Extrapolate industry distribution               in any hard copy form. Some other coupons have a digital component
  and redemption statistics using                 in that they are discovered online or via other digital media (social,
  Inmar and Kantar Media data.                    mobile, email), but must be printed out and presented at point of sale
• Cross-check data with major coupon              to receive the discount. For purposes of this report, digital promotions are
  distributors and third-party vendors.           tracked and reported separately from paper coupon promotions.
• Conduct analysis and develop                    With the exception of overall distribution volume, overall redemption
  key insights.                                   volume and our digital insert, all data contained in this report exclude
                                                  digital coupon data.
In a continuing effort to provide
the most up-to-date information
possible, Inmar constantly reviews
its methodology and information                   A NOTE ON THE 2014 SHOPPER BEHAVIOR SURVEY
database. As such, data for all years             Results are based on an online survey of 1,091 shoppers conducted by
have been revised and restated to                 Inmar Analytics in January 2014. Respondents were between the ages
deliver the most accurate presentation            of 18 and 69 and were the primary or shared decision maker/shopper
of actual trends.                                 in their home.

THE Coupon Trends Report TEAM      Nicole Steward-Streng, Manager, Shopper Insights; Andrew W. Coleman, Senior Consultant, Inmar Analytics;
                                   Susan Jones, Senior Director, Promotion Consulting; Masha Beversdorf, Senior Graphic Designer;
 (opposite page, LEFT TO RIGHT):   Kevin Keller, Marketing Manager, Promotion Network; Devora Rogers, Senior Director, Retail Marketing Insights
                  NOT PICTURED:    Beth Agejew, Senior Analyst; Laird Garner, Manager, Consulting; Gail Schneitler, Senior Market Research Manager
KEY TRENDS
KEY TRENDS 13

Disguised as merely a humble scrap of paper, there is actually significant complexity within a single coupon. Not only does it
serve as a branding vehicle and reminder to purchase, coupons can also uncover insights into overall brand health. With more
than forty distinct coupon methods available for offer distribution, coupons can provide a glimpse into consumer behavior
and shopper activity: where offers are discovered (online, at home, in store, at shelf), how offers are acquired and presented
(particularly relevant for digital/mobile use cases), and, of course, redemption data that help marketers evaluate and prioritize their
retail partnerships. Similarly, the statistics of coupon redemption and settlement offer much more than one might expect. These
figures offer insights into what shoppers value and what offers will likely resonate with consumers in the coming year. Changes
in average redemption rates by method, the average face values of coupons redeemed and the average purchase requirements of
redeemed coupons all offer guideposts for marketers to create compelling offers and to better predict shopper response.

DISTRIBUTION
OVERALL COUPON DISTRIBUTION
(WITH DIGITAL; IN BILLIONS)                                            DISTRIBUTION INDEX BY MONTH
In 2013, industry-wide coupon distribution volume                      Generally speaking, coupons are distributed in a repetitive
(including digital) increased 3.6% to 329 billion coupons.             cycle from year-to-year with distribution peaks in January
The value of all coupons distributed was roughly $513                  (New Year, Super Bowl), early spring (Easter), early fall
billion, an increase of $15 billion (+3.0%) over the previous          (Back-to-school), and, to a lesser extent, winter holidays.
year. On average, every person in the United States was                2013 saw a more dramatic decline in fourth quarter, driven
offered $1,617 in coupon savings; however, consumers                   primarily by non-food.
only took advantage of $3.7 billion of these savings or
$11.60 per person.

                                  DISTRIBUTION TRENDS INDICATE WHAT MARKETERS ARE DOING.
    RULE OF THUMB:
                                  REDEMPTION TRENDS INDICATE WHAT CONSUMERS ARE DOING.
14 KEY TRENDS
REDEMPTION
OVERALL COUPON REDEMPTION REDEMPTION INDEX BY MONTH
(WITH DIGITAL; IN BILLIONS) As with distribution, coupon redemption is also cyclical,
although redemption exhibits smaller peaks and valleys
In 2013, industry-wide coupon redemption volume than distribution.
(including digital) was flat at 2.9 billion coupons. Increases
in direct mail, electronic checkout, electronic shelf, instant
redeemable, internet print-at-home and digital volume
helped sustain the overall redemption volume level.
77 PERCENT OF SHOPPERS
BOUGHT GROCERIES FROM
A NON-GROCER IN 20131,
WHICH CORRESPONDS
WITH THE GROWTH IN VALUE
FOR CHANNEL RETAILERS (3.2%) AND
C-STORES (2.0%) COMPARED
TO SUPERMARKETS (1.1%) IN 20132.
1
Are Grocery Stores Doomed? Study Shows More Shoppers Buying Food At Target, Walmart, Pharmacies – Clare O’Connor, Forbes.com
February, 2014
2
Funny Things Happened On Our Way To Our Economic Recovery – Nielsen November, 2013KEY TRENDS 15
METHOD
PERCENT OF TOTAL COUPON DISTRIBUTED BY METHOD
(EXCLUDING DIGITAL)
Method 2009 2010 2011 2012 2013
Bounceback16 KEY TRENDS
PERCENT OF TOTAL COUPONS REDEEMED BY METHOD
(EXCLUDING DIGITAL)
Method 2009 2010 2011 2012 2013
Bounceback 0.2% 0.2% 0.2% 0.1% 0.1%
Color Run-of-press < 0.1% < 0.1% < 0.1% < 0.1% < 0.1%
Consumer Relations 0.4% 0.4% 0.4% 0.4% 0.4%
Direct Home Delivery < 0.1% 0.2% 0.1% < 0.1% < 0.1%
Direct Mail 2.9% 2.8% 3.4% 3.7% 4.1%
Direct Mail Co-op 0.6% 0.5% 0.4% 0.5% 0.5%
Direct Mail with Sample < 0.1% < 0.1% < 0.1% < 0.1% < 0.1%
Electronic Checkout 7.9% 8.1% 7.7% 8.0% 8.4%
Electronic Kiosk < 0.1% < 0.1% < 0.1% 0.1% 0.1%
Electronic Shelf 1.7% 1.7% 1.7% 1.6% 2.0%
Free-standing Insert 49.1% 44.0% 43.9% 43.9% 41.0%
Handout 3.4% 2.9% 3.0% 3.1% 3.0%
Handout Co-op 0.1% 0.1% 0.1% 0.1% 0.1%
Handout In-store with Sample 0.1% 0.1% 0.2% 0.4% 0.4%
Handout Off-store Location 0.2% 0.3% 0.2% 0.2% 0.1%
Handout Off-store Location Co-op < 0.1% < 0.1% < 0.1% < 0.1% < 0.1%
Handout Off-store Location with Sample 0.1% 0.1% 0.1% 0.1% 0.1%
Hospital Sample < 0.1% 0.1% 0.1% < 0.1% 0.1%
In-ad 2.0% 2.3% 1.8% 1.6% 1.3%
In-pack 3.0% 2.4% 2.6% 2.1% 2.0%
In-pack Cross Ruff 0.6% 0.6% 0.5% 0.5% 0.5%
Instant Redeemable 9.2% 13.2% 12.8% 12.5% 15.6%
Instant Redeemable Cross Ruff 6.2% 4.5% 4.4% 5.6% 4.6%
Internet Print-at-home 1.5% 2.8% 4.7% 4.6% 5.2%
Magazine On-page 0.6% 0.7% 0.7% 0.5% 0.4%
Magazine Pop-up 0.3% 0.3% 0.2% 0.3% 0.3%
Military Handout 0.5% 0.4% 0.3% 0.4% 0.4%
Military Magazine 0.1% < 0.1% < 0.1% < 0.1% < 0.1%
Military Shelf Pad 0.8% 0.7% 0.6% 0.5% 0.6%
Newspaper Co-op < 0.1% < 0.1% < 0.1% < 0.1% < 0.1%
Newspaper Run-of-press 0.1% 0.1% < 0.1% < 0.1% < 0.1%
On-pack 2.0% 2.0% 2.3% 2.0% 1.8%
On-pack Cross Ruff 0.4% 0.6% 0.4% 0.4% 0.5%
Prenatal < 0.1% < 0.1% < 0.1% < 0.1% < 0.1%
Shelf Box 0.3% 0.3% 0.2% 0.2% 0.3%
Shelf Pad 5.4% 7.5% 7.0% 6.1% 5.9%
Sunday Supplement 0.1% 0.1% < 0.1% 0.4% 0.2%
FSI’s share of the coupon redemption mix decreased from 1.0% of total coupon redemption volume included direct
43.9% in 2012 to 41.0% in 2013. Redemption volume for mail, handout, in-ad, in-pack, instant redeemable cross ruff,
FSI coupons was down 9.9% to 1.1 billion coupons. internet print-at-home, and, on-pack.
After FSI, methods accounting for the largest share of Internet print-at-home coupons accounted for 5.2% of total
redemption all relied on in-store discovery, including coupon volume, an increase from the previous year’s 4.6%.
instant redeemable, electronic checkout, electronic shelf Internet print-at-home coupon volume increased 9.4% to
and shelf pad (respectively). Other methods with at least 0.15 billion coupons.KEY TRENDS 17
2013 METHOD INDEX
(EXCLUDING DIGITAL)
Method INDEX
Consumer Relations 5890
Instant Redeemable 2591
On-pack 2225
Military Shelf Pad 1977
Shelf Pad 1479
Shelf Box 1380
Internet Print-at-home 1314
Instant Redeemable Cross Ruff 1261
Bounceback 1195
Electronic Shelf 1143
Military Handout 1056
Handout In-store with Sample 784
Electronic Checkout 772
Electronic Kiosk 626
In-pack 590
Handout 490
Direct Mail 425
Hospital Sample 380
Military Magazine 364
Handout Off-store Location 309
On-pack Cross Ruff 294
Direct Mail Co-op 272
Handout Off-store Location with Sample 226
Color Run-of-press 202
In-pack Cross Ruff 175
Handout Co-op 172
Handout Off-store Location Co-op 130
Direct Mail with Sample 125
Prenatal 99
Direct Home Delivery 99
In-ad 64
Free-standing Insert 46
Newspaper Run-of-press 42
Magazine On-page 36
Magazine Pop-up 29
Sunday Supplement 29
Newspaper Co-op 17
When the percentage of coupons redeemed by method was redeemable cross ruff, electronic shelf and shelf box were
indexed against the percentage of coupons distributed by very popular with consumers – as were internet print-at-
method, the resulting index showed that in-store distributed home coupons.
coupons such as instant redeemable, shelf pad, instant18 KEY TRENDS
REDEMPTION RATES BY METHOD
(EXCLUDING DIGITAL)
Method 2009 2010 2011 2012 2013
Bounceback 9.97% 20.44% 4.43% 0.69% 3.58%
Color Run-of-press 0.24% 0.57% 0.16% 0.35% 0.29%
Consumer Relations 20.08% 15.56% 17.94% 4.26% 4.64%
Direct Home Delivery 2.73% 4.54% 14.97% 0.62% 1.29%
Direct Mail 2.62% 2.33% 3.20% 4.29% 4.41%
Direct Mail Co-op 2.65% 4.09% 2.26% 1.80% 1.09%
Direct Mail with Sample 2.06% 2.98% 1.44% 2.38% 0.92%
Electronic Checkout 6.74% 6.28% 6.98% 7.74% 6.62%
Electronic Kiosk 5.84% 1.71% 4.29% 5.52% 3.33%
Electronic Shelf 4.95% 6.83% 8.76% 13.40% 11.17%
Free-standing Insert 0.53% 0.58% 0.51% 0.55% 0.47%
Handout 2.96% 3.18% 2.85% 3.53% 3.64%
Handout Co-op 2.64% 1.20% 1.50% 1.03% 1.20%
Handout In-store with Sample 3.46% 3.06% 3.61% 4.47% 4.58%
Handout Off-store Location 1.59% 2.57% 3.20% 3.07% 1.95%
Handout Off-store Location Co-op 2.07% 0.97% 0.74% 0.44% 2.34%
Handout Off-store Location with Sample 1.57% 2.72% 2.36% 2.70% 2.61%
Hospital Sample 2.41% 2.38% 4.02% 2.47% 3.34%
In-ad 0.74% 0.91% 0.62% 0.61% 0.46%
In-pack 4.71% 5.21% 5.30% 5.58% 3.45%
In-pack Cross Ruff 2.42% 1.69% 1.79% 2.04% 1.70%
Instant Redeemable 16.74% 22.93% 22.94% 18.46% 23.85%
Instant Redeemable Cross Ruff 11.43% 15.62% 9.93% 11.73% 11.13%
Internet Print-at-home 7.79% 5.93% 7.54% 11.91% 9.00%
Magazine On-page 0.35% 0.41% 0.36% 0.42% 0.29%
Magazine Pop-up 0.64% 0.48% 0.54% 0.28% 0.22%
Military Handout 9.07% 10.57% 10.00% 9.11% 9.53%
Military Magazine 2.25% 2.13% 1.88% 2.62% 2.61%
Military Shelf Pad 12.08% 22.53% 20.26% 17.04% 17.72%
Newspaper Co-op 0.63% 0.56% 0.24% 0.45% 0.37%
Newspaper Run-of-press 0.23% 0.37% 0.26% 0.19% 0.38%
On-pack 6.01% 12.48% 13.30% 12.99% 12.86%
On-pack Cross Ruff 4.34% 3.86% 3.43% 3.64% 2.96%
Shelf Box 8.51% 8.11% 12.12% 9.91% 10.39%
Shelf Pad 8.88% 11.60% 12.14% 11.67% 11.08%
Sunday Supplement 0.49% 0.45% 0.33% 0.07% 0.66%
In 2013, average redemption rates ranged from 0.22% for magazine pop-up coupons to
23.85% for instant redeemable coupons. The FSI redemption rate decreased from 0.55%
to 0.47%. The average redemption rate for internet print-at-home coupons decreased from
11.91% to 9.00%.KEY TRENDS 19
MIDDLE-HALF RATES BY METHOD
(EXCLUDING DIGITAL)
Method REDEMPTION RATE REDEMPTION RATE RANGE
Bounceback 4.49% 1.81% - 46.02%
Color Run-of-press 0.38% 0.13% - 1.73%
Consumer Relations 22.08% 7.10% - 42.78%
Direct Home Delivery 1.60% 0.34% - 2.94%
Direct Mail 5.69% 1.69% - 16.56%
Direct Mail Co-op 3.15% 1.00% - 12.91%
Direct Mail with Sample 0.87% 0.36% - 2.04%
Electronic Checkout 6.26% 2.26% - 12.26%
Electronic Kiosk 3.97% 1.73% - 9.53%
Electronic Shelf 9.12% 2.42% - 19.09%
Free-standing Insert 0.41% 0.15% - 0.85%
Handout 6.43% 1.54% - 24.28%
Handout Co-op 1.76% 0.64% - 4.78%
Handout In-store with Sample 4.21% 1.11% - 11.27%
Handout Off-store Location 5.93% 1.68% - 29.20%
Handout Off-store Location Co-op 1.05% 0.50% - 3.00%
Handout Off-store Location with Sample 2.30% 0.48% - 8.24%
Hospital Sample 4.69% 2.72% - 10.57%
In-ad 0.47% 0.11% - 1.82%
In-pack 2.53% 0.54% - 8.16%
In-pack Cross Ruff 0.84% 0.17% - 3.11%
Instant Redeemable 19.15% 5.98% - 36.27%
Instant Redeemable Cross Ruff 9.96% 2.93% - 21.69%
Internet Print-at-home 11.22% 3.07% - 28.31%
Magazine On-page 0.15% 0.02% - 0.64%
Magazine Pop-up 0.15% 0.07% - 0.27%
Military Handout 12.65% 3.31% - 21.99%
Military Magazine 1.42% 0.66% - 3.37%
Military Shelf Pad 19.98% 12.13% - 28.56%
Newspaper Co-op 0.34% 0.27% - 1.42%
Newspaper Run-of-press 0.37% 0.14% - 0.87%
On-pack 19.22% 4.64% - 34.25%
On-pack Cross Ruff 2.50% 0.86% - 7.47%
Shelf Box 9.82% 4.96% - 22.40%
Shelf Pad 8.76% 3.02% - 21.17%
Sunday Supplement 0.34% 0.04% - 2.04%
Middle-half rates and ranges eliminate the top and bottom 25% of the data to remove variability
and, thus, outliers. The chart above shows these rates and ranges by coupon distribution method
for 2013. Methods with the widest range of middle-half redemption rates include bounceback,
consumer relations, instant redeemable and on-pack.20 KEY TRENDS
FACE VALUE AND PURCHASE REQUIREMENT
AVERAGE FACE VALUE AVERAGE FACE VALUE DISTRIBUTED
DISTRIBUTED AND REDEEMED VS. CPI - PERCENT CHANGE
(EXCLUDING DIGITAL)
The average face value distributed decreased 0.6%
In 2013, the average face value distributed for all in 2013 in contrast to the Consumer Price Index, which
coupons, excluding digital, fell 0.6% to $1.56. In contrast, increased 1.5%. The fact that coupon average face values
the average face value redeemed increased 12.4% to $1.27. increased at a slower rate than CPI may have made coupons
Average face values distributed ranged from $0.71 for appear less attractive to consumers.
handout off-store location with sample coupons to $3.40 for
newspaper co-op coupons. The average face value distributed
for FSI coupons was $1.55 and the average face value AVERAGE FACE VALUE DISTRIBUTED
distributed for internet print-at-home coupons was $1.73. PER COUPON VS. AVERAGE FACE VALUE
From a product category standpoint, the average face values
distributed ranged from $0.93 for refrigerated coupons
DISTRIBUTED PER ITEM
to $3.80 for entertainment coupons.
Average face values redeemed ranged from $0.66 for
military magazine coupons to $3.70 for consumer relations
coupons. The average face value redeemed for FSI coupons
was $1.15 and the average face value redeemed for internet
print-at-home coupons was $1.52.
From a product category standpoint, the average face values
redeemed ranged from $0.88 for packaged deli coupons
to $4.74 for entertainment coupons.
In contrast to the average face value distributed per coupon,
the average face value distributed per item increased 1.5%
in 2013 to $1.33.KEY TRENDS 21
AVERAGE PURCHASE REQUIREMENT
DISTRIBUTED AND REDEEMED REDEMPTION PERIOD
(IN UNITS; EXCLUDING DIGITAL) AVERAGE REDEMPTION PERIOD
DISTRIBUTED AND REDEEMED
(IN MONTHS; EXCLUDING DIGITAL)
A coupon’s purchase requirement is the number of products
a consumer must buy to receive the discount. In 2013, the
average purchase requirement distributed for all coupons
decreased 5.1% to 1.48 units; the average purchase
requirement redeemed decreased 4.3% to 1.57 units. By definition, the redemption period of a coupon offer
The average purchase requirement distributed ranged is the length of time a consumer has to use the coupon.
from 1.00 units for color run-of-press coupons to 3.81 units In general, consumers prefer offers with longer redemption
for prenatal coupons. The average purchase requirement periods as they have more time to use the coupons.
distributed was 1.47 units for FSI coupons, and 1.35 units In 2013, the average redemption period distributed was
for internet print-at-home coupons. flat at 2.2 months, while the average redemption period
The average purchase requirement redeemed for all redeemed increased 0.1 months (1.9%) to 5.3 months.
coupons ranged from 1.01 units for color run-of-press The average redemption period distributed ranged from
coupons to 3.34 units for newspaper co-op coupons. 1.3 months for newspaper co-op coupons to 13.3 months
The average purchase requirement redeemed was for bounceback coupons. The average redemption period
1.50 units for FSI coupons, and 1.37 units for internet distributed was 1.9 months for FSI coupons and 4.9 months
print-at-home coupons. for internet print-at-home coupons.
With respect to product category, the average purchase The average redemption period redeemed for all coupons
requirement distributed ranged from 1.00 units for apparel ranged from 1.7 months for in-ad coupons to 21.5 months
coupons to 1.93 units for household coupons. The average for prenatal coupons. The average redemption period
purchase requirement redeemed ranged from 1.00 units redeemed was 2.0 months for FSI coupons and 6.0 months
for apparel coupons to 1.98 units for household coupons. for internet print-at-home coupons.
Despite having the highest purchase requirement for any The apparel category had the longest average redemption
product category (distributed AND redeemed), average period distributed at 4.6 months, while the entertainment
purchase requirement for household category coupons category had the shortest at 1.3 months. The healthcare
still declined from 2.21 units (redeemed) and 2.05 units category had the longest average redemption period
(distributed) in 2013. redeemed at 8.0 months, while the frozen category had
the shortest at 4.5 months.FOOD VS. NON-FOOD
FOOD VS. NON-FOOD 23

While food and non-food coupons may look similar, their performance, distribution and redemption trends vary
significantly. Industry-wide coupon trends provide a helpful starting point, but savvy marketers understand that proper
evaluation of their brands’ coupon performance requires a closer comparison of like offers. Between the macro (industry)
and micro (subcategory) sits this first level of analysis: distinguishing Food trends from Non-Food trends.

FOOD VS. NON-FOOD DISTRIBUTION
FOOD VS. NON-FOOD COUPON DISTRIBUTION (IN BILLIONS; EXCLUDING DIGITAL)

                                                                                                 In 2013, distribution
                                                                                                 volume for food coupons
                                                                                                 increased 1.2% to 129.8
                                                                                                 billion coupons, and
                                                                                                 distribution volume
                                                                                                 for non-food coupons
                                                                                                 increased 4.6% to 192.2
                                                                                                 billion coupons.

DISTRIBUTION INDEX BY MONTH –                                  DISTRIBUTION INDEX BY MONTH -
FOOD (EXCLUDING DIGITAL)                                       NON-FOOD (EXCLUDING DIGITAL)

As with the overall industry, food coupons are distributed     Coupon distribution for non-food products is also somewhat
in a repetitive cycle from year to year. The noticeable dip    cyclical, with a noticeable peak in January and a noticeable
in July may be due to differences in consumer behavior in      dip in December. 2013 saw a more dramatic drop in fourth
the summer (consumers cook less; they are on vacation,         quarter compared to other years.
etc.) The pattern, however, changed slightly in 2013, with
the July dip leveling off slightly and spring distribution
being more spread out.
24 FOOD VS. NON-FOOD
FOOD VS. NON-FOOD REDEMPTION
FOOD VS. NON-FOOD COUPON REDEMPTION
(IN BILLIONS; EXCLUDING DIGITAL)
In 2013, redemption for
food coupons was flat at
1.9 billion coupons and
redemption for non-food
coupons decreased 4.3%
to 0.9 billion coupons.
REDEMPTION INDEX BY MONTH – REDEMPTION INDEX BY MONTH –
FOOD (EXCLUDING DIGITAL) NON-FOOD (EXCLUDING DIGITAL)
In 2013, food redemption deviated slightly from the general As with food coupons, in 2013, non-food coupons
coupon redemption pattern with a small spike in June and a demonstrated a noticeable dip in redemption in October /
dip in October /November. November.
IN RECENT YEARS, FOOD OFFERS ACCOUNTED FOR ONLY 40% OF ALL COUPONS
DISTRIBUTED, BUT MORE THAN TWO-THIRDS OF COUPONS REDEEMED.FOOD VS. NON-FOOD 25
FOOD VS. NON-FOOD METHOD
PERCENT OF TOTAL COUPONS DISTRIBUTED BY METHOD – FOOD
(EXCLUDING DIGITAL)
Method 2009 2010 2011 2012 2013
Bounceback < 0.1% < 0.1% 0.2% < 0.1% < 0.1%
Color Run-of-press < 0.1% < 0.1% < 0.1% < 0.1% < 0.1%
Consumer Relations 0.1% < 0.1% < 0.1% 0.1% < 0.1%
Direct Home Delivery < 0.1% < 0.1% < 0.1% < 0.1% < 0.1%
Direct Mail 1.7% 1.6% 1.4% 1.1% 1.8%
Direct Mail Co-op 0.2% 0.1% 0.3% 0.3% 0.3%
Direct Mail with Sample < 0.1% < 0.1% < 0.1% < 0.1% < 0.1%
Electronic Checkout 2.4% 2.3% 1.8% 1.9% 2.0%
Electronic Kiosk < 0.1% < 0.1% < 0.1% < 0.1% < 0.1%
Electronic Shelf 0.4% 0.3% 0.2% 0.2% 0.3%
Free-standing Insert 82.9% 80.5% 81.9% 84.1% 84.4%
Handout 1.3% 1.3% 1.2% 0.8% 0.8%
Handout Co-op 0.1% 0.2% 0.2% 0.1% 0.1%
Handout In-store with Sample < 0.1% < 0.1% 0.1% 0.1% 0.1%
Handout Off-store Location < 0.1% < 0.1% < 0.1% 0.1% < 0.1%
Handout Off-store Location Co-op < 0.1% < 0.1% < 0.1% < 0.1% < 0.1%
Handout Off-store Location with Sample < 0.1% < 0.1% < 0.1% < 0.1% 0.1%
Hospital Sample < 0.1% < 0.1% < 0.1% < 0.1% 0.1%
In-ad 4.3% 6.5% 6.3% 5.5% 4.7%
In-pack 0.5% 0.4% 0.3% 0.3% 0.2%
In-pack Cross Ruff 0.1% 0.2% 0.2% 0.1% 0.3%
Instant Redeemable 0.7% 1.0% 1.2% 0.8% 1.1%
Instant Redeemable Cross Ruff 0.6% 0.7% 0.7% 0.9% 0.7%
Internet Print-at-home 0.2% 0.5% 0.4% 0.5% 0.5%
Magazine On-page 1.6% 1.8% 1.1% 0.9% 0.7%
Magazine Pop-up 0.3% 0.2% < 0.1% 0.1% 0.1%
Military Handout < 0.1% < 0.1% < 0.1% 0.1% < 0.1%
Military Magazine 0.1% 0.1% < 0.1% < 0.1% < 0.1%
Military Shelf Pad 0.1% 0.1% 0.1% < 0.1% < 0.1%
Newspaper Co-op 0.1% < 0.1% 0.1% < 0.1% 0.1%
Newspaper Run-of-press 0.3% 0.1% 0.2% 0.1% 0.1%
On-pack 0.3% 0.3% 0.3% 0.2% 0.1%
On-pack Cross Ruff 0.2% 0.3% 0.2% 0.2% 0.3%
Prenatal < 0.1% n /a n /a n /a < 0.1%
Shelf Box 0.1% 0.1% < 0.1% 0.1% < 0.1%
Shelf Pad 1.1% 1.2% 1.2% 0.9% 0.9%
Sunday Supplement 0.2% 0.1% 0.2% 0.3% 0.1%
In 2013, 84.4% of all coupons distributed for food products were free-standing insert (FSI)
coupons. Other methods with at least 1.0% of total food coupon distribution were direct
mail, electronic checkout, in-ad and instant redeemable.26 FOOD VS. NON-FOOD
PERCENT OF TOTAL COUPONS DISTRIBUTED BY METHOD – NON-FOOD
(EXCLUDING DIGITAL)
Method 2009 2010 2011 2012 2013
Bounceback < 0.1% < 0.1% < 0.1% < 0.1% < 0.1%
Color Run-of-press < 0.1% 0.1% < 0.1% < 0.1% < 0.1%
Consumer Relations < 0.1% < 0.1% 0.1% < 0.1% < 0.1%
Direct Home Delivery < 0.1% < 0.1% < 0.1% < 0.1% < 0.1%
Direct Mail 0.9% 0.5% 0.5% 0.4% 0.4%
Direct Mail Co-op 0.1% 0.2% 0.2% 0.5% 0.1%
Direct Mail with Sample < 0.1% < 0.1% < 0.1% < 0.1% < 0.1%
Electronic Checkout 0.6% 0.6% 0.4% 0.4% 0.5%
Electronic Kiosk < 0.1% < 0.1% < 0.1% < 0.1% < 0.1%
Electronic Shelf 0.2% 0.1% 0.1% 0.1% 0.1%
Free-standing Insert 91.8% 91.0% 90.7% 91.0% 92.1%
Handout 0.8% 0.7% 0.6% 0.6% 0.5%
Handout Co-op 0.1% 0.1% 0.1% 0.1% < 0.1%
Handout In-store with Sample 0.1% < 0.1% 0.1% 0.1% < 0.1%
Handout Off-store Location 0.1% 0.1% < 0.1% 0.1% 0.1%
Handout Off-store Location Co-op < 0.1% < 0.1% 0.1% < 0.1% < 0.1%
Handout Off-store Location with Sample < 0.1% 0.1% < 0.1% < 0.1% < 0.1%
Hospital Sample < 0.1% < 0.1% < 0.1% < 0.1% < 0.1%
In-ad 0.5% 0.7% 0.7% 0.9% 0.3%
In-pack 0.5% 0.5% 0.5% 0.5% 0.5%
In-pack Cross Ruff 0.4% 0.6% 0.3% 0.2% 0.3%
Instant Redeemable 0.3% 0.4% 0.3% 0.3% 0.3%
Instant Redeemable Cross Ruff 0.2% 0.1% 0.1% 0.1% 0.1%
Internet Print-at-home 0.4% 0.3% 0.3% 0.4% 0.3%
Magazine On-page 1.7% 2.0% 2.0% 1.6% 1.5%
Magazine Pop-up 0.7% 0.6% 1.3% 1.7% 1.6%
Military Handout 0.1% < 0.1% < 0.1% < 0.1% < 0.1%
Military Magazine < 0.1% < 0.1% < 0.1% < 0.1% < 0.1%
Military Shelf Pad < 0.1% < 0.1% < 0.1% < 0.1% < 0.1%
Newspaper Co-op < 0.1% < 0.1% < 0.1% < 0.1% 0.1%
Newspaper Run-of-press 0.1% 0.3% 0.3% < 0.1% < 0.1%
On-pack 0.1% 0.1% < 0.1% < 0.1% < 0.1%
On-pack Cross Ruff < 0.1% 0.1% < 0.1% < 0.1% < 0.1%
Prenatal n /a < 0.1% n /a n /a n /a
Shelf Box < 0.1% < 0.1% < 0.1% < 0.1% < 0.1%
Shelf Pad 0.1% 0.2% 0.1% 0.1% 0.1%
Sunday Supplement 0.1% 0.6% 0.8% 0.7% 1.0%
With 92.1% of total, FSI coupons dominated the coupon distribution mix for non-food
coupons. Other methods with at least 1.0% of total non-food coupon distribution included
magazine on-page, magazine pop-up and Sunday supplement.FOOD VS. NON-FOOD 27
PERCENT OF TOTAL COUPONS REDEEMED BY METHOD – FOOD
(EXCLUDING DIGITAL)
Method 2009 2010 2011 2012 2013
Bounceback 0.2% 0.2% 0.2% 0.1% 0.1%
Color Run-of-press < 0.1% < 0.1% < 0.1% < 0.1% < 0.1%
Consumer Relations 0.5% 0.4% 0.4% 0.5% 0.4%
Direct Home Delivery < 0.1% 0.3% 0.1% < 0.1% < 0.1%
Direct Mail 3.1% 3.3% 3.9% 4.2% 4.8%
Direct Mail Co-op 0.7% 0.4% 0.4% 0.5% 0.6%
Direct Mail with Sample < 0.1% < 0.1% < 0.1% < 0.1% < 0.1%
Electronic Checkout 9.6% 9.5% 8.4% 9.3% 10.0%
Electronic Kiosk < 0.1% < 0.1% < 0.1% 0.1% 0.1%
Electronic Shelf 1.9% 2.0% 2.2% 2.0% 2.7%
Free-standing Insert 45.2% 41.2% 41.7% 41.6% 37.5%
Handout 3.8% 2.9% 3.2% 3.0% 3.0%
Handout Co-op 0.1% 0.2% 0.1% 0.1% 0.2%
Handout In-store with Sample 0.2% 0.2% 0.3% 0.4% 0.4%
Handout Off-store Location 0.1% 0.2% 0.1% 0.1% 0.1%
Handout Off-store Location Co-op < 0.1% < 0.1% < 0.1% 0.1% < 0.1%
Handout Off-store Location with Sample 0.1% 0.1% < 0.1% < 0.1% 0.1%
Hospital Sample < 0.1% < 0.1% < 0.1% < 0.1% 0.1%
In-ad 3.0% 3.2% 2.2% 2.0% 1.4%
In-pack 1.7% 1.3% 1.0% 0.7% 1.2%
In-pack Cross Ruff 0.1% 0.2% 0.2% 0.1% 0.2%
Instant Redeemable 9.1% 11.2% 11.6% 10.7% 13.8%
Instant Redeemable Cross Ruff 6.0% 4.9% 5.5% 6.8% 5.4%
Internet Print-at-home 1.5% 2.7% 4.3% 4.2% 4.9%
Magazine On-page 0.7% 0.7% 0.6% 0.5% 0.4%
Magazine Pop-up 0.2% 0.2% 0.1% < 0.1% < 0.1%
Military Handout 0.3% 0.2% 0.3% 0.3% 0.3%
Military Magazine 0.1% 0.1% 0.1% < 0.1% < 0.1%
Military Shelf Pad 1.0% 0.8% 0.6% 0.6% 0.6%
Newspaper Co-op < 0.1% < 0.1% < 0.1% < 0.1% < 0.1%
Newspaper Run-of-press 0.1% 0.1% < 0.1% < 0.1% < 0.1%
On-pack 2.3% 2.5% 2.0% 2.3% 2.2%
On-pack Cross Ruff 0.3% 0.3% 0.4% 0.3% 0.6%
Prenatal < 0.1% < 0.1% < 0.1% < 0.1% < 0.1%
Shelf Box 0.4% 0.5% 0.3% 0.3% 0.4%
Shelf Pad 7.5% 10.3% 9.6% 8.2% 8.2%
Sunday Supplement 0.1% < 0.1% < 0.1% 0.6% 0.2%
FSIs accounted for 37.5% of all coupons redeemed for food products in 2013. Other notable
methods included instant redeemable (IR) /IR cross ruff, electronic checkout, shelf pad
and internet print-at-home coupons. Other methods with at least 1.0% of total food coupon
redemption included direct mail, electronic shelf and on-pack.28 FOOD VS. NON-FOOD
PERCENT OF TOTAL COUPONS REDEEMED BY METHOD – NON-FOOD
(EXCLUDING DIGITAL)
Method 2009 2010 2011 2012 2013
Beginnings Magazine < 0.1% n /a n /a n /a n /a
Bounceback 0.2% 0.2% 0.2% 0.1% 0.1%
Color Run-of-press < 0.1% < 0.1% < 0.1% < 0.1% < 0.1%
Consumer Relations 0.2% 0.2% 0.3% 0.3% 0.3%
Direct Home Delivery < 0.1% < 0.1% < 0.1% < 0.1% < 0.1%
Direct Mail 2.4% 1.9% 2.4% 2.6% 2.8%
Direct Mail Co-op 0.5% 0.7% 0.4% 0.6% 0.3%
Direct Mail with Sample 0.1% < 0.1% < 0.1% 0.1% < 0.1%
Electronic Checkout 5.1% 5.7% 6.3% 5.6% 5.3%
Electronic Kiosk < 0.1% < 0.1% < 0.1% 0.1% < 0.1%
Electronic Shelf 1.4% 1.2% 1.0% 0.8% 0.7%
Free-standing Insert 55.8% 49.1% 48.0% 48.4% 47.8%
Handout 2.8% 2.8% 2.7% 3.2% 3.0%
Handout Co-op 0.1% 0.1% 0.1% 0.1% < 0.1%
Handout In-store with Sample 0.1% 0.1% 0.1% 0.3% 0.3%
Handout Off-store Location 0.2% 0.3% 0.2% 0.2% 0.2%
Handout Off-store Location Co-op < 0.1% < 0.1% < 0.1% < 0.1% < 0.1%
Handout Off-store Location with Sample 0.1% 0.1% 0.1% 0.1% 0.1%
Hospital Sample 0.1% 0.2% 0.1% < 0.1% 0.1%
In-ad 0.3% 0.6% 0.9% 0.7% 1.1%
In-pack 5.3% 4.5% 5.7% 4.8% 3.8%
In-pack Cross Ruff 1.3% 1.3% 1.1% 1.3% 1.0%
Instant Redeemable 9.4% 17.0% 14.9% 15.9% 19.1%
Instant Redeemable Cross Ruff 6.6% 3.7% 2.3% 3.3% 3.0%
Internet Print-at-home 1.6% 3.1% 5.3% 5.3% 5.8%
Magazine On-page 0.5% 0.6% 0.8% 0.4% 0.5%
Magazine Pop-up 0.4% 0.4% 0.5% 0.7% 0.8%
Military Handout 0.9% 0.7% 0.5% 0.7% 0.6%
Military Magazine < 0.1% < 0.1% < 0.1% < 0.1% 0.1%
Military Shelf Pad 0.6% 0.5% 0.4% 0.4% 0.4%
Newspaper Co-op < 0.1% < 0.1% < 0.1% < 0.1% < 0.1%
Newspaper Run-of-press 0.1% < 0.1% 0.1% < 0.1% < 0.1%
On-pack 1.4% 1.2% 2.7% 1.4% 0.9%
On-pack Cross Ruff 0.5% 1.0% 0.5% 0.4% 0.2%
Prenatal < 0.1% < 0.1% < 0.1% < 0.1% < 0.1%
Shelf Box < 0.1% < 0.1% < 0.1% < 0.1% 0.1%
Shelf Pad 1.9% 2.4% 2.1% 2.1% 1.5%
Sunday Supplement < 0.1% 0.1% < 0.1% < 0.1% 0.1%
Free-standing insert (FSI) coupons accounted for 47.8% of total coupon redemption for
non-food coupons in 2013. Other notable methods included instant redeemable, internet
print-at-home and electronic checkout coupons. Other methods with at least 1.0% of total
non-food coupon redemption included direct mail, handout, in-ad, in-pack, in-pack cross
ruff, instant redeemable, instant redeemable cross ruff and shelf pad.FOOD VS. NON-FOOD 29
2013 METHOD INDEX – FOOD 2013 METHOD INDEX – NON-FOOD
(EXCLUDING DIGITAL) (EXCLUDING DIGITAL)
Method 2013 Method 2013
Consumer Relations 3309 Consumer Relations 13854
Bounceback 2366 Instant Redeemable 7124
Military Shelf Pad 1735 On-pack 2694
On-pack 1489 Instant Redeemable Cross Ruff 2224
Instant Redeemable 1259 Shelf Pad 1912
Internet Print-at-home 1014 Military Handout 1813
Shelf Pad 932 Military Shelf Pad 1749
Shelf Box 888 Internet Print-at-home 1715
Electronic Shelf 794 Shelf Box 1440
Instant Redeemable Cross Ruff 768 Bounceback 1185
In-pack 664 Electronic Checkout 1138
Military Handout 661 Military Magazine 1095
Handout Off-store Location 632 Handout In-store with Sample 1030
Handout In-store with Sample 559 Electronic Shelf 1019
Electronic Checkout 497 Electronic Kiosk 977
Electronic Kiosk 390 In-pack 815
Direct Home Delivery 374 Hospital Sample 667
Handout 362 Direct Mail 647
Direct Mail 272 Handout 640
Handout Off-store Location Co-op 247 Handout Off-store Location with Sample 558
Hospital Sample 232 On-pack Cross Ruff 457
Color Run-of-press 199 In-ad 395
Direct Mail Co-op 193 In-pack Cross Ruff 381
Direct Mail with Sample 190 Direct Mail Co-op 326
On-pack Cross Ruff 183 Handout Off-store Location 262
Military Magazine 172 Direct Mail with Sample 170
Sunday Supplement 171 Direct Home Delivery 112
Handout Co-op 133 Color Run-of-press 109
Handout Off-store Location with Sample 121 Handout Co-op 101
In-pack Cross Ruff 71 Free-standing Insert 52
Magazine On-page 52 Magazine Pop-up 50
Prenatal 45 Magazine On-page 35
Free-standing Insert 44 Newspaper Run-of-press 32
In-ad 31 Handout Off-store Location Co-op 16
Newspaper Run-of-press 30 Newspaper Co-op 10
Magazine Pop-up 29 Sunday Supplement 10
Newspaper Co-op 27
In 2013, in-store distributed coupons such as instant
As with the overall industry, in-store distributed redeemable and shelf pad were well received by non-
coupons such as instant redeemable, shelf pad, food consumers. Coupons which encouraged repeat
electronic shelf and shelf box were among the coupons purchase (in-pack and on-pack) also generated high
most favored by food consumers. indices among non-food consumers.30 FOOD VS. NON-FOOD
REDEMPTION RATES BY METHOD – FOOD
(EXCLUDING DIGITAL)
Method 2009 2010 2011 2012 2013
Bounceback 8.07% 25.71% 10.23% 0.37% 2.43%
Color Run-of-press 0.99% 0.59% 0.32% 1.17% 0.54%
Consumer Relations 23.43% 15.11% 22.21% 26.74% 4.21%
Direct Home Delivery 3.33% 4.83% 17.82% 0.55% 1.50%
Direct Mail 3.03% 2.92% 3.48% 5.14% 5.27%
Direct Mail Co-op 5.01% 4.97% 3.65% 2.26% 2.41%
Direct Mail with Sample 6.41% 4.72% 1.08% 2.75% 3.31%
Electronic Checkout 7.04% 6.55% 7.42% 7.97% 6.85%
Electronic Kiosk 5.88% 4.59% 4.34% 4.63% 3.20%
Electronic Shelf 5.86% 7.31% 9.68% 15.75% 12.20%
Free-standing Insert 0.77% 0.87% 0.81% 0.89% 0.75%
Handout 3.81% 3.97% 3.39% 4.23% 4.79%
Handout Co-op 3.14% 1.62% 1.66% 1.16% 1.91%
Handout In-store with Sample 5.17% 5.41% 7.24% 8.02% 6.96%
Handout Off-store Location 4.57% 5.21% 5.28% 5.14% 3.74%
Handout Off-store Location Co-op 2.14% 1.01% 1.09% 2.29% 2.35%
Handout Off-store Location with Sample 6.89% 2.76% 4.95% 3.98% 2.30%
Hospital Sample 1.51% 1.90% 4.10% n /a n /a
In-ad 0.82% 1.01% 0.66% 0.60% 0.48%
In-pack 3.85% 4.62% 5.67% 4.78% 5.18%
In-pack Cross Ruff 1.57% 1.43% 2.63% 2.79% 1.20%
Instant Redeemable 13.51% 19.03% 19.03% 15.93% 19.52%
Instant Redeemable Cross Ruff 12.71% 13.64% 10.52% 12.10% 9.81%
Internet Print-at-home 8.71% 14.14% 9.26% 16.91% 11.59%
Magazine On-page 0.69% 0.68% 0.69% 0.92% 0.76%
Magazine Pop-up 0.70% 0.87% 1.12% 0.80% 0.51%
Military Handout 10.70% 9.46% 9.45% 8.50% 9.13%
Military Magazine 1.79% 2.10% 1.94% 2.76% 2.04%
Military Shelf Pad 20.41% 21.46% 21.60% 19.96% 21.37%
Newspaper Co-op 0.87% 0.51% 0.54% 0.45% 0.29%
Newspaper Run-of-press 0.45% 0.50% 0.99% 0.35% 0.46%
On-pack 7.04% 11.12% 11.54% 10.26% 12.91%
On-pack Cross Ruff 1.50% 2.67% 2.88% 2.45% 3.17%
Shelf Box 8.56% 8.17% 12.16% 10.26% 11.10%
Shelf Pad 9.60% 11.27% 13.34% 12.61% 11.51%
Sunday Supplement 1.54% 0.74% 0.66% 0.25% n /a
In 2013, average redemption rates in the food product category ranged from 0.29% for
newspaper co-op coupons to 21.37% for military shelf pad coupons. At 0.75%, the average
redemption rate for FSI coupons was above the overall industry average of 0.47%.FOOD VS. NON-FOOD 31
MIDDLE-HALF RATES AND RANGES BY METHOD – FOOD
(EXCLUDING DIGITAL)
Method REDEMPTION RATE REDEMPTION RATE RANGE
Bounceback 3.75% 1.64% - 21.24%
Color Run-of-press 0.57% 0.21% - 4.87%
Consumer Relations 21.63% 7.11% - 42.00%
Direct Home Delivery 1.79% 0.36% - 2.65%
Direct Mail 7.29% 2.42% - 18.21%
Direct Mail Co-op 6.73% 1.64% - 14.61%
Direct Mail with Sample 1.94% 1.11% - 2.92%
Electronic Checkout 6.78% 2.94% - 12.91%
Electronic Kiosk 4.12% 1.86% - 9.63%
Electronic Shelf 9.69% 3.05% - 19.17%
Free-standing Insert 0.64% 0.29% - 1.15%
Handout 7.30% 1.99% - 24.48%
Handout Co-op 1.84% 0.67% - 4.69%
Handout In-store with Sample 5.55% 2.12% - 13.95%
Handout Off-store Location 6.02% 1.16% - 31.83%
Handout Off-store Location Co-op 0.96% 0.33% - 3.47%
Handout Off-store Location with Sample 3.88% 1.08% - 16.86%
In-ad 0.45% 0.12% - 1.82%
In-pack 4.05% 1.23% - 9.67%
In-pack Cross Ruff 1.33% 0.39% - 4.79%
Instant Redeemable 16.77% 5.23% - 32.86%
Instant Redeemable Cross Ruff 9.38% 2.77% - 20.40%
Internet Print-at-home 15.64% 4.90% - 35.18%
Magazine On-page 0.53% 0.19% - 1.55%
Magazine Pop-up 0.51% 0.13% - 1.22%
Military Handout 5.33% 1.33% - 20.40%
Military Magazine 1.42% 0.66% - 2.36%
Military Shelf Pad 21.24% 13.60% - 29.62%
Newspaper Co-op 0.28% 0.04% - 0.92%
Newspaper Run-of-press 0.31% 0.14% - 0.71%
On-pack 19.76% 5.00% - 35.36%
On-pack Cross Ruff 2.61% 0.88% - 7.21%
Shelf Box 10.26% 5.51% - 22.40%
Shelf Pad 9.20% 3.24% - 21.37%
Middle-half rates and ranges eliminate the top and bottom 25% of the data to remove
variability and, thus, outliers. The chart above shows these rates and ranges by coupon
distribution method for food products for 2013. Methods with the widest range of middle-half
average redemption rates include consumer relations, handout off-store location, internet print
at home and on-pack.32 FOOD VS. NON-FOOD
REDEMPTION RATES BY METHOD – NON-FOOD
(EXCLUDING DIGITAL)
Method 2009 2010 2011 2012 2013
Bounceback 11.84% 12.44% 3.05% 7.85% 6.71%
Color Run-of-press 0.01% n /a 0.10% 0.04% n /a
Consumer Relations 13.45% 17.93% 8.92% 1.07% 7.43%
Direct Home Delivery 1.32% 1.57% 3.09% 0.71% 0.83%
Direct Mail 2.02% 1.55% 2.54% 2.81% 2.90%
Direct Mail Co-op 1.29% 2.91% 1.64% 1.31% 0.51%
Direct Mail with Sample 1.57% 2.22% 1.77% 2.21% 0.71%
Electronic Checkout 5.89% 5.57% 5.79% 7.15% 5.91%
Electronic Kiosk 4.04% n /a 3.52% 8.57% 4.13%
Electronic Shelf 3.68% 5.99% 6.34% 8.25% 7.76%
Free-standing Insert 0.39% 0.40% 0.33% 0.35% 0.29%
Handout 1.89% 2.31% 2.20% 2.63% 2.54%
Handout Co-op 0.69% 0.77% 1.20% 0.75% 0.43%
Handout In-store with Sample 1.91% 1.54% 1.33% 1.71% 2.16%
Handout Off-store Location 0.59% 1.06% 2.62% 1.82% 1.23%
Handout Off-store Location Co-op 0.28% 0.90% 0.59% 0.08% n /a
Handout Off-store Location with Sample 0.78% 2.68% 1.82% 2.00% 3.01%
Hospital Sample 2.71% 2.52% 1.05% 0.86% n /a
In-ad 0.34% 0.34% 0.40% 0.69% 0.40%
In-pack 5.36% 5.64% 5.10% 5.86% 2.80%
In-pack Cross Ruff 2.77% 1.72% 1.63% 1.76% 1.86%
Instant Redeemable 29.04% 29.98% 30.06% 25.81% 32.67%
Instant Redeemable Cross Ruff 9.01% 19.29% 7.52% 10.31% 19.31%
Internet Print-at-home 6.86% 2.80% 5.77% 8.18% 6.63%
Magazine On-page 0.13% 0.25% 0.16% 0.24% 0.10%
Magazine Pop-up 0.58% 0.39% 0.39% 0.28% 0.21%
Military Handout 8.09% 11.28% 10.47% 9.74% 9.96%
Military Magazine 3.89% 2.25% 1.46% 1.84% 3.58%
Military Shelf Pad 6.52% 25.87% 18.14% 12.42% 11.74%
Newspaper Co-op 0.19% n /a 0.07% n /a 1.60%
Newspaper Run-of-press 0.04% 0.09% 0.05% 0.12% 0.23%
On-pack 4.86% 16.00% 19.07% 23.26% 12.65%
On-pack Cross Ruff 18.52% 7.53% 4.14% 11.03% 2.27%
Shelf Box 3.35% 1.10% n /a 3.70% 4.80%
Shelf Pad 6.22% 14.23% 7.13% 6.86% 8.47%
Sunday Supplement 0.14% 0.19% 0.31% 0.04% 0.04%
Average redemption rates in the non-food product category ranged from 0.04% for Sunday
supplement coupons to 32.67% for instant redeemable coupons. At 0.29%, the average
redemption rate for FSI coupons was below the overall industry average of 0.47%.FOOD VS. NON-FOOD 33
MIDDLE-HALF RATES AND RANGES BY METHOD – NON-FOOD
(EXCLUDING DIGITAL)
Method REDEMPTION RATE REDEMPTION RATE RANGE
Bounceback 7.54% 2.02% -63.89%
Consumer Relations 23.84% 7.00% -45.36%
Direct Home Delivery 0.38% 0.34% - 2.94%
Direct Mail 3.88% 0.71% - 11.87%
Direct Mail Co-op 2.10% 0.63% -9.14%
Direct Mail with Sample 0.63% 0.32% -1.38%
Electronic Checkout 3.64% 0.96% -9.12%
Electronic Kiosk 3.42% 1.78% -7.29%
Electronic Shelf 5.39% 0.88% -14.17%
Free-standing Insert 0.18% 0.07% -0.37%
Handout 5.05% 0.79% - 23.52%
Handout Co-op 1.62% 0.45% -6.39%
Handout In-store with Sample 1.04% 0.22% -2.86%
Handout Off-store Location 5.40% 2.20% -24.00%
Handout Off-store Location with Sample 1.97% 0.20% -5.16%
In-ad 0.49% 0.09% - 1.79%
In-pack 2.09% 0.39% -6.58%
In-pack Cross Ruff 0.77% 0.14% -2.69%
Instant Redeemable 31.88% 12.46% -48.02%
Instant Redeemable Cross Ruff 19.19% 4.86% -36.25%
Internet Print-at-home 7.69% 1.94% -19.75%
Magazine On-page 0.05% 0.01% -0.10%
Magazine Pop-up 0.14% 0.07% -0.23%
Military Handout 17.32% 10.19% -23.30%
Military Shelf Pad 15.90% 4.66% -22.98%
On-pack 15.52% 3.18% -29.64%
On-pack Cross Ruff 1.95% 0.86% -7.47%
Shelf Box 4.31% 0.35% - 18.06%
Shelf Pad 7.67% 1.87% -17.47%
Sunday Supplement 0.04% 0.02% - 0.05%
Middle-half rates and ranges eliminate the top and bottom 25% of the data to remove
variability and, thus, outliers. The chart above shows these rates and ranges by coupon
distribution method for food products for 2013. Methods with the widest range of middle-half
average redemption rates include bounceback, consumer relations, instant redeemable and
instant redeemable cross ruff.34 FOOD VS. NON-FOOD FACE VALUE AND PURCHASE REQUIREMENT AVERAGE FACE VALUE DISTRIBUTED AND REDEEMED – FOOD VS. NON-FOOD (EXCLUDING DIGITAL) In 2013, the average face value distributed for food coupons The average face value redeemed for food coupons decreased 3.7% to $1.03. In contrast, the average face decreased 2.8% to $1.06, while the average face value value distributed for non-food coupons increased only redeemed for non-food coupons was flat at $1.69. 0.5% to $1.92.
FOOD VS. NON-FOOD 35

AVERAGE FACE VALUE DISTRIBUTED PER COUPON VS. AVERAGE FACE VALUE
DISTRIBUTED PER ITEM (EXCLUDING DIGITAL)

As the average face value distributed per coupon for food     in the food category used multiple-purchase coupons to
products decreased, so did the average face value per item.   promote their products.
In 2013, the average face value distributed per coupon        In the non-food category, the average face value distributed
for food products was $1.03, while the average face value     per coupon was up 0.5%, while the average face value
distributed per item was $0.77, suggesting that marketers     distributed per item increased 1.8%.
36 FOOD VS. NON-FOOD

AVERAGE PURCHASE REQUIREMENT DISTRIBUTED AND REDEEMED – FOOD VS. NON-FOOD
(IN UNITS; EXCLUDING DIGITAL)

In 2013, the average purchase requirement distributed       The average purchase requirement redeemed for food
for food products decreased 3.8% to 1.53 units, while       products decreased 2.5% to 1.53 units, while the average
the average purchase requirement distributed for non-food   purchase requirement redeemed for non-food products
products decreased 5.8% to 1.45 units.                      decreased 7.9% to 1.64 units.
FOOD VS. NON-FOOD 37

REDEMPTION PERIOD
AVERAGE REDEMPTION PERIOD DISTRIBUTED AND REDEEMED – FOOD VS. NON-FOOD
(IN MONTHS; EXCLUDING DIGITAL)

In 2013, the average redemption period distributed           coupons was down 9.1% to 2.0 months, but the average
for food coupons was flat at 2.4 months, while the average   redemption period redeemed increased 1.5% to 6.6 months.
redemption period redeemed was up 4.4% to 4.7 months.
The average redemption period distributed for non-food
DIGITAL Promotions
DIGITAL PROMOTIONS 39

DIGITAL PROMOTION ANALYTICS SUMMARY
It’s bigger, it’s better… and it’s only just getting started. For the first time, both print-at-home coupons and digital paperless
coupons each surpassed 1 billion prints or downloads. More than 2 billion times in 2013, shoppers found and selected the
manufacturer deals they wanted through digital technologies.
That also means a great deal of experimentation is taking place with new players adopting new tactics. Inmar sits at the nexus
of these complex digital promotion data streams.
Two distinct mediums are considered by some to be “digital promotions” due to the fact that shoppers engage with them directly
through digital media (as opposed to other “electronic” methods): internet print-at-home (PAH), and digital paperless (Load-
to-card/L2C). We analyzed thousands of actual campaigns, and tens of millions of redemptions, across multiple categories
(both food and non-food), retailers, and technology providers to gain more specific insights on these rapidly evolving methods.1

A NOTE ON DIGITAL REDEMPTION RATES                                         PRINT AT HOME INSIGHTS:
It is critical to note that when things like “redemption rate”             • Approximately 1.27 billion offers were printed in 2013,
are reported, it does not directly correlate to the traditional              with 145 million redemptions.
FSI or paper-based redemption rate. FSI distribution best                  • The average redemption rate for these normalized
correlates to the number of “views” a digital promotion                      campaigns was 17%, with an average face value
campaign may have received through various mediums,                          of $1.86.
which are much more difficult to quantify. “Clips”
or “prints” are used for calculating digital redemption                       – For Food offers, the average redemption rate
rates, and are best correlated to shoppers “clipping”                      			 was 21.6% with an average face value of $1.21.
an offer from an FSI — which, for obvious reasons,                            – For Non-Food offers, the average redemption rate
is also extremely difficult to quantify. For this reason                   			 was 12.1% with an average face value of $2.55.
it is best to consider “digital versus digital” metrics for                • A broad distribution of results illustrates that multiple
the sake of comparison, and to rely on broader goals                         factors (category, face value, brand influence, trade
and measurements for help with promotional marketing-                        activity, advertising support, etc.) will significantly
mix decisions.                                                               influence results.
Inmar took an in-depth look at PAH and L2C campaigns
from the end of 2012 through most of 2013. The intent
was to gain more actionable insights by focusing on
comparable campaigns, rather than the full aggregate.
For this reason, some PAH data in this section will differ
from what is found elsewhere in the report. The following
is a topline view of the insights gathered.

1
    PAH analysis included more than 5000 campaigns launched between July 2012 and September 2013, representing nearly 55 million redemptions.
    Paperless-L2C analysis included more than 2500 campaigns in the same time period, representing more than 10 million redemptions.
40 DIGITAL PROMOTIONS
DIGITAL PAPERLESS (LOAD TO CARD) INSIGHTS:
• Load-to-card programs surpassed the 1 billion clip mark the digital waters (and consumers eagerly responding to this
in 2013. Approximately 66 million paperless offers new, compelling coupon offer content), but the increased
were redeemed through “open” digital media,2 revealing precision, targeting and specificity of such offers. In other
a redemption growth rate of 141%. words, as manufacturers’ targeting methodologies become
• The average redemption rate was 6.32% with an average more sophisticated, the distribution volume for such offers
face value of $1.40. becomes necessarily smaller.
– For Food offers, the average redemption rate As with any new promotional method (or advertising,
was 7.2% with an average face value of $1.34. or technology), there is no such thing as “build it and they
will come” success. Huge variations will occur through
– For Non-Food offers, the average redemption rate the combination of factors at play during a campaign
was 4.8% with an average face value of $1.51. (and redemption rate itself is only a single measure).
• L2C also had a fairly broad distribution of results, Some anecdotal observations certainly revealed campaigns
illustrating that multiple factors (category, face value, with a “fire and forget” approach resulting in low rates
brand influence, trade activity, advertising support, etc.) and engagement, versus others with well-targeted,
will significantly influence results. solid returns.
The average redemption rate we discovered was lower Because these variations can make budgeting and
than the 11% we reported for 2012. This appears to be forecasting a challenge, one way to normalize the influence
the result of a variety of factors, including the rapid of outlier campaigns is to analyze the “middle half” of a
implementation of digital technologies into more retail coupon method. Middle-half rates and ranges eliminate
banners and a broader distribution of brands getting the top and bottom 25% of the data to remove variability
into the game. Digging more deeply into the data, and, thus, outliers. The chart below shows these rates and
we can observe significant differences in how offers ranges for print-at-home and paperless digital coupon offers
are constructed and targeted, including results from analyzed in 2013. Note the wide range of redemption rates
retailer to retailer, brand to brand, and even campaign that exist within these middle half averages; even when the
to campaign. For example, when digital offers were top and bottom 25% of data are eliminated, a significant
grouped by campaign size, a surprising redemption trend range for “typical” performance still exists. Keep this in
was uncovered: smaller campaigns (e.g., 5,000 – 10,000 mind when attempting to forecast digital redemption rates:
clips/distributed) had a significantly higher average even for the “middle half” of data, a wide range of rates can
redemption rate (14.71%) than every other cluster. be experienced and should be anticipated!
This can be attributed not only to new manufacturers testing
Method Middle 50% Range Middle 50% Average
PAH – Food Category 5.0% - 32.5% 15.76%
L2C – Food Category 1.5% - 10.7% 4.93%
PAH – Non-Food Category 2.8% - 14.6% 7.37%
L2C – Non-Food Category 1.3% - 7.4% 3.59%
A NOTE ON DUAL-METHOD PROGRAMS
Inmar clients continue to utilize a digital promotion tactic budget. Dual method offers are not included in this study.
that Inmar calls “dual method,” or those campaigns defined We highly discourage this practice due to the vastly different
as either delivering PAH prints or L2C clips under the same shopper experience each method represents. As with any
2
Retail store digital offers and digital offers distributed through systems without third-party access are considered “closed,” and are not included
in this analysis.You can also read