COVAXXY: A GLOBAL COLLECTION OF ENGLISH-LANGUAGE TWITTER POSTS ABOUT COVID-19 VACCINES - ARXIV.ORG
←
→
Page content transcription
If your browser does not render page correctly, please read the page content below

CoVaxxy: A global collection of English-language
                                                                           Twitter posts about COVID-19 vaccines
                                                    Matthew R. DeVerna,∗1 Francesco Pierri,∗1,2 Bao Tran Truong,∗1 John Bollenbacher,∗1
                                                      David Axelrod,1 Niklas Loynes,3,4 Christopher Torres-Lugo,1 Kai-Cheng Yang,1
                                                                          Filippo Menczer,†1 and John Bryden†1
                                                                  1
                                                                   Observatory on Social Media, Indiana University, Bloomington, Indiana, United States
                                                           2
                                                               Dipartimento di Elettronica, Informazione e Bioingegneria, Politecnico di Milano, Milano, Italy
                                                                   3
                                                                     School of Social Sciences, University of Manchester, Manchester, United Kingdom
                                                                                         4
                                                                                           Corridor Labs, London, United Kingdom
arXiv:2101.07694v2 [cs.SI] 22 Feb 2021

                                                                        Abstract                                 cines. Worse, resistance to the COVID-19 vaccines is cur-
                                                                                                                 rently much more prevalent than resistance to the MMR vac-
                                           With a large proportion of the population currently hesitant          cine. Since COVID-19 vaccine hesitancy and its drivers re-
                                           to take the COVID-19 vaccine, it is important that people
                                                                                                                 mains understudied, a goal of our project is to help address
                                           have access to accurate information. However, there is a large
                                           amount of low-credibility information about vaccines spread-          this gap.
                                           ing on social media. In this paper, we present a dataset of              There is a growing body of evidence linking social me-
                                           English-language Twitter posts about COVID-19 vaccines.               dia and the antivaccination movement to vaccine hesi-
                                           We show statistics for our dataset regarding the numbers of           tancy (Broniatowski et al. 2018; Burki 2019; Johnson et al.
                                           tweets over time, the hashtags used, and the websites shared.         2020). Studies show that vaccine hesitancy in one’s peer
                                           We also demonstrate how we are able to perform analysis of            group is associated with future vaccine refusal (Brunson
                                           the prevalence over time of high- and low-credibility sources,        2013), and that misinformation spread on social networks is
                                           topic groups of hashtags, and geographical distributions. We          linked to poor compliance with public health guidance about
                                           have developed a live dashboard to allow people to visualize          COVID-19 (Roozenbeek et al. 2020). Based on these find-
                                           the relationship between COVID-19 vaccine adoption and in-
                                           formation in our dataset. The dataset can be used in studies
                                                                                                                 ings, the core hypothesis behind this project is that the social
                                           about the impact of online information on COVID-19 vaccine            spread of vaccine misinformation and vaccine hesitancy will
                                           uptake and health outcomes.                                           impact public health outcomes such as vaccine uptake and
                                                                                                                 COVID mortality rates.
                                                                                                                    Here we present a collection of English posts related to
                                                                      Introduction                               the COVID-19 vaccines on Twitter. The collection is exempt
                                         The COVID-19 pandemic has killed two million people and                 from IRB review as it only includes tweet IDs of public mes-
                                         infected 93 million around the world as of mid-January,                 sages. This allows us to comply with the Twitter Terms of
                                         2021 (Dong, Du, and Gardner 2020).Vaccines will be crit-                Service while making the data available to both researchers
                                         ical in our fight to end the COVID-19 pandemic (Orenstein               and the general public. Although there has been previous
                                         and Ahmed 2017). It is estimated that around 60-70% of                  work presenting COVID-19 Twitter datasets (Chen, Lerman,
                                         the population will need to be vaccinated against COVID-                and Ferrara 2020; Huang et al. 2020; Lamsal 2020), our
                                         19 to achieve herd immunity so that virus spread can be ef-             work focuses specifically on discussion of COVID-19 vac-
                                         fectively suppressed (Aguas et al. 2020). However, recent               cines and related public health outcomes.
                                         surveys have found that only 40-60% of American adults                     The CoVaxxy dataset will enable researchers to study vac-
                                         reported that they would take a COVID-19 vaccine (Funk                  cine misinformation and hesitancy, and their relationship to
                                         and Tyson 2020; Hamel, Kirzinger, and Brodie 2020). With                public health outcomes. We will use established techniques
                                         these currently predicted levels of vaccine hesitancy, it is un-        to track vaccine misinformation within the data, along with
                                         likely we will reach herd immunity; COVID-19 will remain                misinformation superspreaders, coordinated campaigns, and
                                         endemic in our population.                                              automated accounts (Yang, Hui, and Menczer 2019; Yang
                                            A possible driver for vaccine hesitancy is the anti-                 et al. 2020; Pierri, Piccardi, and Ceri 2020a,b; Pacheco et al.
                                         vaccination movement. This movement has been on the rise                2020). We will also relate this social media data to geo-
                                         in the U.S. for two decades, beginning with unfounded fears             graphic public health data (such as COVID-19 mortality and
                                         over a Measles, Mumps and Rubella (MMR) vaccine (Hus-                   vaccine uptake rates) by using geolocation data within the
                                         sain et al. 2018). The vocal online presence of the anti-               dataset.
                                         vaccination movement has undermined confidence in vac-                     This paper describes relevant aspects of the CoVaxxy
                                                                                                                 dataset, which cover data collection, descriptive analyses of
                                            *
                                                These authors contributed equally to this work                   the data and its potential usage, and a live dashboard in-
                                            †
                                                These authors contributed equally to this work                   tended for the public to track key insights drawn from the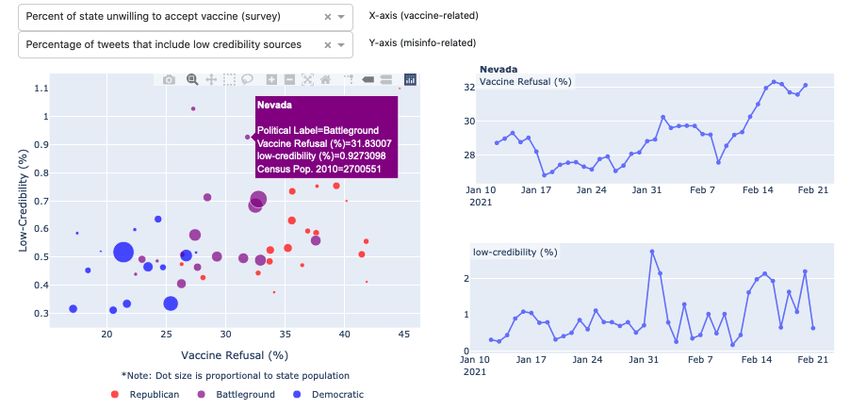
data. Opportunities and limitations of the dataset are dis-
cussed as we draw conclusions.                                                                                  Tweets      Users
                                                                                                              1.0 2.0 3.0   1.0   2.0
                      Dataset curation                                                   covid19vaccine
                                                                                           covid19 pfizer
                                                                                      covid19 moderna
Our key data collection goal is to download a complete a set                      covid19 astrazeneca
of Twitter posts related to COVID-19 vaccines. In this sec-                            covid19 biontech
                                                                                     pfizercovidvaccine
tion we describe our methodology for selecting appropriate                          covidvaccine pfizer
keywords to achieve such a coverage. We then describe our                       modernacovidvaccine
                                                                             astrazenecacovidvaccine
architecture with server redundancy to maintain an unbroken                      biontechcovidvaccine
stream of Twitter data containing these keywords.                                           covidvaccine
                                                                             notocoronavirusvaccines
                                                                                   coronavirusvaccine
Identifying COVID-19 vaccines content                                                     coronavaccine
                                                                                     vaccinessavelives
                                                                                            pfizervaccine
To create as complete a set of Twitter posts related to                                 modernavaccine
COVID-19 vaccines as possible, we carefully select a list of                               oxfordvaccine
                                                                                   astrazenecavaccine
keywords through a snowball sampling technique (Conover                                 biontechvaccine
et al. 2012; Yang, Hui, and Menczer 2019). We start with                                    vaccineworks
the two most relevant keywords, i.e., covid and vaccine,                                        azvaccine
                                                                                                   vaccine
as our initial seeds. Note that keywords also match hash-                                         covidiots
tags, URLs, and substrings. For example, covid matches                                   covid_19 pfizer
                                                                                     covid_19 moderna
“cnn.com/covid” and “#covid19.” Next, we gather tweets                      coronavirusupdates pfizer
utilizing the filtered stream endpoint of the Twitter API1 for                       coronavirus pfizer
                                                                         coronavirusupdates moderna
three hours. From these gathered tweets, we then identify                        covid_19 astrazeneca
potential keywords that frequently co-occur with the seeds,                          covid_19 biontech
                                                                                 coronavirus moderna
adding them to our seed list only after manually ensuring                                 covid-19 pfizer
they are closely related to our topic. This process was re-                                   covid pfizer
                                                                                     covid-19 moderna
peated six times between Dec. 15, 2020 and Jan. 2, 2021                                   covid moderna
with each iteration’s data collection taking place at different       coronavirusupdates astrazeneca
                                                                         coronavirusupdates biontech
times of the day to capture tweets from different geographic                  coronavirus astrazeneca
areas and demographics. The seed list serves as our initial                       coronavirus biontech
                                                                                 covid-19 astrazeneca
keyword list.                                                                        covid astrazeneca
   We further refine the keyword list by manually combin-                                 covid biontech
                                                                                      covid-19 biontech
ing certain keywords into composites, leveraging the query                                    vaccination
syntax of Twitter’s filtered stream API. For example, using                                 corona pfizer
                                                                                           pfizerbiontech
covid19 pfizer as a composite matching phrase will                                      corona moderna
capture tweets that contain both “covid19” and “pfizer.” On                             endthelockdown
                                                                                                greatreset
the other hand, including covid19 and pfizer as sepa-                              corona astrazeneca
rate keywords will capture tweets that contain “covid19” or                             corona biontech
                                                                                                plandemic
“pfizer.” Constructing various composites of relevant key-                           iwillgetvaccinated
words in this way ensures the dataset is broad enough to in-                               getvaccinated
                                                                                                      mrna
clude most relevant (English) conversations while excluding                                       eugenics
tweets that are not related to the vaccine discussion.                                       thisisourshot
                                                                                                 vaccinate
                                                                                                  sputnikv
Content coverage                                                                                     covax
                                                                                                   kungflu
                                                                                                        rna
To demonstrate the effectiveness of the snowball sampling                                              gavi
technique introduced above, we calculate the popularity of                                  depopulation
                                                                               peoplesbodyyourchoice
each (single or composite) keyword by the number of unique                                iwillnotcomply
tweets and unique users associated with it.                                           mybodymychoice
                                                                                            pharmagreed
   Figure 1 shows the effect of adding new keywords into the                                   glyphosate
list of streaming filters. The keywords are ranked by popu-                                          vaxxx
                                                                                                      vaxx
larity. The diminishing growth of popularity suggests that                                              vax
the inclusion of additional keywords is redundant for cov-                                             cepi
                                                                                                       nvic
erage of users and tweets. The diminishing returns are due
to the co-occurrence of multiple keywords and hashtags in             Figure 1: Cumulative popularity of keywords in terms of
a single tweet, especially for the most popular terms. Thus,          matched tweets (purple, left) and unique users who posted
     1
                                                                      those tweets (green, right), in millions.
       https://developer.twitter.com/en/docs/twitter-api/v1/tweets/
filter-realtime/overview
we believe that our set of keywords provides reasonable cov- Users Tweets Hashtags URLs
erage and is representative of tweets communicating about 1,847,067 4,768,204 39,857 983,158
COVID-19 vaccines.
As the collection of tweets is intended to persist over time, Table 1: Breakdown of the data collected between January
new keywords will emerge. To ensure that the keyword list 3rd and January 10th in terms of unique users, tweets, hash-
remains comprehensive throughout the data collection pe- tags and URLs.
riod, our team will continue to monitor the ongoing public
discussion related to COVID-19 vaccinations, should it be-
come necessary to update the list with important emerging
demic trends is missing. We have created a web-based visu-
keywords.
alization to fill this void. The CoVaxxy dashboard will track
and quantify credible information and misinformation nar-
CoVaxxy system ratives over time, as well as their sources and related popu-
System architecture lar keywords.7 The dashboard will focus on the U.S. at the
Our server architecture (Figure 2) is designed to collect and state-level. It will be updated daily. Figure 3 illustrates one
process large quantities of data. This infrastructure is hosted example of an interactive visualization that allows users to
by Extreme Science and Engineering Discovery Environ- visualize the relationship between various misinformation-
ment (XSEDE) Jetstream virtual machines (VMs) (Towns related and COVID-19 pandemic data. This data will be dis-
et al. 2014; Stewart et al. 2015). To maintain the integrity of played alongside COVID-19 pandemic and vaccine trends.
our tweet streaming pipeline, we have incorporated redun- By highlighting the connection between misinformation and
dancy. We maintain two streamer (stream collection) VMs public health actions and outcomes, we hope to encourage
in different U.S. states so that if one suffers a fault we can the public to be more vigilant about the information they
use data from the other. These servers connect to Twitter’s consume on their daily social media feeds in the fight against
filtered stream API to collect tweets that match any of the COVID-19.
keywords in real time. We use the language metadata to fil-
ter out non-English tweets. Data characterization
The data from the two streamers is collated on a general
purpose server VM where we run data analysis. The server Our system started to gather tweets on Jan. 4, 2021. Table
VM is also linked to Anonymous University’s high perfor- 1 provides a breakdown of the dataset (as of January 11)
mance computing infrastructure for running advanced anal- in terms of the number of unique users, number of tweets
yses. they shared, and numbers of unique hashtags and URLs con-
We upload new data files to a public data repository each tained in these tweets.
day (DeVerna et al. 2021). The repository also includes our
list of keywords. In compliance with Twitter’s Terms, we Volume
are only able to share tweet IDs with the public. One can
re-hydrate the dataset by querying the Twitter API or using We show in Figure 4 a time series for the number of tweets
tools like Hydrator2 or twarc3 . collected in our dataset, on an hourly basis. We can notice
Finally, a web server provides access to the data on the a decrease in the number of tweets after January 6, which
server VM through applications. An example is the interac- might be driven by the increased media attention surround-
tive dashboard, described next. ing the storming of the U.S. Capitol.8 In fact, the mean daily
number of tweets decreases from 900k tweets in the period
Dashboard of Jan 4–6 to 400k tweets in the period of Jan 7–11.
Existing COVID-19 visualization tools include those by In Figure 5 we show the distribution of the tweets geo-
Johns Hopkins University (Dong, Du, and Gardner 2020) located in the contiguous United States. We use a naive ap-
and The Atlantic.4 These trackers address hospitalization proach to match tweets to U.S. states: we first extract the
and mortality. Another dashboard from the Fondazione user location from the profile (if present) and then match it
Bruno Kessler covers the infodemic, reporting on the pro- against a dictionary of U.S. states. Finally, we compute the
portions of misinformation and epidemic-related stats (con- number of tweets for each state based on the activity of users
firmed and death cases) per country.5 Finally, the Our World geo-located in that state. Over 1M users in our dataset have
in Data COVID-19 vaccination dataset publishes vaccine location metadata in their profile; we were able to match ap-
uptake information by country. 6 proximately 40k users resulting in 600k geo-located tweets.
A tool to concurrently explore the relationships between Providing an accurate methodology to geo-locate users is
COVID-19 vaccine conversations, vaccine uptake, and epi- outside the scope of this paper; the reader should consider
these results only as an illustration of the insights that can
2
https://github.com/DocNow/hydrator be gained from the CoVaxxy data.
3
https://github.com/DocNow/twarc
4 7
https://covidtracking.com/ https://osome.iu.edu/tools/covaxxy
5 8
https://covid19obs.fbk.eu https://www.nytimes.com/2021/01/06/us/politics/protesters-
6
https://ourworldindata.org/covid-vaccinations storm-capitol-hill-building.htmlHPC cluster
Streamer 1
Streamer 2
Server
Public data store
Indiana Web server
University Public user
Figure 2: The VM server architecture for the CoVaxxy project. Data flows in the direction of the arrows.
Figure 3: Example of one visualization from the CoVaxxy web dashboard. This visualization allow users to graph relation-
ships (at the state-level) between vaccine-related and misinformation-related data. The left figure’s axes are selected with the
dropdowns, displaying the aggregate relationship. The two figures on the right illustrate the same relationship from a temporal
perspective for an individual state. The user chooses what state to visualize in the figures on the right by hovering over a dot in
the left figure.covid19
60000 vaccine
covidvaccine
50000 covid
coronavirus
No. tweets
40000
covidiots
30000 covaxin
vaccination
20000 covid19vaccine
india
10000 0 20000 40000 60000 80000 100000120000140000
No. tweets
04 05 06 07 08 09 10 11
Jan
2021 Figure 6: Top-10 shared hashtags.
Figure 4: Number of collected tweets on an hourly basis
since the beginning of the collection. Groups with hashtags that are used the most are plotted in
Figure 7. We observe groups of hashtags associated with
vaccine conspiracy theories (“#greatreset,” “#billgates”) as
well as positive messages (“#stayhome”).
Sources
In Figure 8 we show the top-10 most shared websites. We
exclude “twitter.com,” which accounts for over 3M tweets.
These sites are comprised mostly of high-credibility infor-
mation sources. However, one low-credibility source — “ze-
rohedge.com” — also makes this list (see below for details
on the classification). We also observe a large number of
links to YouTube, which suggests further investigation will
be needed to assess the nature of this shared content.
Figure 9 provides a time series for the prevalence of low-
and high-credibility information. We follow an approach
widely adopted in the literature (Lazer et al. 2018; Shao
et al. 2018; Bovet and Makse 2019; Grinberg et al. 2019;
Yang et al. 2020) to label links to news articles based on
source reliability. In particular, we use a third-party list of
675 low-credibility sources9 and 26 hand-selected main-
stream sources. Overall, links to low-credibility sources ac-
counts for 24,841 tweets compared to 72,680 tweets linking
to our sample of mainstream sources. Readers should note
Figure 5: Distribution of the number of inferred geo-located
that these numbers do not fully capture the news circulating
tweets per U.S. state in absolute number (top) and normal-
on Twitter, as the lists we employ cannot be exhaustive.
ized by 2010 state population (bottom). We exclude Alaska
We further list in Figure 10 the 20 most shared news web-
and Hawaii for space reasons.
sites, including both source classes. We notice several un-
reliable sources (cf. “zerohedge.com” and “bitchute.com”)
that exhibit prevalence comparable to more reliable web-
Hashtags sites.
Figure 6 lists the most tweeted hashtags in our dataset. We
can see that they are largely related to the SARS-CoV-2
vaccine, with one (“#covidiots”) referring to COVID-19 de-
Discussion
niers. In this paper we present a new public dataset tracking dis-
Many different conversations can occur concurrently on course about COVID-19 vaccines on Twitter. We charac-
Twitter, using different hashtags for different topics. To clus- terize the data in several ways, including prominent key-
ter related hashtags, we have grouped them together using a words, geographic distribution of tweets, and clusters of re-
network algorithm. We form a co-occurrence network with lated hashtags. We also present a prototype data dashboard
hashtags as nodes and edges weighted according to how of- that will visualize statistics and insights from this data.
ten the linked hashtags co-occur within tweets. Nodes are
9
clustered using the Louvain method (Blondel et al. 2008). https://iffy.news/iffy-plus/Figure 7: An overview of the prominent hashtags in the data, clustered into topic groups. A few hashtags characterizing each
cluster are shown.
theguardian.com
Low-credibility
dailymail.co.uk 1200 High-credibility
reuters.com
youtube.com 1000
nytimes.com
No. tweets
800
washingtonpost.com
nypost.com 600
bylinetimes.com
independent.co.uk 400
zerohedge.com 200
0 2000 4000 6000 8000 10000 12000
No. tweets 0
04 05 06 07 08 09 10 11
Jan
Figure 8: Top-10 sources shared in vaccine-related tweets. 2021
Figure 9: Number of hourly tweets containing link to low-
In future work, we intend to explore the relationship be- (blue) and high-credibility (orange) sources.
tween online discussion of COVID-19 vaccines and public
health outcomes, like COVID-19 mortality and vaccine up-
take. We will also leverage existing social media analysis
tools to track emerging narratives and suspicious accounts, and Ceri 2020a,b; Pacheco et al. 2020). Finally, we plan to
such as bots, coordinated campaigns, and troll farms (Yang, explore models to better understand how vaccine misinfor-
Hui, and Menczer 2019; Yang et al. 2020; Pierri, Piccardi, mation and anti-vaccine sentiment spreads on social media.iment 2008(10): P10008. doi:10.1088/1742-5468/2008/10/
theguardian.com P10008.
dailymail.co.uk
reuters.com Bovet, A.; and Makse, H. A. 2019. Influence of fake news
nytimes.com in Twitter during the 2016 US presidential election. Nature
washingtonpost.com Communications 10(1): 7. ISSN 2041-1723. URL https:
nypost.com //doi.org/10.1038/s41467-018-07761-2.
independent.co.uk
zerohedge.com Broniatowski, D. A.; Jamison, A. M.; Qi, S.; AlKulaib, L.;
bitchute.com Chen, T.; Benton, A.; Quinn, S. C.; and Dredze, M. 2018.
apnews.com Weaponized health communication: Twitter bots and Rus-
cnn.com sian trolls amplify the vaccine debate. American journal of
breaking911.com public health 108(10): 1378–1384.
rt.com
wsj.com Brunson, E. K. 2013. The Impact of Social Networks on
npr.org Parents’ Vaccination Decisions. Pediatrics 131(5): e1397–
usatoday.com e1404. ISSN 0031-4005, 1098-4275. doi:10.1542/peds.
foxnews.com 2012-2452.
childrenshealthdefense.org Burki, T. 2019. Vaccine Misinformation and Social
theblaze.com
truepundit.com Media. The Lancet Digital Health 1(6): e258–e259.
0 2500 5000 7500 10000 ISSN 2589-7500. doi:10.1016/S2589-7500(19)30136-
No. tweets 0. URL https://www.thelancet.com/journals/landig/article/
PIIS2589-7500(19)30136-0/abstract.
Figure 10: Top-20 shared low- (blue) and high-credibility Chen, E.; Lerman, K.; and Ferrara, E. 2020. Tracking Social
(orange) sources. Media Discourse About the COVID-19 Pandemic: Develop-
ment of a Public Coronavirus Twitter Data Set. JMIR Public
Health and Surveillance 6(2): e19273.
This dataset has a few key limitations. First and critically, Conover, M. D.; Gonçalves, B.; Flammini, A.; and Menczer,
Twitter users are not a representative sample of the popu- F. 2012. Partisan asymmetries in online political activity.
lation, nor are their posts a representative sample of pub- EPJ Data Science 1(6). doi:https://doi.org/10.1140/epjds6.
lic opinions (Wojick and Hughes 2020). The Twitter filtered DeVerna, M.; Pierri, F.; Truong, B.; Bollenbacher, J.; Axel-
stream API also imposes a rate limitation of 1% of all pub- rod, D.; Loynes, N.; Torres-Lugo, C.; Yang, K.-C.; Menczer,
lic tweets, which could in future limit our ability to capture F.; and Bryden, J. 2021. CoVaxxy Tweet IDs data set. URL
all the relevant content. Another potential source of bias is doi.org/10.5281/zenodo.4554496.
the keyword sampling procedure used to identify and collect
COVID-19 vaccine related content, which involved evalua- Dong, E.; Du, H.; and Gardner, L. 2020. An interactive web-
tion of keywords to determine what was relevant. Addition- based dashboard to track COVID-19 in real time. The Lancet
ally we are unable to fully exclude irrelevant material using Infectious Diseases 20(5): 533–534. doi:10.1016/s1473-
only keyword-based content filtering. 3099(20)30120-1. URL http://dx.doi.org/10.1016/S1473-
The long-term aim of this project is to tackle the ambi- 3099(20)30120-1.
tious challenge of linking social media observations directly Funk, C.; and Tyson, A. 2020. Intent to get a COVID-19
to public health. We hope that researchers will be able to vaccine rises to 60% as confidence in research and devel-
leverage the CoVaxxy dataset to obtain a clearer picture of opment process increases. Pew Research Center. URL
how vaccine hesitancy and misinformation affect health out- https://www.pewresearch.org/science/2020/12/03/intent-
comes. In turn, such insight might enable public health offi- to-get-a-covid-19-vaccine-rises-to-60-as-confidence-in-
cials to design better strategies for confronting vaccine hes- research-and-development-process-increases/.
itancy and refusal.
Grinberg, N.; Joseph, K.; Friedland, L.; Swire-Thompson,
B.; and Lazer, D. 2019. Fake news on Twitter during the
References 2016 U.S. presidential election. Science 363(6425): 374–
Aguas, R.; Corder, R. M.; King, J. G.; Gonçalves, G.; 378. ISSN 0036-8075. URL http://science.sciencemag.org/
Ferreira, M. U.; and Gomes, M. G. M. 2020. Herd content/363/6425/374.
immunity thresholds for SARS-CoV-2 estimated from Hamel, L.; Kirzinger, A.; and Brodie, M. 2020. KFF
unfolding epidemics. medRxiv doi:10.1101/2020.07.23. COVID-19 Vaccine Monitor: December 2020. URL
20160762. URL https://www.medrxiv.org/content/early/ https://www.kff.org/coronavirus-covid-19/report/kff-covid-
2020/11/16/2020.07.23.20160762. 19-vaccine-monitor-december-2020.
Blondel, V. D.; Guillaume, J.-L.; Lambiotte, R.; and Lefeb- Huang, X.; Jamison, A.; Broniatowski, D.; Quinn, S.; and
vre, E. 2008. Fast Unfolding of Communities in Large Net- Dredze, M. 2020. Coronavirus Twitter Data: A collection
works. Journal of Statistical Mechanics: Theory and Exper- of COVID-19 tweets with automated annotations. Zenodo.doi:10.5281/ZENODO.4393598. URL https://zenodo.org/ Peterson, G. D.; Roskies, R.; Scott, J. R.; and Wilkins- record/4393598. Diehr, N. 2014. XSEDE: Accelerating Scientific Discov- Hussain, A.; Ali, S.; Ahmed, M.; and Hussain, S. 2018. ery. Computing in Science & Engineering 16(5): 62–74. The Anti-Vaccination Movement: A Regression in Mod- ISSN 1521-9615. doi:10.1109/MCSE.2014.80. URL doi. ern Medicine. Cureus 10(7). ISSN 2168-8184. doi: ieeecomputersociety.org/10.1109/MCSE.2014.80. 10.7759/cureus.2919. URL https://www.ncbi.nlm.nih.gov/ Wojick, S.; and Hughes, A. 2020. Sizing Up Twitter Users. pmc/articles/PMC6122668/. Pew Research Center. URL https://www.pewresearch.org/ Johnson, N. F.; Velásquez, N.; Restrepo, N. J.; Leahy, R.; internet/2019/04/24/sizing-up-twitter-users/. Gabriel, N.; El Oud, S.; Zheng, M.; Manrique, P.; Wuchty, Yang, K.-C.; Hui, P.-M.; and Menczer, F. 2019. Bot election- S.; and Lupu, Y. 2020. The Online Competition between eering volume: Visualizing social bot activity during elec- Pro- and Anti-Vaccination Views. Nature 582(7811): 230– tions. In Companion Proceedings of The 2019 World Wide 233. doi:10.1038/s41586-020-2281-1. Web Conference, 214–217. Lamsal, R. 2020. Coronavirus (COVID-19) Tweets Dataset. Yang, K.-C.; Pierri, F.; Hui, P.-M.; Axelrod, D.; Torres- IEEE Dataport. doi:10.21227/781w-ef42. URL https://dx. Lugo, C.; Bryden, J.; and Menczer, F. 2020. The COVID- doi.org/10.21227/781w-ef42. 19 Infodemic: Twitter versus Facebook. arXiv preprint Lazer, D.; Baum, M.; Benkler, Y.; Berinsky, A.; Green- arXiv:2012.09353 . hill, K.; et al. 2018. The science of fake news. Science 359(6380): 1094–1096. doi:10.1126/science.aao2998. Orenstein, W. A.; and Ahmed, R. 2017. Simply put: Vaccination saves lives. Proceedings of the National Academy of Sciences 114(16): 4031–4033. ISSN 0027- 8424. doi:10.1073/pnas.1704507114. URL https://www. pnas.org/content/114/16/4031. Pacheco, D.; Hui, P.-M.; Torres-Lugo, C.; Truong, B. T.; Flammini, A.; and Menczer, F. 2020. Uncovering Co- ordinated Networks on Social Media. arXiv preprint arXiv:2001.05658 . Pierri, F.; Piccardi, C.; and Ceri, S. 2020a. A multi-layer approach to disinformation detection in US and Italian news spreading on Twitter. EPJ Data Science 9(35). Pierri, F.; Piccardi, C.; and Ceri, S. 2020b. Topology com- parison of Twitter diffusion networks effectively reveals misleading news. Scientific Reports 10: 1372. Roozenbeek, J.; Schneider, C. R.; Dryhurst, S.; Kerr, J.; Freeman, A. L. J.; Recchia, G.; van der Bles, A. M.; and van der Linden, S. 2020. Susceptibility to misinformation about COVID-19 around the world. Royal Society Open Science 7(10): 201199. doi:10.1098/rsos.201199. URL https://doi.org/10.1098/rsos.201199. Shao, C.; Ciampaglia, G. L.; Varol, O.; Yang, K.-C.; Flam- mini, A.; and Menczer, F. 2018. The spread of low- credibility content by social bots. Nature Communications 9: 4787. doi:10.1038/s41467-018-06930-7. Stewart, C. A.; Cockerill, T. M.; Foster, I.; Hancock, D.; Merchant, N.; Skidmore, E.; Stanzione, D.; Taylor, J.; Tuecke, S.; Turner, G.; Vaughn, M.; and Gaffney, N. I. 2015. Jetstream: A Self-Provisioned, Scalable Science and Engi- neering Cloud Environment. In Proceedings of the 2015 XSEDE Conference: Scientific Advancements Enabled by Enhanced Cyberinfrastructure, XSEDE ’15, 1–8. Associ- ation for Computing Machinery. ISBN 978-1-4503-3720- 5. doi:10.1145/2792745.2792774. URL https://doi.org/10. 1145/2792745.2792774. Towns, J.; Cockerill, T.; Dahan, M.; Foster, I.; Gaither, K.; Grimshaw, A.; Hazlewood, V.; Lathrop, S.; Lifka, D.;
You can also read