COVID -19 - A Study & Projections for India - IAI PANDEMIC RESEARCH GROUP INSTITUTE OF ACTUARIES OF INDIA - the Institute of ...
←
→
Page content transcription
If your browser does not render page correctly, please read the page content below
COVID -19 – A Study &
Projections for India

IAI PANDEMIC RESEARCH GROUP
 INSTITUTE OF ACTUARIES OF INDIA
 MAY 12, 2020

 IAIPandemicresearchgrp@actuariesindia.org
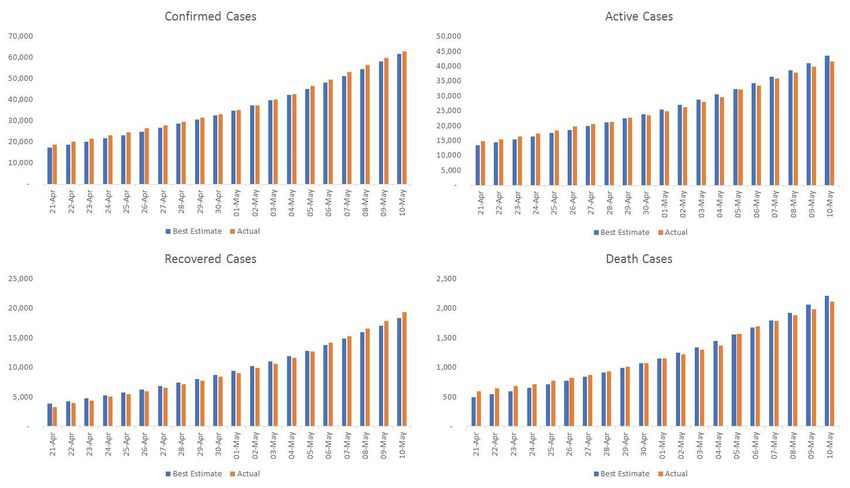
Table of Contents

1. Executive Summary.............................................................................................................. 2
2. Introduction ............................................................................................................................ 5
3. Learnings from overseas .................................................................................................... 6
 3.1. South Korea’s COVID-19 Experience ........................................................................ 6
 3.2. Singapore’s COVID-19 Experience ............................................................................ 9
 3.3. Italy’s COVID-19 Experience ..................................................................................... 11
 3.4. Germany’s COVID-19 Experience ............................................................................ 13
 3.5. USA’s COVID-19 Experience ..................................................................................... 15
4. Projection Models ............................................................................................................... 17
 4.1. Data ................................................................................................................................ 17
5. Model 1: HIRD (Healthy, Infected, Recovered & Dead) model .................................... 18
 5.1. Approach and Assumptions ..................................................................................... 18
 5.2. Calibration methodology ........................................................................................... 18
 5.3. Parameters estimated ................................................................................................. 20
 5.4. Modelled vs Actual ...................................................................................................... 21
6. Model 2: SEIR (Susceptible Exposed Infected & Removed) model .......................... 22
 6.1. Approach and Assumptions ..................................................................................... 22
 6.2. Calibration methodology ........................................................................................... 23
 6.3. Parameters Estimated ................................................................................................ 25
 6.4. Modelled vs Actual ...................................................................................................... 26
7. Projections ........................................................................................................................... 27
 7.1. Daily projections (cumulative figures) .................................................................... 27
 7.2. Limitations of Projections: ........................................................................................ 32
8. Products: Global trends and coverage ........................................................................... 34
 8.1. Life products ................................................................................................................ 35
 8.2. General & Health.......................................................................................................... 35
 8.3. Other Segments ........................................................................................................... 35
9. Next Steps ............................................................................................................................ 36
Appendix A: IAI Office order .................................................................................................... 37
Appendix B: Back testing outputs .......................................................................................... 38
Appendix C: Disclaimer ............................................................................................................. 39

IAI Pandemic Research Group Page 1 of 39
1. Executive Summary

The Institute of Actuaries of India (IAI) has constituted a Research Group (Group) to conduct
research based on the COVID19 related data available in India and globally. The Research
will be useful for various stakeholders for developing solutions for serving the public cause.
The Group studied the experience and projections available for South Korea, Singapore, Italy,
Germany and USA. Key learnings and takeaways from the Group’s analysis and study on
development of COVID19 in these countries are:
 1. Countries that have been successful in containing the virus have done so with
 aggressive fast track testing, extensive contract tracing and active quarantining.
 2. The governments were supported by the respective citizens who in turn followed social
 distancing norms and personal hygiene, even without a formal lockdown being
 imposed on them.
 3. Super-spreaders (e.g. Patient 31 in Korea), large events (like soccer matches in Italy)
 and cluster-infections (e.g. the migrant workers’ dormitories in Singapore); can easily
 derail the best measures followed and unsettle the hard work of governments, medical
 staff in a matter of days.
 4. If the spread of infection is not slowed down, it can cripple even the best-in-class
 medical facilities, e.g. Italy.
 5. Protection of the particularly vulnerable sections of the society can help contain the
 Case Fatality Rate (CFR), e.g. Germany has been successfully able to contain the
 number of deaths
Section 3 details the learnings for each of the geographies researched by the Group.
While each country is handling this outbreak in their own way, India has been appreciated for
its proactive response. The scale at which it had to act and the urgency and agility at which it
put those actions to work is unparalleled. Some of the early measures that we took in January
2020, e.g. screening international passengers even when no single positive case was
identified, the criticised decision (that later was accepted as being vital) to suspend visas,
tracing those with travel history from China and vigilance of their home quarantine and travel
restrictions, etc.
The Central Government activated its crisis management team and intensive surveillance
systems to pre-empt widespread transmission, working closely with their counterparts in
various states. The decisive Indian measure to “lockdown” was placed on March 25, 2020
which, although continuing to be a challenge to enforce in densely populated localities,
received unanimous nationwide compliance thus affirming the “power of the collective”. With
the nation in complete lockdown, India used this opportunity to enhance medical readiness by
increasing isolation beds, ventilators, drugs and test kits. Public health awareness drive and
advertising campaigns have been pushed on social media, TV, SMS and radio. What
continues to be a challenge is to get the curve to plateau and then start to trend downwards,
while we figure out how to tilt the axis from life to livelihood, catalyse the economy, solve the
domestic migrants’ crisis and mitigate the risk of social unrest.
While some of detailed historical data may not be available to calibrate the models along all
these parameters, the Group has considered these multitude of diverse aspects as much as
possible while building the models.

IAI Pandemic Research Group Page 2 of 39
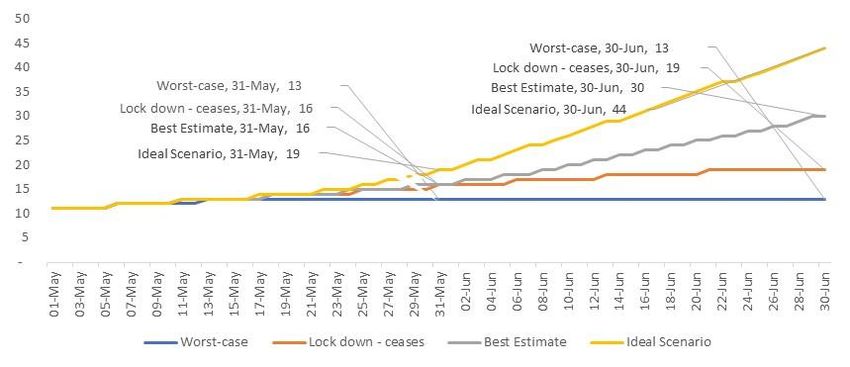
Using the knowledge gained and observing the daily reporting of cases, the Group attempted
to fit the emerging patterns and project cases, recoveries and deaths using two multi-state
models:
 1) HIRD (Healthy, Infected, Recovered Dead) model, detailed in Section 5
 2) SEIR (Susceptible Exposed Infected Removed) model, detailed in Section 6
While SEIR is a known model and has been used by other practitioners, HIRD is something
that the Group has built from scratch and tried to calibrate.
Data for the models was collected and cross verified against multiple sources before being
used. Individual data was sparse, and cumulative data was found to be more reliable and used
to calibrate the models. Further details about the work done on the data can be seen in Section
4. Both the models have been successfully calibrated to within 97%+ accuracy levels, when
looking at projection cases. Statistically credible historical data is available for more than two
months, since start of March 2020. In order to test the efficacy of the models, the models were
calibrated using first 45 days of data and then subsequently projected for the next 20 days. To
put things in perspective, data available till April 15, 2020 was used to calibrate the models
and then projected the number of cases till June 30, 2020. The Group has tested the actual
and expected experience, the projected numbers are within 5% of actuals till May 10, 2020.
The results are captured in Appendix B.
While the model may be capable of projecting numbers even beyond Jun’20, there are too
many parameters at play, e.g. government actions, policies, individual behaviour, fear
psychosis, etc. which are evolving too rapidly and could significantly impact the incidence
rates / transmission rates. Further, there is limited, and not very credible information, available
in the public domain in order to calibrate models and make stable long-term projections
specially regarding mortality and recovery and hence projections are provided till June 30,
2020.
The Group has considered four different scenarios to project the future possibilities as
summarised below, details are captured in Section 7.
 Phase May 4 to May 17 May18 to end-May June 2020
 Lockdown - with
 Worst-case

 Lockdown status No lockdown
 relaxation
 Social distancing norms Not followed uniformly Not followed

 Transmission Rate for Jun’20 1.143 (7:1)

 Lockdown - with
 Lockdown-

 Lockdown status No lockdown No lockdown
 ceases

 relaxation
 Social distancing norms Followed Followed partly
 Transmission Rate for Jun’20 1.125 (8:1)

 Lockdown – with relaxation
 estimate

 Lockdown status
 Best-

 Social distancing norms Followed
 Transmission Rate for Jun’20 1.100 (10:1)
 Lockdown – with
 Lockdown – limited relaxation
 Scenario

 Lockdown status
 relaxation
 Ideal

 Social distancing norms Strictly followed
 Transmission Rate for Jun’20 1.067 (15:1)

IAI Pandemic Research Group Page 3 of 39
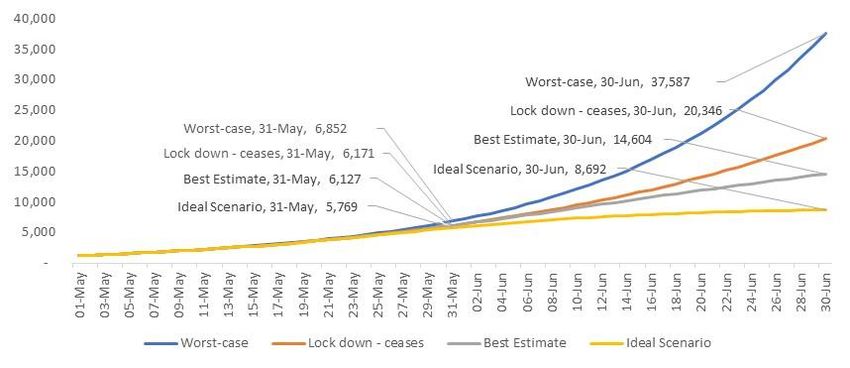
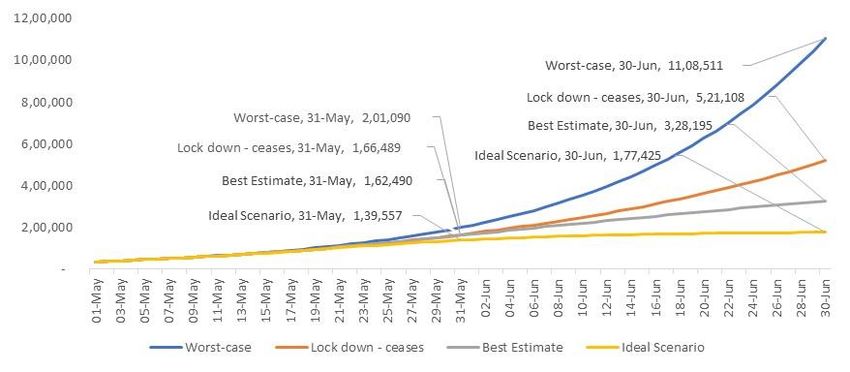
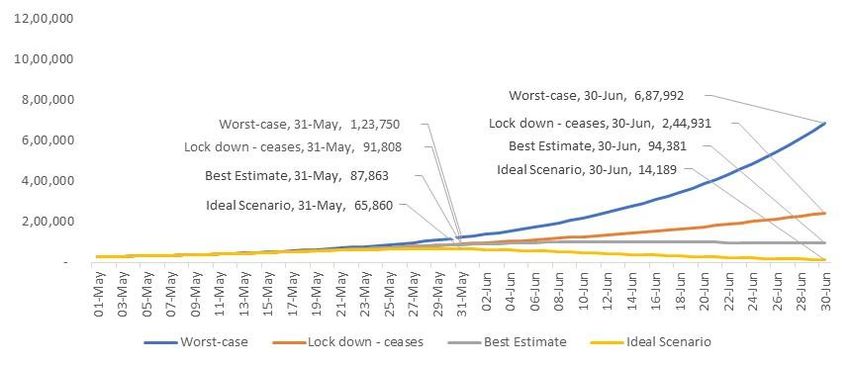
Transmission rate is used to estimate the cumulative number of infected people on the
following day.
For example, a transmission rate of 1.125 per day would mean for every 1,000 infected people
on a given day, there would be 1,125 infected people the next day. It may also be interpreted
as that for every 8 infected individuals on a given day, there would be 1 additional infected
individual on the next day, taking the tally to 9.
Similarly, a transmission rate of 1.067 per day would mean for every 1,000 infected people on
a day, there would be 1,067 infected people the next day. Hence, for every 15 infected
individuals on a given day, there would be 1 additional infected individual on the next day,
taking the tally to 16.
The transmission rates during the earlier periods are calibrated using the available data for
Mar’20 and Apr’20.
The number of cases in Confirmed and Active states projected for May 31, 2020 and June 30,
2020 are depicted below:
 Confirmed Cases Active Cases
 31-May-20 30-Jun-20 31-May-20 30-Jun-20
 Worst-case 2,01,090 11,08,511 1,23,750 6,87,992
 Lock down - ceases 1,66,489 5,21,108 91,808 2,44,931
 Best Estimate 1,62,490 3,28,195 87,863 94,381
 Ideal Scenario 1,39,557 1,77,425 65,860 14,189

The above models and its results are limited by the information available and model construct.
Details of the limitations of these results is given in Section 7.2.
Further, the Group also deliberated on various product ideas and constructs that can be
offered under the current scenario to address the emerging gap in insurance needs of the
consumers. These suggestions are detailed in Section 8.
This Group aims to periodically review and recalibrate the projections as greater experience
emerges in future and continue to develop an understanding of medium to long term impacts
of COVID-19 crisis on some of the key risks faced by the insurers.
Any information or question with regards to the analysis and report may be sent to IAI
Pandemic Research group at IAIPandemicresearchgrp@actuariesindia.org.

IAI Pandemic Research Group Page 4 of 39
2. Introduction Corona Virus Disease of 2019 or COVID-19 is a global pandemic that has since the start of 2020 spread across the world. The virus causing COVID-19 is Severe Acute Respiratory Syndrome Corona Virus 2 or SARS-CoV-2. This virus is third zoonotic coronavirus, after SARS-CoV and MERS-CoV, but appears to be the only one with pandemic potential. The disease till date has infected more than ~41.9 Lakh (4 million) people and has caused around ~2.8 Lakh (~284,000) deaths with still ~ 24.1 Lakh (~2.4 million) active cases of which ~ 2% are in serious or critical condition1. Given the current global COVID-19 epidemic, IAI has constituted a Research Group (Group) with the following objectives: Analysing the experience emerging from COVID-19 in India and relevant overseas markets. Drawing inferences from the analysis of incidence and mortality rates Suggestions as to the life/health products that can be offered to cover COVID-19. The Office Order is attached as Appendix A to this report. As we are yet to reach a steady state of this pandemic, it will be premature to draw a conclusion regarding the mortality and / or incidence rates due to COVID-19. There are so many factors affecting the mortality that are yet to be fully understood. Hence, the Group decided to focus on analysing the emerging situation in India and compare and leverage on insights and learnings from countries that are in various phases of this pandemic, for details please refer Section 3. Using the knowledge gained and observing the daily reporting of cases, the Group attempted to fit the emerging patterns and project cases using two multi-state models. The approach and outcomes are detailed in subsequent sections. The objective is to project the number of cases that are likely to occur under various lockdown and containment scenarios. The cases have been projected till end of June 2020. While the model maybe be capable of projecting numbers even beyond Jun’20, there are too many parameters at play, e.g. government actions, policies, individual behaviour, fear psychosis, etc. which are evolving too rapidly and could significantly impact the incidence rates / transmission rates. Further, there is very limited and credible information available in the public domain in order to calibrate models and make stable long-term projections specially regarding mortality and recovery. The Group also deliberated on various product ideas and constructs that can be offered under the current scenario. These suggestions are detailed in Section 8. 1 https://www.worldometers.info/coronavirus/ updated as at May 10, 2020 IAI Pandemic Research Group Page 5 of 39
3. Learnings from overseas To understand COVID-19 spread, the Group studied a few important and relevant countries. The study and analysis included understanding key variables, e.g. age, gender, testing, daily increase in cases, etc. and government’s response and the subsequent impact of that response. The following overseas markets were surveyed: South Korea Singapore Italy Germany USA Key observations that, we believe, are of relevance to the Indian context are summarized below. 3.1. South Korea’s COVID-19 Experience The first case of COVID-19 was confirmed on January 20, 2020, the same day that the USA had confirmed its first case. However, both the countries have had a very different experience of this pandemic, as illustrated here and in Section 3.5. By February 15, 2020, the country had reported 28 cases. The number of confirmed cases in South Korea is illustrated below2, with the total number of infections of 10,9093 cases as at May 10, 2020. 2 Source: https://www.worldometers.info/coronavirus/country/south-korea/ 3 Source: http://ncov.mohw.go.kr/en IAI Pandemic Research Group Page 6 of 39
The number of new cases reported on a daily basis4 are illustrated below.

Many experts have stated that South Korea is one of the few countries that has managed to
flatten the curve. It is even more of a special case within those few countries that has achieved
this feat, as it did not enforce a formal lockdown.

There are many lessons that can be learnt ranging from extensive and fast track testing to
using smart technology for tracing and quarantining. As a first step, they acted promptly by
declaring it an emergency early on and used the window of opportunity to clamp down on the
virus by following aggressive measures.

4
 Source: https://www.worldometers.info/coronavirus/country/south-korea/

IAI Pandemic Research Group Page 7 of 39
Important and unique observations
The number of new infections in South Korea rose rapidly in February when one of the infected
citizens attended a large church gathering and went to other public places and eventually
ended up infecting many people. This person, known as Patient 31 was a “super spreader”
and infected about 50% of the individuals who tested positive for COVID-19 in South Korea.
Since then, the country has seen the number of new infections fall due to several timely and
decisive actions that are outlined below.
For those that were exhibiting any symptoms, testing was made free of charge. For those that
were asymptomatic, while the test was chargeable, they were still tested. People behaved with
maturity and disciplined themselves by staying indoors voluntarily even without a formal
lockdown.
Another important aspect that helped was that the Government was very transparent in
sharing information with the general population and gave them regular updates on progress
and the steps being taken.
Learnings
South Korea’s experience with the virus has not been as bad as many other countries. The
learnings from South Korea are:
Accessibility of Testing: It pioneered different ways of testing like developing drive-through
testing facilities that enabled diagnosis of many people. Within a very short time period, their
testing capacity reached up to 20,000 per day. Their intensive testing has been vital in
identifying many silent carriers.
Testing statistics5 as at April 30, 2020.
 Tests Concluded
 Confirmed Cases In
 Released Negative Total
 Subtotal Progress
 Quarantined from Deceased Subtotal Results
 Quarantine
 1,459 9,059 247 10,765 600,482 611,247 8,634 619,881

Aggressive Back-tracing contacts: They sent automatic messages with list of infected
places and the time that infected people had been to those places and advised people who
were at those places around that time to get themselves tested.
Disciplined quarantine: People in self quarantine and those released from hospitals were
required to report their movement and symptoms everyday through an app managed by the
Government. People who breached quarantine had a strict fine imposed.

5 Source: http://ncov.mohw.go.kr/en/bdBoardList.do?brdId=16&brdGubun=161&dataGubun=&ncvContSeq=&contSeq=&board_id=&gubun=

IAI Pandemic Research Group Page 8 of 39
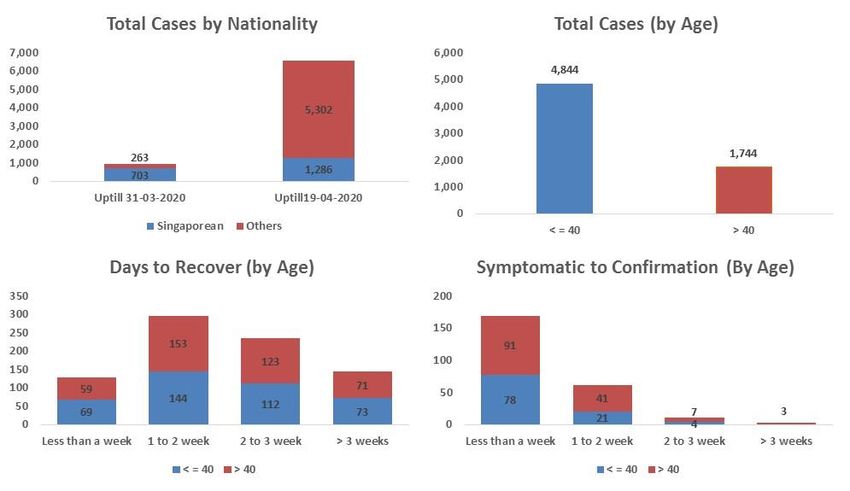
3.2. Singapore’s COVID-19 Experience

Singapore is one of the most developed countries in South East Asia. The prosperous city-
state with a population of ~ 58 Lakh (5.8 million) won praise as a model of how to control the
spread of the virus without lockdowns. Since the infection first broke on January 23, 2020, the
country responded with mass testing, quick hospitalization of those infected, aggressive
tracing and quarantining of those in contact with infected people that helped in keeping
numbers low.
In mid-March, number of new infections started increasing. The city-state responded by
tightening entry restrictions and imposed a partial lockdown and strict edicts on social
distancing. All the initiatives helped and by end of March 2020, the total confirmed cases in
Singapore were only 966.
Since the end of March 2020, the number of cases spiralled and as on May 10, 2020, the total
confirmed cases were 23,882 with 20 deaths and 2,721 recovered cases. This has been driven
by infection spreading into densely populated dormitories that house migrant workers,
highlighted in the graph on cases by nationalities. This cluster impact is one of the main
reasons why the age bracket of infected lives is different to what has been witnessed across
the world, with younger lives being more affected as shown below.
Analysis based on 6,500 patient level data6 are shown below:

6
 Source: https://co.vid19.sg

IAI Pandemic Research Group Page 9 of 39
Extensive tracking, hospitalization and robust health care system also ensured that the
mortality rate is significantly low specially given ~ 64% of total population is above the age of
40. Total deaths as at April 29, 2020 were only 14 (0.1% of total cumulative cases).
The case fatality rates are likely to increase since most of the new cases have come in past 3
weeks and there may be some fatalities. Even though they show mild infection and average
recovery time is approx. 2 weeks, the total mortality rate is expected to be much lower than
the world average.
Important and unique observations
Cluster Impact – Since the start of April, the cases increased significantly. Significant majority
of these infections are linked to migrant workers (~ 200,000) living in 43 mega-dormitories
across the country. These dormitories house mainly migrants from countries like India,
Bangladesh and Indonesia and are mostly left out of the country’s social safety net. This
resulted in local officials underestimating the vulnerability of this cohort, who live in cramped
dormitories with up to 20 people in a room, resulting in a surge in cases.
To quell the second wave of infection, government has responded with tough new measures
involving closure of schools, mandatory face masks, lockdown extension and other policies.
These efforts seem to be bearing results, as though the number of infected migrant workers
has surged, community-transmitted cases among Singaporeans has been steadily declining.
Learnings
Cluster impact is a significant worry for India that has one of the highest population densities
globally, especially in migrant population clusters in metro cities. With close to no or very
limited social distancing norms being followed and lack of basic hygiene etiquettes,
transmission rates could increase significantly.
A single dormitory, S11 Dormitory in Punggol has 2,302 confirmed cases, ~ 12% of total cases,
highlights this danger. Indian government’s actions for this section of the society would have
a strong bearing on the impact and spread of infection.

IAI Pandemic Research Group Page 10 of 39
3.3. Italy’s COVID-19 Experience

As at May 10, 2020, Italy was Europe’s centre of active cases with 83,324 active cases. The
total of confirmed cases was 219,070 with 30,560 deaths, and 105,186 recoveries or
dismissals. The case fatality rate at 13.6%, is almost double of world’s average of 7.1%.

The above chart7 shows the progression in Italy. It was one of the first EU nations to ban flights
(January 31, 2020) to and from China and also had introduced thermal scanning in airports,
yet it is one of the worst affected EU countries. Though officially the spread of COVID-19
began in Feb’20 with its first confirmed cases, some reports claim that the infection in Italy
was spreading well before the Government brought in various measures.
It is suspected that as many people got infected with COVID-19 virus during the peak of
influenza they were treated for influenza symptoms rather than for COVID 19. This may have
resulted in Health facilities treating these patients becoming sites for infection, helping to
proliferate the spread of the virus. This along with multiple incidences of crowds at carnivals
and soccer matches did not help. It was not until March 12, 2020 that Italy shut all its factories
and non-essential production. By that time the infection had spread as can be seen from the
above graph. Unfortunately, a significant proportion8 (estimated to be around 20%) of the
health care personnel too got infected putting further stress on the country’s ability to fight the
infection.

7
 Source: https://Kaggle.com , updated till April 21, 2020.
8
 Source: https://statista.com

IAI Pandemic Research Group Page 11 of 39
With Italy having one of the world’s oldest populations, it was the age group of 50 years and
above that was the hardest hit. Age group of 70+ have contributed to majority of the deaths9.

Important and unique observations
Even with one of the world’s best healthcare systems, Italy’s experience proves that once the
system gets stressed and the medical personnel get infected, it can severely affect the
country’s ability to fight against any pandemic.

As the healthcare system could not cope with increased number of cases, home quarantine
cases started increasing. Lack of proper medical care (especially ventilators) started
contributing to increase in CFR. Old population was the hardest hit and the graph shows the
impact. Lack of social distancing, dense population and testing of only infected cases (initially)
also contributed to increasing spread of infection.
Learnings
Though India has a relatively young population, its healthcare system bears no comparison to
that of Italy. Any stress on its healthcare system can have a devastating impact on the fight
against COVID 19.
Similar to cities like Milan, Indian metros like Mumbai and Delhi are also seeing significant
spread of the virus mainly due to the dense population. The problem for India could only
worsen, as unlike Italy, the urban population size of India is ~ 12 times that of Italy and density
is ~1.75 times. Maintaining social distancing and following lockdown measures, are key in
slowing the rate of transmission.

9
 Source: Kaggle.com. Data until 21st April.

IAI Pandemic Research Group Page 12 of 39
3.4. Germany’s COVID-19 Experience As at May 10, 2020, 171,999 people were infected with 7,569 deaths. Its death rate also known as Case Fatality rate (CFR) of ~4%, is approximately half of the world’s average of ~7%. Germany has stood out in its fight and containment of SARS-COV-2 amongst the prominent EU members. The first case of COVID-19 got confirmed on January 28, 2020 and thereafter the number of infections has followed the graph depicted below with the number of infections as at April 28, 2020 standing at 156,33710. Daily new cases haven fallen below 2,000, from the peak of 6,294. Germany appears to be well past its peak. This could be attributed to the high number of tests they have conducted (over 2 million as on April 19, 2020). Most cases (~67%) are between ages 15 and 59 years old; with women (52%) and men (48%) almost equally affected. 87% of deaths, but only 19% of all cases, occurred in lives aged 70 years or older. Germany’s response had 4 key aspects - protection of the particularly vulnerable segments of the population diagnostics development of drugs and vaccines, and information and education. Important and unique observations Germany is widely quoted for its high number of testing (over 2 million) and the testing rate is 24.7 per thousand as on April 19, 2020. It is also visible from the gap between onset of symptoms and reporting dates. 10 Source: www.worldometers.info IAI Pandemic Research Group Page 13 of 39
Germany has had remarkably few COVID-19 deaths, which experts attribute partly to its high
number of hospital beds and ICU beds. The hospital bed to person ratio is 8.1 beds per 1,000
people and 6.1 ICU beds per 1,000 people as compared to ~ 4 per 1,000 in Italy and USA.
The country was also quick to roll out reliable tests for the COVID -19 coronavirus and initiate
strict social distancing measures to prevent the spread. Another reason why Germany was so
quick to start testing for COVID-19 is that private labs nationwide were free to offer tests, and
as of April 30 have helped the country test 2.5 million people for the disease lagging behind
only the USA and Russia.
Learnings
Similar to other countries, observed incidences increase with age11 is provided in the below
chart. To illustrate, for ages 20-29 there are ~250 females per 100,000 as compared to ~550
per 100,000 for ages 90-99.

Hospitalisation was reported for 17% of cases. Approximately 75% persons have recovered,
based on an Algorithm, as the exact date of recovery is unknown in most cases.

11
 Source: https://www.rki.de/DE/Content/InfAZ/N/Neuartiges_Coronavirus/Situationsberichte/Gesamt.html

IAI Pandemic Research Group Page 14 of 39
The median age of deaths is 82 years. Of the total deaths, 87% were in persons 70 years or
older, but only 19% of all cases were from this group.

 Age Group (in years)
 Gender
 0-9 10-19 20-29 30-39 40-49 50-59 60-69 70-79 80-89 90-99 100+
 Male 0 1 4 8 35 142 394 937 1,437 382 4
 Female 1 0 2 4 9 44 132 431 1,250 658 32
 Total 1 1 6 12 44 186 526 1,368 2,687 1,040 36

Germany responded to the situation unfolding in China as early as January and had testing
established by mid-February. Germany was one of the first few countries to develop a testing
system for COVID-19. Its early access to reliable tests for COVID-19 meant that it could get a
much better estimate of who was infected, isolate contacts, and treat those who need care.
This ensured effective targeted response.
Even with a good bed to person ratio, it ensured that additional beds were available in hospitals
for proper care.
India is also revamping the number of beds available as this is key to keep the mortality rates
low, but like Germany, more testing post lockdown may be needed to contain the transmission
rate.

 3.5. USA’s COVID-19 Experience

As of May 10, 2020, total number of cases in the USA are 1,369,943, with 1,302,752 Active
cases and 80,846 total deaths. Case fatality rate of USA stands at ~6% compared to world
average of 7%.
The first case of COVID-19 was confirmed on January 20, 2020 and thereafter the number of
cases has increased significantly12.

The COVID-19 cases in the USA surged past 1,000 on March 9, 2020. This was almost 50
days after the first confirmed case of COVID-19. However, the next 1,000 COVID-19 cases

12
 Source: www.worldometers.info

IAI Pandemic Research Group Page 15 of 39
were recorded within a short period of 3 days till March 12, 2020. Post that, the country has
recorded more than 1,000 cases each single day.
In April, the new cases appearing have been around 28,000 each day with the highest of
38,958 cases being recorded on a single day. New York City, the financial capital of the world,
has emerged as the epicentre of coronavirus in the world, which has alone contributed to 30%
of total cases recorded in the country. Currently, USA became the first country where the virus
has infected a sobering number of 1,000,000 lives.
Important and unique observations
Although 17% of the USA population is 65 or older, more than 32% of cases have been
recorded for this age bracket. Almost 53% of ICU admissions and 80% of deaths are reported
from the older population of the country.
A recent study of COVID-19 cases in the United States estimated a mortality rate of 9% for
population aged above 65, 3% for those ages 55 to 64 and less than 1% for those ages 20 to
54. The mortality rates experienced have been lower than Italy’s mortality rates but greater
than China’s mortality rates.
Learnings
As per the editorial article stated in “The Lancet” magazine as on March 28, 2020, the initial
slow response has been criticised for the wide spread of the virus.
Many countries including the USA are still not following WHO's clear recommendations on
containment (widespread testing, quarantine of cases, lock downs and social distancing) and
have not implemented appropriate measures to control the lockdown.

IAI Pandemic Research Group Page 16 of 39
4. Projection Models One of the core objectives of the Group was to develop a statistical model for projecting COVID-19 scenario in India. The model is expected to give a view on the expected number of cases and deaths / recovery over the next two months. Though there are many statistical models to model a pandemic scenario, coming from first principles, the Group primarily focused on the following two multi-state models below. 3) HIRD (Healthy, Infected, Recovered, Dead) model 4) SEIR (Susceptible Exposed Infected Removed) model Both the models have been calibrated and validated on data for COVID-19 cases in India. Further, we have instances of back testing and captured in Appendix B. The projection accuracy from both the models against the actual data has been in the range of 97% - 99%. High accuracy of both the models also help calibrate the results from two different perspectives. Given the high accuracy in the projections and estimates from both the models and alignments in the outcome, the Group has used the HIRD model for projecting the Confirmed, Active, Recovered and Death cases up to June 30, 2020. 4.1. Data Data has been collected from various sources as given below. https://ourworldindata.org/coronavirus-data - used for getting historical data contains day to day confirmed cases and deaths because this data matches with https://www.mohfw.gov.in/ daily figures declared at 8:00 am. https://www.worldometers.info/coronavirus/country/india/- used for getting historical data contains day to day recoveries. https://api.COVID-19 india.org/csv/ - used for patient level data. https://www.mohfw.gov.in/ - used for daily updates. Since the collected data were in different formats, it was converted into a single format, for which a data dictionary has been developed. Data contains day to day figures for confirmed cases, deaths and recoveries from January 30, 2020 till date. Data is being updated on daily basis. For the purpose of testing the model's outcome, projections, numbers have been collected from the website of Ministry of Health and Family Welfare (https://www.mohfw.gov.in/). On the website, numbers are updated twice daily, once at 8:00 am and the other at 5:00 pm. As the model has been calibrated on the basis of data declared at 8:00 am, for the purpose of testing the similar updates have been used. Back-testing was mainly done for the projected cumulative cases, cumulative deaths, cumulative recoveries and active cases with an acceptable error limit of +/- 5%. Both the models, HIRD and SEIR, have been explained in detail in the following sections. IAI Pandemic Research Group Page 17 of 39
5. Model 1: HIRD (Healthy, Infected, Recovered & Dead)
 model

The HIRD model is a multi-state Poisson model. Compared to the SEIR model, the HIRD
model in addition to the total confirmed cases, also projects expected recovery as well as
expected deaths.

 5.1. Approach and Assumptions

In this model, 4 states are considered, namely:
 1. Healthy (H)
 2. Infected (I)
 3. Recovered (R)
 4. Dead (D).

 where,
 i(t) -> Probability of getting infected
 r(t) -> Probability of getting cured
 q(t) -> Population Mortality
 q’(t) -> Case Fatality Rate (Death
 due to COVID 19)

The HIRD model is a basic construct that the Group has come up with, from a basic intuitive
perspective. But at the same time, it is difficult to obtain the underlying data of transition from
healthy state to infected state and hence there is reliance on back testing and calibration, while
determining the state transition probabilities.
It is notable that the data for India contains only 1 case for each of the dates, 30th January, 2nd
February and 3rd February. Whereas the numbers from 2nd March onwards appear to be much
more consistent. Therefore, for the purpose of calibrating the model data from February 29,
2020 to April 14, 2020 has been used.
What adds credibility to the whole process is the result of back testing that is captured in
Appendix B.

 5.2. Calibration methodology

The following assumptions were required in order to generate the results. W here possible,
data was used to derive the assumptions. However, significant actuarial judgement was
required to fine-tune and project most of the assumptions listed below.
Where possible, this has been deliberated in the points below.

IAI Pandemic Research Group Page 18 of 39
Start Date Although the first case in India was observed on January 30, 2020, for the purposes of our model, we have assumed a start from February 29, 2020 when the number of cases, started to increase in India. While this may have typically led to errors in calibration, we have not seen any outliers as a consequence of this approach. Transmission rate This is the rate at which an infected individual could end up infecting another set of healthy individuals daily. While this state is intuitive, no direct data is available to calibrate the parameters. Transmission rate is used to project the expected number of infected cases. Infected (t+1) = Infected (t) * (1+ Transmission Rate (t)) However, extraneous factors, e.g. prevailing social distancing norms, active communication from various stakeholders, alertness from the government, lockdown measures taken, etc. would have a significant bearing on the rate of transmission. Hence, the following dates have been considered from differentiating the transmission rates. Day 0 to Day 9 -> The start of the pandemic in India on January 30, 2020 to March 9, 2020, when governments across the world were learning the scope of the crisis, and no control measures had been implemented in India. To calibrate the transmission rate for this period, the chi squared total of this period plus 27 days, i.e. from February 29, 2020 to April 5, 2020, has been minimized using Excel Solver. Day 10 to Day 24 -> From March 10, 2020, when rigorous monitoring of incoming international flights was done and people were advised to follow social distancing norms till 25th March when complete nationwide lock-down was implemented. Similarly, to calibrate the transmission rate for this period, the chi squared total from 10th March to 24th March has been minimized using Excel Solver. Day 25 to Day 45 (Lockdown 1.0) -> Once Lockdown was enforced, it helped in reducing the day to day transmission rate. So, to analyse and incorporate the effect of this in the model, one transmission rate has been introduced for the period from 25th March to 14th April (21 Days) by minimizing the chi squared total. Day 46 to Day 63 (Lockdown 2.0) -> the Lockdown was continued even after the 21-days period ended, it helped in further reducing the day to day transmission rate. So, another transmission rate was introduced for next 18-days i.e. from 15th April to 3rd May. Day 64 to Day 78 (Lockdown 3.0) -> Lockdown continues after the completion of second phase, it is likely to help in further reducing the day to day transmission rate. So, one more transmission rate has been introduced for next 14-days i.e. from 4th May to 17th May . Post 17th May, it is expected that all restrictions are likely to be removed, however, social distancing norms will be maintained. One more transmission rate has been introduced for the period post 17th May which is expected to be the future infection rate. IAI Pandemic Research Group Page 19 of 39
Detection of infection The proportion of asymptomatic cases: Limited information from the government suggests that around 70%13 of the infected population may be asymptomatic. Average time for asymptomatic cases to stop being infectious: No data from India is available regarding this assumption. However, globally, on an average, 14 days is expected to be adequate quarantine period after getting exposed to the virus, we believe the mean would be around 10 days, so that the probability of being infectious after 14 days is only about 8%. Mean of the distribution around the incubation period for the symptomatic lives: International literature suggests this might be around 5.214. Since we are using a Poisson distribution, we have assumed a mean of 5.5. Mortality / Recovery Mortality Rate assumptions have been derived by minimizing the chi squared total of death numbers and applied to the cohort of lives that are confirmed as being COVID- 19 positive on any given day. It has been observed from the experience of the other countries that age and pre- existing conditions (especially cardio-vascular conditions) are highly correlated with death. Given limited information from our market, we have decided to use a single death rate for now. The remaining lives are assumed to recover. It is assumed that from the date of confirmation of COVID-19, the deaths and recoveries follow a Poisson distribution with a mean of 7 days and 18.25 days respectively. This has been derived by minimizing combined chi squared number total of deaths and recoveries. 5.3. Parameters estimated The derived parameters are as below: Transmission rates: 17 May till Day (from 29 February,2020) 1- 9 10 - 24 25 - 44 45 - 63 64 - 77 June '20 end May Best Estimate 1.737 1.291 1.178 1.132 1.132 1.120 1.100 13 https://timesofindia.indiatimes.com/india/69-of-cases-found-positive-were-asymptomatic- icmr/articleshow/75282825.cms 14 https://www.worldometers.info/coronavirus/coronavirus-incubation-period/ IAI Pandemic Research Group Page 20 of 39
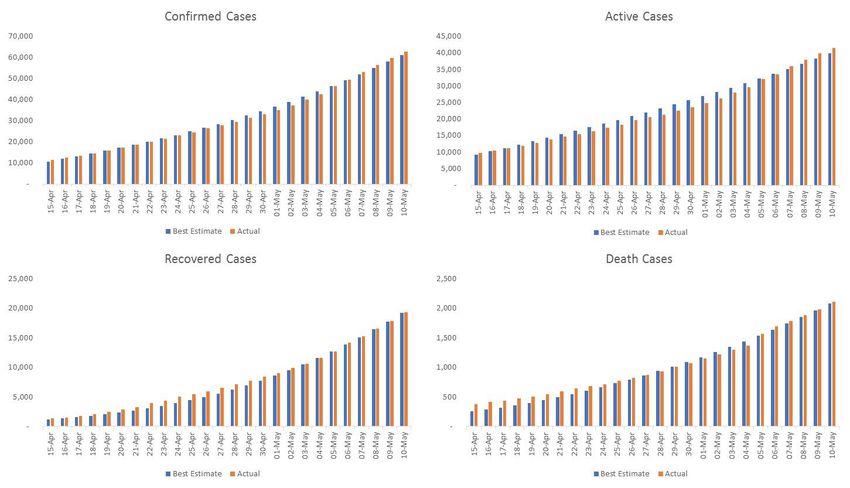
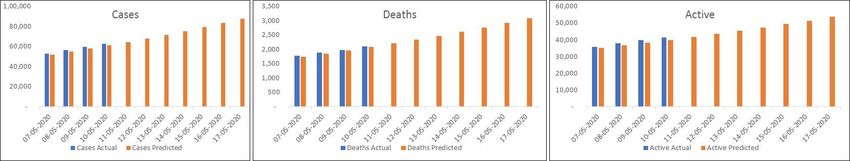
Death and Recovery Rates: Death Rate 5% Recovery Rate 95% Time – Lag Distributions: Time-lags such as Incubation Period, Time to Recovery & Time to deceased are not assumed to be constant. Instead it was assumed that all these follow Poisson distribution with different means. All these lambda values have been derived using excel solver by minimizing the respective chi squared totals and then adjusted with the actual scenarios / numbers Recovery Period (Asymptomatic) ~ Poisson(10) Incubation Period ~ Poisson (5.5) Recovery Period (Symptomatic) ~ Poisson(18.25) Time to Deceased ~ Poisson (7) 5.4. Modelled vs Actual Model was calibrated with data available for the first 45 days, i.e. data till April 14, 2020 and then projected till May 10, 2020.The differences between the projected v/s actual cases are depicted below. The graphs show the model projection (best estimate) vs Actual cases. Given the data availability, the model fit seems reasonable. The Group also looked at SEIR to independently calibrate the projection (especially confirmed cases) IAI Pandemic Research Group Page 21 of 39
6. Model 2: SEIR (Susceptible Exposed Infected & Removed) model SEIR is one of the well-known compartmental models. A compartmental model is a mathematical modeling of an infectious disease, which in this case is COVID-19. It is a multi- state model which models the flows of lives between four states: susceptible (S), exposed (E), infected (I), and removed (R). Each of those variables represent the number of people in those states. An additional stage “Quarantined” has also been considered. The quarantined stage has been assumed as once an individual is tested positive, he/she will be isolated. Hence, his/her ability to further infect others will significantly reduce. Further, the removed state has been split into recovered and dead. So in total there are 6 different states that have been modelled. 6.1. Approach and Assumptions Each individual belongs to any one of the 6 states: Susceptible (S): Healthy Individuals Exposed (E): Individuals who are infected but are not yet infectious. Infected (I): Individuals who are infectious but have not yet been tested. This is the group infecting people from the Susceptible group. Quarantined (Q): Individuals who have been tested positive and have been quarantined/hospitalized. These individuals are then not able to infect more people. Recovered (R): Individuals who have recovered. Death (D) - Individual who have died Key Assumptions: A person is in exposed state for the duration of incubation period. To estimate the initial number of exposed, it is assumed that the date on which the person enters the exposed state is the date of admission minus (incubation period +days to testing). All demographic changes in the population (i.e., births, deaths, and ageing) are ignored. This is a closed system with a constant population size. As a person enters the “Recovered” stage, he/she cannot be under “Susceptible” again. Exposed, Infected and Quarantined migrate at a constant rate. IAI Pandemic Research Group Page 22 of 39
6.2. Calibration methodology Individuals transition between the different states in the following manner: Here, N: total population in which the disease can spread St: Number of susceptible individuals on day t Et: Number of exposed individuals on day t It: Number of infected individuals on day t Qt: Number of quarantined individuals on day t Rt: Number of recovered individuals on day t Dt : Number of individuals died on day t b: expected number of people an infected person infects per day (R0 per day). Hence, b= number of contacts per infected person per day * probability of transmission e: Proportion of exposed being infectious per day, e= (1/incubation period), q: Proportion of infected quarantined per day. q= (1/number of days between a person getting infected and diagnosed). r: Proportion of quarantined recovered per day. r = (1/time to being recovered). d: Proportion of quarantined died per day. d = (1/time to die). R0: the total number of people an infected person infects. R0= b*duration of infection = b/q The model is described by the following differential equations: =− = − = − = − − IAI Pandemic Research Group Page 23 of 39
= = This resolves to the following difference equations: +1 = − +1 = − − +1 = − − +1 = + − − +1 = − +1 = − The total number of confirmed cases at time t Is given by Q t + Rt+ Dt S0: the entire population is susceptible at time 0 The only reliable data that was consistently and readily available was for cumulative Active, Recovery and Death cases for the country. The granularity of data required to estimate the transition probabilities between the various states was not available. Hence, it was decided to estimate the population exposed and infected based on the active cases at a given date. So, to forecast the number of individuals under each state, we need to set the start date and calculate the number of lives in each state on that date. It has been observed that: There is a gap of almost a month between the first three and subsequent cases. Post March 22, 2020, no international flight landed in India. Hence, people who had got the infection by travelling to other countries came to India till that date. Lockdown was enforced from March 25, 2020. The lockdown was enforced relatively early (compared to other developed countries) and the total number of cases were very low. Hence, we decided to have March 24, 2020 as the base date. The lockdown measures have since then been largely constant. There were 489 confirmed cases and 33 removed cases reported till then. This gives us the value for Q (456) and R (24) and D (9) on March 24, 2020. Using these estimates as the base, we calculated the number of individuals in the Infected state and Exposed state. Assuming an average incubation period of 5 days and average time in Infectious state for 3 days (during the pre-lockdown phase), lives in Exposed and Infected state were estimated. The model then projects future values in each stage based on the difference equations and the parameter values provided. In order to incorporate the impact of lockdown and other measures, the timeframe was divided into three sections: IAI Pandemic Research Group Page 24 of 39
Pre lockdown Phase Lockdown Phase Post lockdown Phase It is assumed that the parameter values are different for the three phases as: Interaction of individuals is limited Lockdown slowed the growth of pandemic. The number of cases post the second lockdown are dependent on the measures taken (whether there is an extension of lockdown or not). Government testing strategies and other measures are changing with time. Further, it is assumed that N (available population) is a proportion of the total population. This is because it is practically not possible to have the entire population being in the susceptible state. However, for the purpose of this model, since lives in the Exposed and Infected state are estimated based on Active cases as at the base date, lives at Susceptible state has no effect on the modelled and projected cases 6.3. Parameters Estimated Following parameters have been estimated for the model There is no published study, at the time of writing this report, that has empirically established the above parameters and hence, the parameters have been estimated based on anecdotal evidences as well as observing the patterns in the actual data. Hence, any error in the reporting of the data is also part of the parameters’ estimation. We have used actual data till April 20, 2020 to fit the model and rest is used to compare the actual cases vs projected. While estimating the parameters, it has been ensured the Mean Absolute Percentage Error (MAPE) is within 5% over the modelling period. IAI Pandemic Research Group Page 25 of 39
6.4. Modelled vs Actual

Model was fitted using data until April 20, 2020 and was validated against the actual data until
May 10, 2020. Given the validation results, model calibration seems reasonable.

IAI Pandemic Research Group Page 26 of 39
7. Projections Both the models have performed well on back testing, with projected results being very close to the actual results over the subsequent fortnight. Subsequently, HIRD model has been used for projection, with the SEIR model proving a sense check on the projected cases. This projection is highly susceptible to the following: Social distancing norms followed, similar to that during the lockdown period Contact tracing and the testing capacity to be enhanced Availability of quarantine facilities and Intensive Care facilities are increased The Government has extended the lockdown by 2 weeks till May 17, 2020, with a few relaxations for certain geographies and accordingly permit extent of movement of essential goods within the relevant geographies. As the impact of relaxations will come with a lag, we expect a spike in cases during the latter half of this fortnight, i.e. week commencing May 11, 2020. Additionally, the confirmed cumulative cases are likely to increase further if the lockdown is fully lifted by May 17, 2020. This is because while individuals may follow social distancing norms and maintain personal hygiene, the extent of social distancing is only going to be adverse once lockdown is lifted and public transport starts. The effect of this would only be amplified for densely populated cities, with a majority of workforce dependent on public transport for travel to work. Hence, we may experience another spike in cases during the week starting May 25, 2020. In such a scenario, the peak may get further shifted by a couple of weeks. However, if the social distancing norms and actions of individuals appear to be going out of control, the Governments, both central and state, may have to consider a second wave of lockdown. Another measure of this risk could be a significant reversal in the average time taken for the number of cases to double, which is hovering between 11 to 12 days in the first week of May’20. The testing capacity is also being constantly enhanced. The testing criteria too is being broadened, as the availability of test kits and quarantine facilities improves. While this is likely to increase the daily cases, it will effectively reduce the transmission, facilitate early identification of individuals and their quarantine, hence improving the overall recovery rate. This is because a significant proportion15 of around 70% are likely to be asymptomatic, i.e. they may not develop any symptoms while testing positive and during the quarantine period. 7.1. Daily projections (cumulative figures) The impact of trying to move towards the earlier normalcy by re-opening offices and regular markets is likely to be seen in coming days and the intensity of the impact will also depend on how each of the State governments, in conjunction with the Central Government, enforce the conditions for relaxation, and how the citizens of India follow the social distancing norms, with and without the lockdown conditions being imposed. 15 Source: ICMR IAI Pandemic Research Group Page 27 of 39
Given the uncertainties and extent to which an assumption could have an impact on the final
number, we are projecting cases for 4 different scenarios.
 Phase May 4 to May 17 May18 to end-May June 2020
 Lockdown - with
 Worst-case

 Lockdown status No lockdown
 relaxation
 Social distancing norms Not followed uniformly Not followed

 Transmission Rate for Jun’20 1.143 (7:1)

 Lockdown - with
 Lockdown-

 Lockdown status No lockdown No lockdown
 ceases

 relaxation
 Social distancing norms Followed Followed partly
 Transmission Rate for Jun’20 1.125 (8:1)

 Lockdown – with relaxation
 estimate

 Lockdown status
 Best-

 Social distancing norms Followed
 Transmission Rate for Jun’20 1.100 (10:1)
 Lockdown – with
 Lockdown – limited relaxation
 Scenario

 Lockdown status
 relaxation
 Ideal

 Social distancing norms Strictly followed
 Transmission Rate for Jun’20 1.067 (15:1)

Even though the data available at the time of finalising the above numbers is as on
May 10, 2020, the full impact of the past lockdown is also yet to emerge due to the incubation
period of the disease and the asymptomatic carriers.
Therefore, whether the social distancing norms have been followed strictly in the previous
lockdown phases can still influence how the future may pan out. The impact of this has been
reflected in the model by changing the transmission rates. Transmission rate is used to
estimate the cumulative number of infected people on the following day. Historically, the
assumption calibrated is as follows (as described in Section 5.3). The assumptions used for
the other three scenarios are captured below.
 17 May till
 Day (from 29 February,2020) 1- 9 10 - 24 25 - 44 45 - 63 64 - 77 June '20
 end May
 Best Estimate 1.737 1.291 1.178 1.132 1.132 1.120 1.100
 Lock down - ceases 1.737 1.291 1.178 1.132 1.132 1.125 1.125
 Ideal Scenario 1.737 1.291 1.178 1.132 1.130 1.090 1.067
 Worst-case 1.737 1.291 1.178 1.132 1.140 1.143 1.143

The Best-estimate scenario and Lockdown-ceases scenario assume that the social
distancing norms were duly followed during the lockdown. However, in the former it is
assumed that the social distancing norms during the lockdown continue to be followed even
after May 17, 2020, while in the latter scenario it is assumed that the social distancing norms
get relaxed once the lockdown ends on May 17, 2020.
Even if the lockdown ceases, we assume that since people would have inculcated the good
habits and will continue to partly follow the social distancing norms, the transmission rates
continues to reduce further, albeit at a marginal rate. There could still be some pockets where
because of a lack of formal lockdown, untoward incidences lead to an adverse outcome.
For Lockdown-ceases scenario, a transmission rate of 1.125 per day would mean for every
1,000 infected people on a given day, there would be 1,125 infected people next day. It may
also be interpreted as that for every 8 infected individuals on a given day, there would be 1
additional infected individual on the next day, taking the tally to 9.

IAI Pandemic Research Group Page 28 of 39
On the other hand, if the social distancing norms like that in a lockdown are followed as they
have been in the past, the transmission rate will continue to decrease significantly. In the long
run, for the Best-estimate scenario, a transmission rate of 1.100 per day would mean for
every 1,000 infected people on a day, there would be 1,100 infected people the next day.
Hence, for every 10 infected individuals on a given day, there would be 1 additional infected
individual on the next day, taking the tally to 11.
In an optimistic scenario, if the social distancing norms have been very strictly followed, and
continue to be done so in the future, this could help significantly reduce the transmission
probabilities as modelled in the Ideal scenario. This scenario also assumes that the state
governments do not offer many relaxations above what have been mandated by the Central
government during the third phase of the lockdown, and that the lockdown continues beyond
May 17, 2020. Additionally, this scenario assumes that social distancing and maintaining
personal hygiene are engrained in individuals, and hence the transmission rate has been
taken to be slightly better even in the third phase of the lockdown. This helps in significantly
containing the spread in India. In the long run, a transmission rate of 1.067 per day would
mean for every 1,000 infected people on a day, there would be 1,067 infected people the next
day. Hence, for every 15 infected individuals on a given day, there would be 1 additional
infected individual on the next day, taking the tally to 16.
The Worst-case scenario is just to illustrate an extreme scenario, wherein people have not
been following social distancing norms and guidelines issued by the Government. In this case,
the transmission probability is higher than the other scenarios and continue to gradually
increase during the projection period. While the social distancing norms may be followed in
majority of the districts, there could be a few pockets where these are not adhered to. In order
to capture the effect of these localised events and at an aggregate level, a nominal mark-up
in the transmission rate is assumed. This causes the peak of active cases to be considerably
delayed in India. Under the scenario, a transmission rate of 1.143 per day would mean for
every 1,000 infected people on a day, there would be 1,143 infected people the next day.
Hence, for every 7 infected individuals on a given day, there would be 1 additional infected
individual on the next day, taking the tally to 8.

IAI Pandemic Research Group Page 29 of 39
You can also read