COVID-19 AND THE POWER SECTOR IN SOUTHEAST ASIA: IMPACTS AND OPPORTUNITIES - NREL
←
→
Page content transcription
If your browser does not render page correctly, please read the page content below

COVID-19 AND THE POWER SECTOR IN
SOUTHEAST ASIA: IMPACTS AND
OPPORTUNITIES
Travis Lowder, and Nathan Lee, Ph.D.
National Renewable Energy Laboratory

Jennifer E. Leisch, Ph.D.
Two Degrees Group

June 2020

A product of the USAID-NREL Partnership
Contract No. AIG-19-2115
NOTICE

This work was authored, in part, by the National Renewable Energy Laboratory (NREL), operated by
Alliance for Sustainable Energy, LLC, for the U.S. Department of Energy (DOE) under Contract No. DE-
AC36-08GO28308. Funding provided by the United States Agency for International Development (USAID)
under Contract No. AIG-19-2115. The views expressed in this report do not necessarily represent the views
of the DOE or the U.S. Government, or any agency thereof, including USAID.

                         This report is available at no cost from the National Renewable
                         Energy Laboratory (NREL) at www.nrel.gov/publications.

                         U.S. Department of Energy (DOE) reports produced after 1991
                         and a growing number of pre-1991 documents are available
                         free via www.OSTI.gov.

Cover photo from iStock 58861883.
NREL prints on paper that contains recycled content.
Acknowledgments
The authors wish to thank Scott Bartos of the U.S. Agency for International Development (USAID)
Regional Development Mission for Asia for conceiving of and funding this work, and for his guidance
during its development. We also express our deep gratitude for all the peer reviewers on this report,
including Ananth Chikkatur and Ha Dong Son of the Vietnam Low Emission Energy Program, Leonila
Gutierrez of USAID Philippines, Peerapat Vithayasrichareon of the International Energy Agency, Dana
Kenny, Winston Chow, Thanawat (“Yok”) Keereepart, Pitoon (“PJ”) Junthip, Maythiwan (“May”)
Kiatgrajai, and Joost Siteur of USAID Clean Power Asia, Sherry Stout and Andrea Watson of the
National Renewable Energy Laboratory (NREL), and Thomas Haslett of USAID E3. We also appreciate
the graphics support from Billy Roberts of NREL. Last, we would like to thank Isabel McCan, Liz
Breazeale, and the NREL Communications team for their efforts in refining this report and bringing it to
publication.

                                                        iii
This report is available at no cost from the National Renewable Energy Laboratory at www.nrel.gov/publications
List of Acronyms
ASEAN                                                Association of Southeast Asian Nations
CDC                                                  Centers for Disease Control and Infection
COVID-19                                             coronavirus disease
GDP                                                  gross domestic product
IEA                                                  International Energy Agency
IPP                                                  independent power producer
NGCP                                                 National Grid Corporation of the Philippines
NREL                                                 National Renewable Energy Laboratory
PLN                                                  Perusahaan Listrik Negara
PPA                                                  power purchase agreement
SE                                                   southeast
USAID                                                U.S. Agency for International Development
WHO                                                  World Health Organization

                                                        iv
This report is available at no cost from the National Renewable Energy Laboratory at www.nrel.gov/publications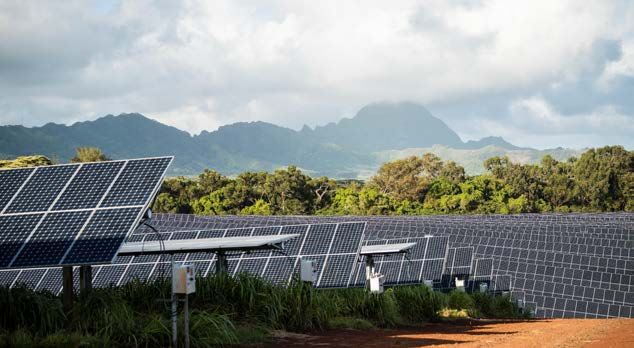
Table of Contents
1   COVID-19 and the Power Sector in Southeast Asia ............................................................................... 1
2   Overview: COVID-19 in SE Asia ............................................................................................................. 2
3   Power Sector Vulnerabilities .................................................................................................................... 4
    3.1 Increasing Severity and Frequency of Natural Threats ...........................................................4
    3.2 Power Sector Financial Health................................................................................................4
    3.3 Fuel Mix and Fossil Fuel Reliance .........................................................................................5
    3.4 Growing Energy Demand ........................................................................................................6
    3.5 Air Quality and Pollution ........................................................................................................7
4   COVID-19 Impacts on the Power Sector................................................................................................. 8
    4.1 Power Demand ........................................................................................................................9
        4.1.1    Impacts ................................................................................................................... .9
        4.1.2    Opportunities and Recovery Responses ................................................................. 12
    4.2 Contracts and Investment......................................................................................................13
        4.2.1    Impacts ................................................................................................................... 13
        4.2.2    Opportunities and Recovery Responses ................................................................. 14
    4.3 Air Quality and Emissions ....................................................................................................14
        4.3.1    Impacts ................................................................................................................... 14
        4.3.2    Opportunities and Recovery Responses ................................................................. 14
    4.4 Energy Sector Workforce .....................................................................................................15
        4.4.1    Impacts ................................................................................................................... 15
        4.4.2    Opportunities and Recovery Responses ................................................................. 15
5   COVID-19 and the Clean Energy Transition ....................................................................................... 16
    5.1 Impacts ..................................................................................................................................17
    5.2 Clean Energy Opportunities and Recovery Responses .........................................................17
6   Building Long-Term Energy Sector Resilience..................................................................................... 19
    6.1   Resilient Power Sector Planning ...........................................................................................19
    6.2   Resilience of Critical Services ..............................................................................................20
    6.3   Financial Resilience ..............................................................................................................20
    6.4   Clean Energy and Power System Resilience ........................................................................20
7   Path Forward ........................................................................................................................................... 22

                                                                                 v
This report is available at no cost from the National Renewable Energy Laboratory at www.nrel.gov/publications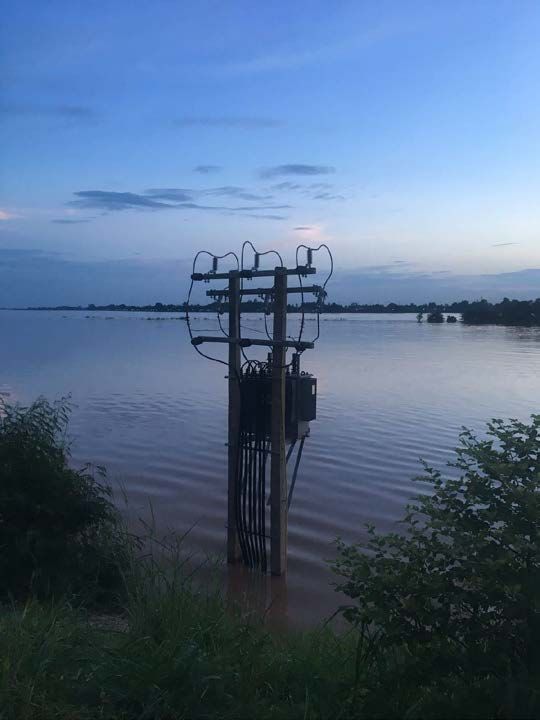
List of Figures
Figure 1. Total disasters reported in SE Asia from July 2012 to June 2018 ................................................. 4
Figure 2. Financial conditions of select SE Asian power sectors ................................................................. 5
Figure 3. Power sector generation mix (installed capacity) in SE Asia 2000–2018 ..................................... 6
Figure 4. Singapore systemwide electricity demand during the second week of April in 2019 and 2020 . 10
Figure 5. Drivers of PLN's operating income, 2013–2018 ......................................................................... 11
Figure 6. Share of global economic and energy indicators in SE Asia ....................................................... 16
Figure 7. Resilient energy planning process ............................................................................................... 20

List of Tables
Table 1. SE Asia Pandemic Response in 2020 ............................................................................................. 2
Table 2. GDP Growth and Projected Growth Rates for SE Asia with COVID-19 Impacts (% per year) .... 3
Table 3. Impacts of COVID-19 to SE Asia Power Sector and Recovery Responses/Opportunities ............ 8
Table 4. Power Sector Entities Along the Electricity Value Chain .............................................................. 9

                                                                     vi
This report is available at no cost from the National Renewable Energy Laboratory at www.nrel.gov/publications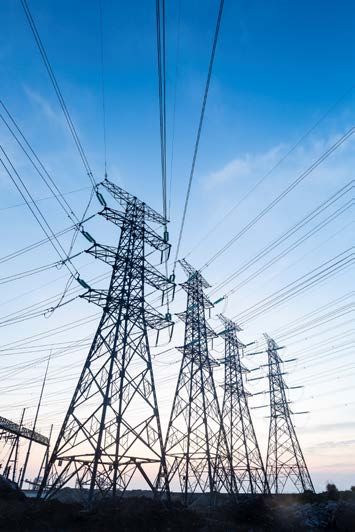
1 COVID-19 and the Power Sector in Southeast Asia
In just a few months, the coronavirus disease (COVID-19) pandemic has
taken a significant toll on populations and economies across the globe.
The International Monetary Fund projected that global gross domestic
product (GDP) could contract by up to 3% in 2020 as a result of the
“Great Lockdown,” or government-mandated closure of businesses,
border closures, and stay-at-home orders across the world aimed at
preventing greater infection and deaths from COVID-19 (IMF 2020). The
World Bank estimate is even higher, at 5.2%. (World Bank 2020a). These
lockdowns have helped to reduce the spread of disease; however, the
protracted economic inactivity has also resulted in a number of supply and
demand shocks across the world (World Bank 2020b).
In the power sector, these lockdown measures depressed commercial and
industrial sector electricity consumption and increased electricity demand
in the residential sector, effectively mimicking a Sunday load curve
through every day of the week. Overall electricity demand has decreased,
with some countries reporting up to a 20% drop in consumption during
periods of full lockdown. This is demand destruction on a scale not seen
over the last 70 years, and it has come with a corresponding dive in
electricity commodity prices (IEA 2020a). Reliable, low-cost energy is
essential to the pandemic response and economic recovery.                            Photo from iStock 515803636

Power sectors across the globe are now experiencing ripple effects. System operators face workforce and supply chain
disruptions, modified control center protocols, and the challenge of forecasting demand in a time of heightened
uncertainty (Walton 2020). Energy utilities, experiencing reduced electricity sales, are receiving less revenue relative to
their projections, straining their cost recovery on rate-based infrastructure, which may lead to higher retail prices in the
future (Kaushik, Kimbrough, and McKaughan 2020). Independent power producers (IPPs) are also receiving less
operational revenue (resulting from lower overall demand and lower wholesale electricity prices), which could force
project loan defaults (Rios 2020). New renewable energy generation is challenged by the invocation of force majeure
clauses, low wholesale energy prices, supply chain issues, and other factors (Stebbing, Down, and Emmet 2020).
Nevertheless, renewables are currently the only generation type showing resilience to pandemic lockdown measures.
Renewable generation has increased by nearly 3% worldwide, largely due to a wave of projects that came online before
the pandemic, and their primary placement in the merit order of dispatch (such as “must run” generation). In the longer
term, reduced demand and supply chain disruptions could delay the construction of new renewable energy projects
(IEA 2020a).
While these are global trends, each country or region is experiencing unique impacts. Southeast (SE) Asia, a region of
rapid economic growth and increasing energy demand, faced unique power sector vulnerabilities (such as exposure to
natural threats, strained finances, and reliance on fossil fuels, among others) prior to this pandemic that may pose even
greater risks in today’s volatile market conditions. COVID-19 is exposing some of these vulnerabilities in the region;
however, it also presents an opportunity to safeguard the reliable, sustainable, and low-cost provision of power. As
governments in SE Asia deliberate over the most effective means of combatting the economic damage from the
COVID-19 pandemic, the region has an opportunity to couple economic recovery with a roadmap to achieve broader
power sector resilience, human health, and climate objectives.
The purpose of this report is twofold:
    1. Present an early assessment of COVID-19 impacts on the power sectors of countries in SE Asia.
    2. Identify opportunities to build power sector resilience as SE Asian countries respond to and recover from these
        impacts.
The impacts of the COVID-19 pandemic are rapidly evolving across the globe, and a more comprehensive assessment
of the consequences will become easier with hindsight. Instead, this work intends to provide early insights and potential
actions countries may take during the course of recovery.

                                                             1
       This report is available at no cost from the National Renewable Energy Laboratory at www.nrel.gov/publications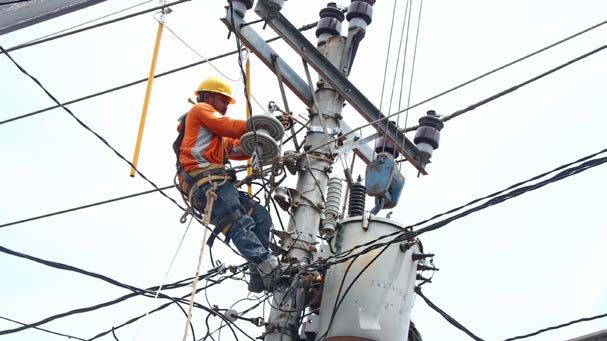
2 Overview: COVID-19 in SE Asia
         The World Health Organization (WHO) reported over 7.27 million confirmed cases of COVID-19 worldwide as
         of June 11th, 2020, with over 400,000 attributed deaths (WHO 2020b). Across SE Asia, the confirmed case count
         has been growing, though some countries have enacted early and aggressive measures which have successfully
         slowed transmission within their borders. In some cases, such as Vietnam and Singapore, actions to stem
         pandemic impacts were heavily informed by experience with the 2003 – 2004 SARS epidemic. The range of SE
         Asian country-level pandemic control and economic stimulus responses is compiled in Table 1.

Table 1. SE Asia Pandemic Response in 2020
Country        Pandemic Control Response                                         Economic Stimulus Response
               On March 16, Brunei enacted travel restrictions for citizens      After announcing temporary economic measures on March 19,
               and foreigners and prohibited mass gatherings, weddings,          Brunei Darussalam announced additional financial support
Brunei         and sporting events. This was expanded to ban foreign             ($317 million) on March 30, 2020. The Economic Relief
               visitors on March 24.                                             Package includes deferred payments on loans and waivers on
                                                                                 bank fees/changes.
               On March 18, Cambodia closed locations and canceled                On March 9, Cambodia allocated between $800 million and $2
               events to prevent large public gatherings. Travel restrictions     billion for small and medium enterprises. On April 3, the
               were also put in place, previously on March 14. The country        Ministry of Economy and Finance established a working group
Cambodia
               also placed foreign visitors under 14-day quarantine upon          to plan monetary and banking measures, a task force to control
               entry.                                                             supply and prices of strategic goods and a task force to plan
                                                                                  for budget policy on financing and social assistance.
               On March 31, Indonesia temporarily banned foreign visitors        In February, the government announced a stimulus package of
               to the country and declared a health emergency allowing for       $725 million to support key industries and $325 million for low-
               regional social restrictions to be put in place for public        income families. On March 18, Indonesia announced an $8.1
               gatherings. On April 10, the country enacted social restriction   billion package for private and corporate tax breaks. On March
Indonesia
               measures for the city of Jakarta, which closed public             31, a third stimulus package of $24.5 billion was introduced for
               gathering spaces. Other lockdown measures were applied            health, social protection and tax incentives. Another package
               separately in regions of the country.                             was announced on May 18 to proactively prevent economic
                                                                                 impact for large enterprises and social programs.
               On March 30, the Lao PDR closed all international borders         On March 20, the Lao cabinet approved a stimulus package
               until May 3. This was extended with a process to allow entry      and tax relief measures for small businesses. On April 7, the
               for certain foreigners. On the same date the government           World Bank’s Regional Vice-Presidency of the East Asia and
Lao PDR        issued a national stay-at-home order and international border     Pacific Region approved the Lao PDR COVID-19 Response
               closures. Government employees have returned to work on a         Project of $18 million. On April 10, Lao PDR implemented tax
               staggered basis.                                                  breaks and exemptions.

               On March 16, Malaysia closed its borders. On March 18, the From February 27 to April 6, three stimulus packages were
               government enacted a quarantine or “Movement Control       announced totaling $9.1 billion to support key industries (such
Malaysia       Order” to limit public gatherings and travel.              as tourism) and employees, low-income households, small and
                                                                          medium enterprises, and tax deductions.

               On April 17, the Myanmar Ministry of Health and Sport             On March 18, the government enabled certain companies to
               banned gatherings of five or more people and enacted stay-        apply for low-interest rate loans from a relief fund of $71 million.
               at-home orders—including a nightly curfew. This included          On April 27, the government released an economic relief plan
               border closures and restrictions for China, India, and            to encourage business and trade and provide social support.
Myanmar
               Bangladesh. On April 19, Yangon imposed a curfew and              This may be followed by a $2-3 billion stimulus package.
               stay-at-home measures. On May 15, the country expanded
               measures to restrict gatherings in public locations and
               international flights.
               On March 16, the Philippines enacted the Enhanced              On March 30, a $3.9 billion package for social protections was
               Community Quarantine in Luzon to limit movement of             announced. On April 7, the government released $610 million
               populations with transportation restrictions and closure of    in support to local governments. On April 13, a $1 billon wage
Philippines
               non-essential businesses. On May 3, the country also cut all   subsidy package was announced. On May 12, the government
               international commercial flights to and from Manila.           approved a stimulus act to create jobs in rural areas with
                                                                              projects valued at $29 billion.
               On March 22, Singapore closed its borders to short-term        Singapore has announced three COVID response budgets
               visitors. On April 7, Singapore adopted a “Circuit Breaker”, a (“Unity,” “Resilience,” and “Fortitude”) totaling $97 billion since
Singapore      set of elevated safe distancing measures that closed public February. These budgets include individual and commercial
               gathering spaces and limited movement in the country.          support measures, including cash payments, subsidies, and
                                                                              worker support.

                                                                        2
               This report is available at no cost from the National Renewable Energy Laboratory at www.nrel.gov/publications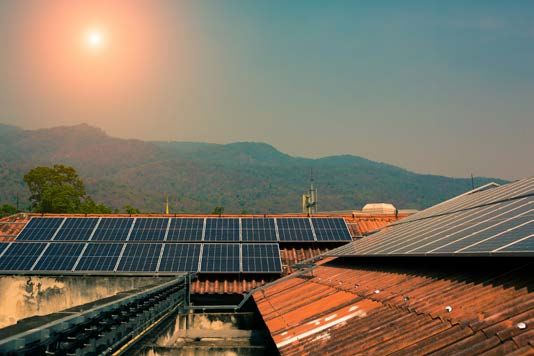
On March 22, Thailand closed all borders and banned               On March 10, Thailand unveiled a $12.7 billon government
              foreign visitors from certain countries. On April 3, Thailand     stimulus package to support the economy. On March 22, the
              enacted a nightly curfew and banned inbound commercial            government announced a plan for commercial banks to borrow
Thailand      flights through June 30. This was extended to include closing     from a central bank lending facility using investment grade
              non-essential businesses, and spaces with large public            bonds as collateral. On April 7, the government announced a
              gatherings on March 26, though some service businesses            stimulus package worth $58 billion to aid workers,
              following required procedures opened in May.                      infrastructure, and small and medium enterprises.
              On February 1, Vietnam temporarily banned flights to and          On March 3, the government announced a $1.16 billion
              from China. On February 13, Vietnam enacted a large scale         stimulus package with tax breaks and earmarks for government
              21-day quarantine measures including suspension of all non-       infrastructure spending. In April, Vietnam also released a $2.6
Vietnam
              essential services, schools, and social distancing. On April 1,   billion stimulus package to support workers and tax collection
              the country started a national lockdown and social isolation      delays.
              measures.
Sources: (Singapore Ministry of Health 2020; U.S. News & World Report 2020; U.S. Embassy in Cambodia 2020; Center for Strategic &
International Studies 2020; KPMG 2020)

      SE Asia, like the rest of the world, is experiencing an economic downturn from the pandemic; however, growth
      forecasts project that several countries in the region will still post positive numbers in 2020, with rebounds
      anticipated in 2021 (Table 2). The situation on the ground is rapidly evolving and actual economic growth in 2020
      will depend on the “shape” of the recovery curve. 1

          Table 2. GDP Growth and Projected Growth Rates for SE Asia with COVID-19 Impacts (% per year)*

                                    2018                       2019                  2020 Forecast*             2021 Forecast*
           SE Asia                   5.1                        4.4                        1.0                        4.7
            Brunei                   0.1                        3.9                        2.0                        3.0
          Cambodia                   7.5                        7.1                        2.3                        5.7
          Indonesia                  5.2                        5.0                        2.5                        5.0
              Lao                    6.2                        5.0                        3.5                        6.0
           Malaysia                  4.7                        4.3                        0.5                        5.5
           Myanmar                   6.4                        6.8                        4.2                        6.8
          Philippines                6.2                        5.9                        2.0                        6.5
          Singapore                  3.4                        0.7                        0.2                        2.0
           Thailand                  4.2                        2.4                       -4.8                        2.5
           Vietnam                   7.1                        7.0                        4.8                        6.8
      *Forecasts from Asian Development Bank (ADB)
                                                 Source: Adapted from Searight (2020)
      SE Asia has been one of the fastest growing regions in the world over the last two decades, with annual rates
      averaging 5%-6% since 2000 (IEA 2020a); however, several of the industries behind that growth are highly
      susceptible to the current state of economic distress. Global demand for manufactured goods, which comprise
      between 16%–70% of GDP in countries such as Vietnam, Cambodia, Malaysia, and Thailand, is falling off.
      Tourism, another major contributor to GDP in the region, has all but stopped. SE Asia may not see rapid recovery
      in the manufacturing sector as demand for goods in the Americas, Europe, and other regions has been impacted
      by the pandemic response. Moreover, international capital has fled the region amid market turmoil. This reaction
      will have impacts across the financial landscape, from currency stability, to sovereign debt to corporate finance to
      renewable energy project finance (Searight 2020; World Bank 2020b). Economic contraction in the region also
      has implications for poverty in the region. While SE Asia has generally seen rising incomes and living standards
      over the last two decades, income inequality remains high in many countries. The COVID-19 pandemic threatens
      to erase some of these wealth gains, reverse this trend for vulnerable populations, and make it harder for many to
      find a pathway out of poverty (World Bank 2020d).

      1Analysts have posited several recovery curve “shapes,” from “V” to “Z” to “U”. This article from the Brookings Institution
      offers an overview of the factors behind and implications of each shape (Sheiner and Yilla 2020).
                                                                      3
              This report is available at no cost from the National Renewable Energy Laboratory at www.nrel.gov/publications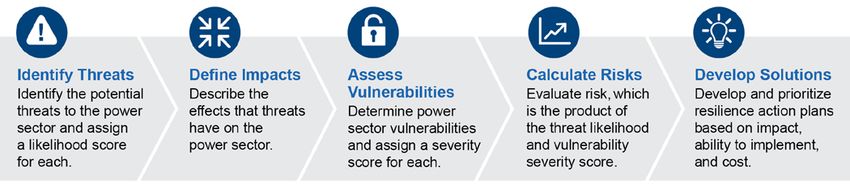
3 Power Sector Vulnerabilities
Power sector vulnerabilities are weaknesses in infrastructure, processes, and systems, or the susceptibility of the
sector to various natural, technological, or human-caused threats. The economic impacts of COVID-19 are
exposing, and sometimes worsening, the existing power sector vulnerabilities in SE Asian countries, which can in
turn imperil the safety, reliability, and sustainability of the region’s power systems. This section provides a non-
exhaustive list of five such vulnerabilities.

3.1 Increasing Severity and Frequency of Natural Threats
Worldwide, both the frequency and resulting cost of disasters are increasing. The two highest loss years in
recorded history (both in terms of insured losses and overall economic losses) were within the last 10 years, and
the entire decade between 2009–2019 was the costliest on record (Insurance Information Institute and Munich Re
2020). SE Asia, in particular, is among the world’s most vulnerable regions to climate change-related threats
(such as increasing temperatures, prolonged drought, changing precipitation patterns, and others). It is also prone
to other catastrophic events such as earthquakes and tsunamis. From 2012 to 2018, SE Asia experienced
approximately 1,380 natural disasters (Figure 1) (AHA Centre 2020). Due to the losses from these disasters,
countries may frequently be in a position of allocating resources to response and recovery, often at the expense of
other investments. This makes pandemics, such as COVID-19, a compounding threat.

    Figure 1. Total reported natural disasters reported in SE Asia from July 2012 to June 2018 (disasters
       include earthquakes, volcano eruptions, and hydrometeorological events such as flooding and
                                                  landslides)
 Source: NREL, adapted from original image from the ASEAN Coordinating Centre for Humanitarian Assistance
                               on Disaster Management (AHA Centre) (2020).
3.2 Power Sector Financial Health
SE Asian countries have diverse approaches to the organization of their power sector. The Philippines and
Singapore have restructured markets where generation and transmission have been unbundled from distribution
and retail sales. 2 Other countries have various levels of vertical integration, controlling much of the value chain

2 In restructured markets, utilities are largely divested of generation and transmission asset ownership, are not responsible for the operation

of the high-voltage transmission system or the wholesale market, and do not have balancing authority beyond their feeder networks, among
other things. Only two countries in SE Asia—the Philippines and Singapore—have restructured markets.

                                                                      4
        This report is available at no cost from the National Renewable Energy Laboratory at www.nrel.gov/publications
between generation and sale of electricity to customers, though several are currently undergoing reorganization.
All countries in the region allow some form of private investment in generation. Figure 2 displays the various
power sector organizations of select countries in SE Asia, as well as their pre-COVID-19 pandemic overall
financial health metrics of project bankability (i.e., ability to attract investment capital), access to financing and
cost of capital (a measure of corporate risk).
Market Power-Sector Organization Financial Financing
Project
Health of and Cost
Bankability
the System of Capital
Indonesia State-owned single buyer with IPPs; utility-
owned grid with retail regulation.
Malaysia Regulated single buyers with IPPS; utility-
owned grid with retail regulation.
Philippines Wholesale market with IPPs; partial retail
competition and grid unbundling.
Singapore Wholesale market with IPPs; retail competition
and grid unbundling.
Thailand State-owned single buyer with IPPs; utility-
owned grid with retail regulation.
Viet Nam State-owned single buyer with IPPs; utility-
owned grid with retail regulation
Other
State-owned single buyer with IPPs; utility-
(Cambodia, Lao
owned grid with retail regulation.
PDR, Myanmar)
Low risk/supportive Potential risk High potential risk
factor for investment factor/barrier for factor/barrier for
investment investment
Figure 2. Financial conditions of select SE Asian power sectors
Source: Adapted from IEA (2019b) Southeast Asia Energy Outlook 2019. All rights reserved.
Several SE Asian utilities (regardless of public or private ownership) struggle with cost recovery. Complicating
this is the fact that rates are already high relative to income in some countries (IEA 2019b). This results in a cost
to the state, as revenue shortfalls are often covered by government subsidies. Additionally, utilities that struggle to
recover costs will see negative impacts to their credit rating, which makes it difficult for them to borrow at
favorable rates in debt markets.
Before the COVID-19 pandemic, some countries had difficulties making needed investments in operations,
maintenance, and infrastructure to meet growing demand, improve reliability, and expand electricity access (IEA
2019b). This baseline financial condition constrains a country’s ability to invest in and implement solutions
needed to improve adaptive capacity, especially in the present-day pandemic environment.
3.3 Fuel Mix and Fossil Fuel Reliance
Over 80% of electricity production in SE Asia is from fossil-fuel based generation (see Figure 3). While coal, oil,
and gas reserves exist in the region, they are not equally distributed across countries. With rapidly increasing
regional energy demand and infrastructure build-out before COVID-19, SE Asia was poised, in aggregate, to
become a net importer of fossil fuels (IEA 2019b).
5
This report is available at no cost from the National Renewable Energy Laboratory at www.nrel.gov/publicationsFigure 3. Power sector generation mix and share of the total regional output by fuel type in SE Asia 2000–
2018
Note: TWh = terawatt-hours. “Other renewables” include solar photovoltaics, wind, geothermal, and modern use
of bioenergy
Source: IEA (2019b) Southeast Asia Energy Outlook 2019. All rights reserved.
This reliance on fossil fuel-based thermal generation in SE Asia creates two vulnerabilities. First, some thermal
assets may decrease power system flexibility, due to either technical or contractual limitations (see Section 4.2).
This can disadvantage variable renewable energy penetration, which in turn complicates power sector
decarbonization. Second, reliance on fossil fuels exposes countries in the region to economic shocks and supply
chain complications in the oil and gas commodity markets. The price of oil is currently at record lows, which may
be temporarily beneficial for electricity prices and IPP profit margins; however, any import disruptions resulting
from restrictions on cross-border trading, or other supply chain obstacles, may impact local price and
availability—ultimately damaging power sector operational integrity. Further, increased fuel imports in the region
may push some SE Asian countries into trade deficits (IEA 2019b). Accordingly, high fuel subsidies in several
countries means increased financial strain on national governments, which currently may need to focus resources
to fund emergency economic stimulus and relief policies.
3.4 Growing Energy Demand
Before the pandemic, SE Asia’s electricity demand was experiencing some of the fastest growth in the world
(averaging 6% per year) (IEA 2019b). This was due to increasing industrialization, urbanization, population
growth, rising incomes, and extensive electrification goals, among other factors. Space cooling is the fastest-
growing energy end-use in SE Asia. Pre-pandemic projections by the International Energy Agency identified
cooling as responsible for 30% of peak electricity demand for 2040, requiring around 200 GW of additional
generation capacity in the region (IEA 2019c).
Analysts estimate that the power generating capacity in SE Asia will need to double by 2035 to accommodate the
growing demand, requiring an investment of $500 billion in generation assets alone (Wood Mackenzie 2017).
Creditworthiness, the policy and regulatory environment, project bankability, and overall economic health will all
play a role in ensuring the necessary public and private financial flows continue to allow for power sector
buildout. The source of finance is important, as China is eager to provide loans through its Belt and Road
Initiative, potentially jeopardizing energy sector sovereignty in SE Asian countries if debt defaults lead to foreign
appropriation of energy sector assets (Ibrahim 2020).
6
This report is available at no cost from the National Renewable Energy Laboratory at www.nrel.gov/publications3.5 Air Quality and Pollution
Fossil fuel combustion for electricity generation, transportation, and industry are major contributors to air quality
concerns in SE Asia, a region that carries one of the highest global air pollution burdens (WHO 2020a). Coal
combustion can be particularly polluting, with toxic emissions of mercury, lead, nitrogen oxides, sulfur oxides,
ash (particulates), and carbon dioxide. The WHO estimates that the Western Pacific region experienced 2.4
million premature deaths attributable to air pollution in 2016 (Nery 2018). Air pollutants pose grave health
consequences that compound impacts from diseases such as COVID-19. SE Asia is also a region of rapidly
growing greenhouse gas emissions, due to high economic growth rates and a heavy reliance on fossil fuels for
power generation and transportation. By 2040, energy-related greenhouse gas emissions in the ASEAN region are
expected to almost double to 2.3 billion metric tons (IEA 2017). Rising greenhouse gas emissions mean that
power sectors in the region will endure increasing impacts from climate-related disasters that affect economic
recovery in the face of disaster.
7
This report is available at no cost from the National Renewable Energy Laboratory at www.nrel.gov/publications4 COVID-19 Impacts on the Power Sector
The COVID-19 pandemic is unique among the range of threats encountered over the last century, and its specific
impacts do not necessarily resemble those of other disasters. In the near term, the pandemic is causing demand
shocks, workforce impacts, supply chain complications, and a global, economic contraction with long-term
consequences as yet unknown. In contrast, with natural disasters the principal impacts are more acute. These
include infrastructure destruction, displaced populations, and often localized economic impact; however, the long-
term response to both of these threats—pandemics and destructive forces of nature—requires similar approaches
to building short-term and long-term resilience that prepare power sectors for safe and reliable operation during
times of disruption.
This section reviews the observed, early-stage impacts of the pandemic and the various lockdown measures on
SE Asian power sectors. Associated with each of these impacts are a set of recovery responses and
opportunities for policymakers, regulators, utilities, and other entities to emerge from this crisis with higher
power system resilience. The impacts and corresponding responses and opportunities discussed in this section are
summarized in Table 3.
Table 3. Impacts of COVID-19 to SE Asia Power Sector and Recovery Responses/Opportunities
Impacts Recovery Responses/Opportunities
Power Demand: Pandemic responses have Energy Efficiency: Increase residential enrollment in energy
decreased overall electricity system demand, efficiency and demand-side management programs to reduce
lowering commercial and industrial usage while consumer bills and improve system reliability.
increasing residential consumption—shifting and Utility Modernization: Transition utilities to adopt modern, digital,
changing the shape of load curves. Residential decentralized, and transactive technologies and processes.
utility bills have increased for much of the
population, adding additional strain to consumer Sector Reform: Consider measures to develop a more market-
financial health that has been impacted by oriented power sector to reduce state obligations and subsidies.
economic disruption. Subsidy Reform: While fossil fuel prices are at historic lows, divert
state support away from energy subsidies toward efficiency
measures that will benefit consumers and toward immediate
pandemic response needs.
Contracts and Investment: Decreasing demand Contract Restructuring/Renegotiation: Investigate restructuring
has exposed inflexibility in the power purchase obligations such that they are resilient to catastrophe situations,
and fuel purchase contract structures of some including pandemics, natural disasters, and economic shocks.
utilities in the region, leading to overpayments for Going forward, new contracts should also be structured to sustain
excess capacity. such flexibility.
Coupling Air Quality with Renewable Energy Policies: Tie in air
Air Quality and Emissions: Declining rates of
quality goals with renewable energy and alternative transportation
fossil fuel combustion have shown temporary
stimulus measures to incentivize further reductions beyond the
improvements in air quality and reductions in
pandemic. Link air quality, emission regulations, and renewable
emissions and pollutants.
energy deployment in future policies/statutes.
Worker Protection Programs: Develop regimes for worker safety
Energy Sector Workforce: Employees of system
and continuity of operations in pandemic environments such that
operators, utilities, and IPPs who are infected with
the power sector can operate safely and reliably. Such programs
COVID-19 (e.g., workers in control centers and
should be adaptable to situations beyond just the pandemic (e.g.,
network operations centers) could threaten critical
applicable for natural disasters and other disruptive events where
system operation.
worker safety and system operations are at risk).
8
This report is available at no cost from the National Renewable Energy Laboratory at www.nrel.gov/publications4.1 Power Demand
4.1.1 Impacts
The power sector is comprised of the entities along the value chain from electricity generation, to transmission, to
distribution, to sale/purchase (Table 4). The impacts of COVID-19 on the power sector affect these entities in
different ways, and not all impacts are the same across countries in the region.
For much of the region, electricity demand Table 4. Power Sector Entities Along the Electricity Value
is undergoing several key changes: Chain
electricity consumption has dropped and Segment Entities
largely shifted to largely to the residential
sector, creating an overall change in the
Generation IPPs, Utilities
shape of daily load profiles. 3 With many
businesses temporarily closed, a slowdown
in manufacturing, and school closures,
System Operators (in
commercial and industrial consumption System Operations and
restructured markets),
has fallen significantly. Transmission
Utilities
These changes have consequences for all
entities along the electricity value chain. Market Operation (in System Operators,
For IPPs, the sudden and unplanned restructured markets) Market Operators
reduction in demand can equate to less
revenue (unless their facility is contracted
under a “take-or-pay” power purchase Distribution Utilities
agreement [PPA]—see Section 4.2). This
could be particularly true for generators
that only run during system peak events,
and therefore are able to capture high Retail Sales
Utilities/Retail Service
wholesale prices when the supply of Providers*
electricity is temporarily limited. Uncertain
revenue impacts IPP debt service and
operating expenditures such as planned Consumption Consumers/Ratepayers
maintenance. It also may affect generator
investments going forward, impacting the
development, construction, and *Only Singapore has full retail competition in its power sector. These
maintenance of energy projects (see entities will not be discussed in this section.
Section 5).
Decreasing demand and shifting load curves also affect transmission system operation. Facing a potential
overcapacity situation, system operators have had to recalibrate their short-term forecasts (two to three years)
and reevaluate their infrastructure planning to respond to the conditions in the marketplace. In countries with high
transmission congestion and where demand growth is outpacing infrastructural buildout, the pandemic could
delay the financing and construction of new assets that may improve system reliability and increase energy
access. On the other hand, lower system demand during the pandemic can temporarily reduce transmission
congestion issues (though with increased residential demand, utilities may see congestion at the distribution
level). Wholesale market operators (if separate from the system operator) have had to deal with the effects of
rapid price declines, market distortions, and arbitrating revenue shortfalls for distribution among market
participants.
3 Assessing whether demand has “dropped” during the pandemic will depend on the baseline that this demand is measured against. While
many countries are seeing a drop in demand relative to the same period in 2019 (i.e., year-over-year), others may be seeing a drop relative
to forecasted demand (i.e., the demand growth anticipated before the pandemic was not realized, even if overall demand has remained
relatively steady). Regardless of the baseline comparison, it is generally the case that demand in every country in SE Asia has been
negatively impacted by the pandemic and the ensuing lockdowns.
9
This report is available at no cost from the National Renewable Energy Laboratory at www.nrel.gov/publicationsFor utilities, falling demand could mean several things, depending on their roles in the value chain. In markets
where utilities are vertically integrated, from generation to sales, they face the issues of the all the entities
discussed above. On the distribution side, higher residential demand is causing greater equipment stress on the
lower-voltage network, as well as revenue reductions from the loss of high-volume customers in the commercial
and industrial rate classes.
Residential demand has increased (especially from air conditioning loads), but in most countries it has been
insufficient to offset decreased commercial load. For example, according to the Philippines Department of
Energy, demand in the interconnected Luzon and Visayas grids has dropped by 30% (Rivera 2020). Malaysia has
seen a roughly 23% drop in demand from the period its lockdown began on March 18th through late April (Wood
Mackenzie 2020). In Singapore, systemwide demand dropped 8% during the period from March 23 to April 25
(Wood Mackenzie 2020). Figure 4 illustrates how the country’s “Circuit Breaker” response to the COVID-19
pandemic on April 7 reduced systemwide electricity demand over the course of a single day (compared to 2019
demand). The figure shows the entire week of April 6 to April 13, with 2020 demand (yellow line) dropping well
below 2019 demand (grey line) for the same period.
Figure 4. Singapore systemwide electricity demand during the second week of April in 2019 and 2020
Note: The Circuit Breaker Measures in Singapore consisted of a set of elevated safe distancing measures in
Singapore (Singapore Ministry of Health 2020). See Table 1 for additional details.
Source: Generated based on information from Publications and Statistics: Half-hourly System Demand Data
accessed on May 30, 2020 from Singapore Energy Market Authority (2020), which is made available under the
terms of the Singapore Open Data License version 1.0 https://www.ema.gov.sg/Terms_of_use.aspx.
As the region heads into its notoriously hot summer period, cooling loads—which comprise a significant portion
of building electricity usage in many SE Asian power sectors (IEA 2018)—are beginning to dominate the
electricity system; however, as most of this demand is composed of distributed air conditioning units at individual
dwellings (as opposed to the central units in many commercial facilities), the efficiency of servicing cooling load
has dropped considerably. This may increase demand at potentially vulnerable low-voltage portions of the grid
(S&P Global Platts 2020).
10
This report is available at no cost from the National Renewable Energy Laboratory at www.nrel.gov/publicationsFigure 5. Drivers of PLN's operating income in U.S. dollars, 2013–2018
Source: IEA (2019a) Southeast Asia Energy Outlook 2019. All rights reserved.
Declining electricity demand also means that utilities are not recovering costs on their rate-based infrastructure
investments as planned. Since cost recovery is already a challenge in some SE Asian countries, the shortfall
between total cash flow from rate collection (operating revenue) and the revenue requirement (operating costs +
regulated return) for the rate base is often filled by government subsidies (IEA 2019b). For example, Indonesia’s
state-owned utility Perusahaan Listrik Negara (PLN) requires a government subsidy to lift operating income into
the black each year (Figure 5). This financial obligation on the government can hinder its ability to make
productive investments elsewhere in its economy, especially for COVID-19 related stimulus measures to combat
economic contraction.
When utilities are unable to meet their revenue requirement with sales under its tariff structure, one recourse is to
raise rates, which must be approved by the regulator. This can place financial strain on consumers and/or
ratepayers, particularly those of low-moderate income for whom electricity purchases take up a larger share of
total earnings. If the electricity rates of countries in the region do rise in the future as a result of utility revenue
shortfalls, this could prolong the financial burden of many households that are already paying higher energy bills
because of stay-at-home orders. Another recourse is for utilities to cut costs. This could create reliability issues in
the future as planned maintenance, capital investment, and other such expenditures are reduced or eliminated.
Some countries have made ratepayer relief a part of their pandemic response. For example, Thailand’s state-
owned Metropolitan Electricity Authority and Provincial Electricity Authority, adopted a suite of measures to
reduce the energy burden on consumers, including bill reductions of 3% across all tariff classes, bill payment
grace periods, refunding meter deposits for residential and small business users, and provision of free power to
users with power meters of no more than five amps (Bangkok Post 2020). Additionally, the Energy Regulatory
Commission of Thailand provided a temporary residential customer electricity bill reduction program that
provides a 30%-50% discount based on energy consumption. On the commercial and industrial side, Malaysia
provided for a 15% discount on electricity bills for six identified business types (hotel operators, travel and
tourism, shopping facilities, convention centers, theme parks, and local airline offices) as well as a 2% discount
for other business types and agricultural and industrial customers. Both discounts end in September (Chaturvedi
and Gaba 2020). It is unclear how these rate-payer relief measures will be funded given current utility revenue
shortfalls and constraints on public budgets.
11
This report is available at no cost from the National Renewable Energy Laboratory at www.nrel.gov/publications4.1.2 Opportunities and Recovery Responses
• Energy Efficiency Energy efficiency measures, such as cooling equipment performance standards, building
codes, and demand-side programs, can play an important part in the near-term recovery needs for power
systems and consumers across the region. As people will be spending more time at home and indoors, cooling
demand will continue to rise, placing additional stress on power systems to meet this load at the hottest part of
the day, while keeping the vulnerable population safe. Improving cooling efficiency has the potential to
reduce peak demand under normal conditions, as well as save consumers on their mounting electricity bills
during the pandemic. Over the longer
term, energy efficiency measures will
improve system reliability, enhance
integration of renewable energy, and defer
expensive system upgrades, while also
contributing to the decarbonization of the
electricity system. With customers at
home, utilities have an opportunity to
capture their attention and promote energy
efficient technologies and programs
through social media and other established
channels. Deploying efficiency measures
and demand response programs in the
commercial and industrial sector could be
undertaken as part of immediate stimulus Photo from iStock 49476251
plans, while much of the commercial
building stock sits idle.
• Utility Modernization The COVID-19 pandemic could force further reconsideration of the traditional utility
business model in the region (i.e., the regulated monopoly serving electricity from large centralized plants and
earning cost recovery plus a regulated return). The proliferation of distributed technologies (solar, storage,
electric vehicles, dispatchable load, and others) is challenging traditional utility ratemaking and customer
service practices. The pandemic and consequent economic fallout could give utilities, regulators, and
policymakers the opportunity to begin implementing measures to modernize the traditional model. Such
measures could include regulatory mandates to invest in digital infrastructure (e.g., bidirectional smart
meters) or developing new products and services to better serve ratepayers at a time when customer
empowerment and “prosuming” are growing. 4 Simple and direct measures could be undertaken now, such as
working to enable electronic bill payments (where not already common) to facilitate social distancing
measures. Over the medium-term, larger capital investments in telemetry infrastructure, supervisory, control,
data acquisition systems, and distributed energy resources could simultaneously provide grid services,
improve operations, drive customer satisfaction, and ultimately reduce costs. As the pandemic eases,
regulators and policymakers may consider adopting performance-based ratemaking regulations and other
structural incentives to incentivize utilities to accomplish such priorities, where applicable (Littell et al. 2018).
• Sector Reform: Government stimulus and economic relief responses to the pandemic have stressed national
budgets and forced reconsideration of where states have traditionally invested their resources. Countries in the
region are at different stages of market transition and sector reform. For example, Vietnam plans to launch a
wholesale electricity market by 2023, and in Thailand, a dialogue is emerging over whether the government
can continue to support a state-owned single-buyer utility in the wake of their recent expenditures (Sutabutr
2020). A movement to a modern, market-based electricity system could provide relief to state budgets over
time, but it could also benefit consumers by enabling a system for price transparency and competition. This
could also include modification of current utility tariff regimes to make them more cost-reflective.
• Subsidy Reform: Restructuring of fossil fuel subsidies could help promote efficient resource usage, improve
air quality, and level the playing field for domestic renewable energy development. Governments will have
4Prosumers are utility customers that both consume electricity and can generate their own using solar or another distributed
generation device. For more on this topic and innovative utility products and services, see Lowder, Logan, and Chen (2019).
12
This report is available at no cost from the National Renewable Energy Laboratory at www.nrel.gov/publicationsthe opportunity to revisit their fossil fuel subsidy regimes as prices for oil and natural gas fall, and public
spending is largely redirected to managing the economic fallout from the COVID-19 pandemic. Subsidy
funds could be used for price relief stimulus measures, and in the long-term redirected toward other policy
goals, such as poverty alleviation and energy access (World Bank 2020c).
4.2 Contracts and Investment
4.2.1 Impacts
In several SE Asian power sectors with vertically integrated utilities, contractual purchases of electricity from
IPPs are allowable by law. These contracts commonly take the form of PPAs that stipulate the sale of energy on a
unit of currency per unit of electricity basis (e.g., USD/MWh). These contracts can contain clauses known as
“take-or-pay” provisions, where the offtaker (the purchaser of the power) is obligated to buy all the electricity
produced by the generator, sometimes with a floor and/or a ceiling. These provisions can be beneficial to IPPs and
reduce the financial risk of their projects by making revenue streams stable and predictable (and thereby reducing
the project’s cost of energy). These protections also create a climate of project bankability which allows for higher
capital flows and lower cost of
capital; however, they can also
bind utilities to payments that
may, over the length of the
contract, exceed what the utility
could capture on the market (a
cost which ultimately is passed
on to consumers).
Indonesia’s PLN is notable in
SE Asia for its quantity of take-
or-pay and capacity payment
contractual obligations with
thermal (mostly coal)
generators; however, it is not
unique in the region. In 2015,
President Joko Widodo released
a plan to grow the country’s
generation capacity by 35 GW
by 2019 (a near doubling) to
meet the country’s expanding
Photo from Nathan Lee, NREL energy needs and electrify a
greater share of the population
(Ernst & Young Global 2014). 5 This massive capacity expansion was largely accomplished with PPA contracts
between PLN and international IPPs that have locked the utility into fixed prices for much of its purchased
electricity, leading to oversupply issues in several parts of the island nation. This oversupply is exacerbated by not
only a pipeline of planned projects for which the utility has already contracted, but also the sudden and swift
impacts of COVID-19 on demand. PLN is now in a situation where it must pay for the capacity of this generation
portfolio, even when it does not need the power from a planning reserve margin perspective (Melissa Brown
2020). Similar examples of this situation can be found in Thailand and elsewhere in SE Asia.
Indonesia may be able to restructure IPP contracts through invocation of force majeure clauses, a contractual
provision that frees parties in the agreement from liability when they are faced with an extraordinary circumstance
such as a war or an “act of God” (under which a global pandemic would likely fall) (Wiazowski and Zeyl 2020).
Meralco, an electric distribution utility in the Philippines, has invoked force majeure in several of its power
supply agreements during the country’s period of Enhanced Community Quarantine. This has reduced expenses to
the utility, savings which can be passed on in the form of discounted utility bills for consumers (MERALCO
5The year 2019 has since been pushed out to 2024–2025 as only about 10% of this target had been achieved by the second half of 2019
(Sulaiman 2019).
13
This report is available at no cost from the National Renewable Energy Laboratory at www.nrel.gov/publications2020b). Force majeure and other contractual provisions may also be invoked to delay the development of energy
projects, as well as to prevent operational must-run projects from selling unneeded electricity. In Thailand, for
example, depressed demand and increased reserve capacity resulting from the COVID-19 response, has made the
Electricity Generating Authority of Thailand consider delaying the commercial operation dates of small power
producer plants with PPAs due to existing overcapacity (Praiwan 2020). Project developers are also invoking
force majeure in instances where they cannot meet their contractual obligations (such as in the case of delays from
the inability to obtain necessary materials or social distance restrictions on construction).
4.2.2 Opportunities and Recovery Responses
The COVID-19 pandemic may meet the criteria for a force majeure event in many contracts and can thus be
invoked as a reason to adjust terms. While this can provide some relief for inflexible contract structures, such as
those in Indonesia and Thailand, buyers must exercise caution in restructuring, renegotiating, or exiting contracts
entirely. To access reasonably priced capital on the international financial markets (e.g., through issuing bonds or
equity shares), utilities must have a credit rating at or above “investment grade.” Maintaining such a credit rating
through a pandemic—especially for a utility with baseline vulnerabilities—can prove challenging, especially
when contractual fidelity can be an important consideration for ratings agencies; however, given the extraordinary
circumstances of the pandemic, some restructuring of obligations may be necessary to ensure the continued safe,
reliable, and least-cost operation of the power system. Countries should look to ensuring PPA terms in the future
that enable access to full generator flexibility, especially as more variable generation comes online.
4.3 Air Quality and Emissions
4.3.1 Impacts
Air pollution is a known risk factor for respiratory infection, and according to the Centers for Disease Control and
Infection (CDC), populations with pre-existing respiratory and heart disease are at greater risk of complications
from COVID-19 (CDC 2020). Recent research found a significant relationship between air quality and the
COVID-19 infection in China (Zhu et al. 2020). Poor air quality and its related health impacts may place much of
the population in the region at greater risk to current and future pandemic outbreaks. In the short term, lockdown
measures across many countries have shown a temporary improvement in air quality due to decreased demand in
the power sector and a reduction in transportation related fuel combustion (Sommer 2020). In Metro Manila,
enhanced community quarantine measures caused a 45% reduction in nitrogen dioxide levels as a result of both a
transportation slowdown and declining power demand (Suarez and Myllyvirta 2020). Cleaner air reduces burdens
on the health care system, reduces life expectancy inequality, and eases financial hardship on individuals,
companies, and the state, among other positive outcomes.
The International Energy Agency (IEA) predicts that this pandemic will prevent 2.6 billion metric tons of CO2
from being emitted into the atmosphere, or around 8% of annual emissions, the single largest reduction event in
history (IEA 2020a). While this is significant, these types of reductions are required year after year to keep the
global temperature increase below 1.5°C. This temporary emissions slowdown will likely return to previous levels
as economic activity rebounds.
4.3.2 Opportunities and Recovery Responses
While a temporary economic slowdown has reduced pollution, reopening is beginning to bring pollution levels
back up to pre-lockdown levels. Policymakers and regulators can act to preserve pollution reduction by linking
clean energy deployment and air quality improvements through future policies and regulations. They also have an
opportunity to capture support for these measures as the public is quickly seeing the benefits of reduced pollution
in their everyday lives. Additionally, as governments consider longer-term stimulus measures, beyond immediate
economic response, they can tie together renewables, efficiency, air quality and alternative transportation, fossil
fuel regulations, and economic goals into a national strategic priority, and set the stage for cross-cutting policies
that can achieve co-benefits goals in each of these three areas.
14
This report is available at no cost from the National Renewable Energy Laboratory at www.nrel.gov/publicationsYou can also read