COVID-19's Rapidly Changing Impact on Asia Pacific Electricity Markets - A Webinar for IAEE Mike Thomas, 5 June 2020
←
→
Page content transcription
If your browser does not render page correctly, please read the page content below

A Webinar for IAEE

COVID-19’s Rapidly Changing Impact on Asia Pacific Electricity Markets

Mike Thomas, 5 June 2020
mthomas@lantaugroup.com

Disclaimer and Credits   This presentation has been prepared to facilitate general
                               discussion and not for support of any commercial or
                                                business decision.

                              Special thanks to the entire team at The Lantau Group,
                              particularly: Stefan Robertsson, Xiaoran Liu, Miaosu Li,
                               and Liyuan Zhao. Additional support was provided by
                                Bobby Ditric, Paul Buckland, Chris Starling, Zander
                             Bischof, David Fishman, Soyeon Park, Jan Stempien, JP
                               Stovall, Ian Yao, Schuyler Kapnick, Sovathana Kem,
                                             Anna Leung, and Oscar Ng.

                                         Hong Kong | Singapore | Seoul | Perth
                                          (and Shanghai via Nicobar Group)

1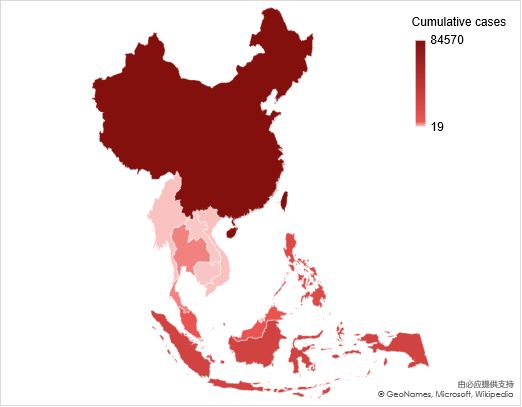
Agenda

1. Executive Summary
2. Overview of Singapore Electricity Market
          About The Lantau Group
3. Key Market Drivers

4. Modelling Results
        Headline Impacts

5. Appendix
          Other Points

          Summary
Decades of experience in commercial and regulatory matters across the globe
Our focus and orientation
Washington DC
London
Languages:
Paris
Arabic*
Bahasa Indonesia
Bahasa Malaysia
Markets & Industry Economic Client Bengali
Impact
Transactions Insights Regulation Service Cantonese
English
We focus on We focus on We advise on We apply Our senior French
what can be what matters key projects economics and team members German
measured and to energy throughout the analysis to are actively Hindi
substantiated. stakeholders
facing changes
Asia Pacific
region and the
address
challenges
involved in the
execution of
ASIA Japanese
Khmer
We provide
objective,
in markets, rest of the facing mandates and PACIFIC Korean
technologies, world. regulators, assignments. Malayalam
independent,
regulations, commercial Mandarin
well-grounded and policies. We influence stakeholders, We own our Russian
advice for the evolution and policy company, so Serbian
decision- This is what of the energy makers. when we say Spanish
makers facing we do. sector through we are Swedish
high stakes our work and dedicated to
Tagalog
choices. expertise. our clients we Tamil
mean it. Key: Telugu&
Office Thai*
Affiliate/Senior Advisor Vietnamese*
Network Partners
*Senior Advisors
Economic, commercial, and strategy advisory for energy sector stakeholders throughout the region
3
3We draw from a diverse range of experience and expertise
Vietnam Thailand Uzbekistan Mainland China
Extensive due diligence support for new RE and Demand response pricing CNG vehicle market Curtailment study in Gansu, Jilin and West Inner Mongolia
traditional power supply resources across the evaluation
Grid solar evaluation Multiple studies on small-hydro power investment opportunity
country
Gas to power economics Coal-fired power generation and carbon policy in Zhejiang
LNG market entry studies
Market development Singapore Coal-fired power investment opportunity in Chongqing
Market modelling / development
Renewable energy Assessment of gas-fired CHP opportunities in Guangdong
Market design and regulatory
support Strategic assessment of opportunities in multiple provinces
Malaysia
Demand forecasting Green procurement options / end user market support
MESI 2.0 reforms
Commercial transactions
PPA (Green and Other)
Tariff benchmarking
Electricity/gas markets Korea
Corporate PPA support
Tariff benchmarking
LNG and gas strategy Renewable energy study for solar and wind
Third party access
Due diligence on CCGT and renewable power plants
Disputes / expert witness
Demand forecasting
Capacity/ancillary market design and evaluation
Capacity market
Commercial transactions
SMP/REC modelling and implications to IPP business
Disputes / expert witness
Gas and coal IPP opportunities
Taiwan LNG/Coal competitive procurement
Philippines
Offshore wind
Market design and development
Transaction support
Due diligence support Oman India
Corporate energy pricing
Business strategy Performance regulation Wholesale market
Market development modelling
Natural Gas Masterplan and LNG entry strategy Direct sales and corporate PPAs
Fuel switching
Distribution sector structure and regulation Market readiness and scarcity pricing
Power price forecasting
Australia Retail competition
End user pricing/invoice
tracking
Capacity market design
Indonesia Contract disputes / expert witness
Gas to power (small and large scale)
Market design and policy / reviews New Zealand
Evaluation of market entry opportunities Corporate green procurement Market development / regulation / pricing
Demand response Retail sector development
Market development
Market modelling / transaction support Gas pipeline access policy
Japan Market design and regulation Market trading and market making
Customer Solar Entry Strategy Network regulation and cost recovery Disputes / expert witness
End user pricing of gas and electricity StorageFounders, Partners, Directors
Mike Thomas Dave Carlson Stefan Robertsson
Managing Director Director Partner
mthomas@lantaugroup.com dcarlson@lantaugroup.com srobertsson@lantaugroup.com
Mike is an expert in energy markets and regulation with experience Dave is an experienced energy market operator, designer and change Stefan has over 20 years of experience in business development, M&A,
throughout the Asia Pacific region. He works with stakeholders on manager with a track record spanning Asia, Africa, Australia and New and corporate and project finance across the Asia Pacific region. Prior
matters involving regulation and market design; market evaluation; Zealand. Most recently he was a Senior Business Development to joining TLG, he spent nearly 10 years with CLP Group, where he
strategy; and commercial and regulatory disputes. He has advised Director at SGX, responsible for new initiatives in the gas and power served as head of Corporate Finance and Development for non-Hong
buyers and sellers on over 50 GW of commercial transactions and sectors. Prior to that he served for 10 years as the COO and CEO of Kong activities. He led the CLP Group Investment Committee and
associated market and business strategies. And, he has advised the Energy Market Company, EMC, the national electricity market Chaired the TruEnergy Risk Committee for CLP's Australian trading and
governments, regulators, and other stakeholders on numerous major operator for Singapore. Dave has served on and chaired many business activities. He also had significant involvement in CLP's
market and regulatory reviews and disputes. Prior to co-founding TLG, industry and governance panels to further liberalise energy markets investment activities in Mainland China, India, and South East Asia,
he was the Asia Pacific energy and environment practice leader for a including market rules covering such topics as market rules evolution, covering the full spectrum of energy assets and opportunities. Prior to
global consultancy. Mike has an MPP from Harvard Kennedy School the implementation of retail contestability, developing gas trading and CLP Stefan was with various ABB Financial Services companies in the
and a BA in economics from Carleton College. introducing electricity derivative products. US, UK, and Asia. He earned his degree in Financial Economics at the
Stockholm School of Economics.
Middle Central East
James Ooi David Kim
East Asia Asia
Partner Partner
jooi@lantaugroup.com dkim@lantaugroup.com
South SE
James Ooi has over 20 years of experience in the energy industry. He
Pacific David is a partner and director of TLG, based in Seoul, where he works
Asia Asia
is an expert in areas related to energy market design, asset valuation, with both inbound and outbound clients interested in investments in the
commercial contracting for gas and power (LNG SPA, GSA and PPAs), energy sector. He particularly focusses on new energy opportunities
corporate strategy, planning and operations, with experience across throughout the region, helping to connect Korean and global companies
Asia Pacific, the Middle East and North Africa. Prior to joining TLG, into new markets and to help other companies evaluate opportunities in
James headed the Gas & Power practice for a global consulting firm in Korea. Prior to joining TLG, Dr Kim was the Managing Director at
Asia. In addition to consulting, James brings deep operational Hanwha Energy’s Energy Solution System Division. Previously, David
experience and has held management leadership positions at major was a Partner at A.T. Kearney and a Principal at the Boston Consulting
generators and power utilities in the region. James is based in Group for over ten years. David holds a PhD in Mechanical Engineering
Singapore. James holds an MSc and BEng in Electrical Engineering from Massachusetts Institute of Technology. David is fluent in Korean
from the UK and is fluent in English, Mandarin, Cantonese and Bahasa and English.
(Malaysia and Indonesia).
5Agenda
1. Executive Summary
2. Overview of Singapore Electricity Market
About The Lantau Group
3. Key Market Drivers
4. Modelling Results
Headline Impacts
5. Appendix
Other Points
Summary
6Confirmed Cases in the Asia Pacific Region (as of May 31)
Cumulative Confirmed Cases
Mainland
ASEAN (as of May 31) China,
China
countries, 84570
Taiwan
80000
35000 Singapore
34366
5000
70000
30000
Indonesia
26473
60000
China
25000 84570
50000
Philippines
20000 18096 Taiwan
442
40000 Myanmar
224 Lao
19
15000
30000 Thailand Vietnam
Malaysia 3081 328
Philippine, 18096
Cambodia
10000 7762 125
Taiwan, 442
20000
Vietnam, 328 Thailand
Myanmar, 224 3081
5000 Brunei, 141 Brunei
10000 Malaysia
Cambodia, 125 7762 141
Lao, 19
Singapore
34366 Indonesia
0 0 26473
Ma y 04
Ma y 09
Ma y 14
Ma y 19
Ma y 24
Ma y 29
Apr 04
Apr 09
Apr 14
Apr 19
Apr 24
Apr 29
Feb 4
Feb 9
Feb 14
Feb 19
Feb 24
Feb 29
Ma r 05
Ma r 10
Ma r 15
Ma r 20
Ma r 25
Ma r 30
Jan 25
Jan 30
7
Source: WHO; Taiwan CDCAsia Pacific countries continue to be well below global mean for mortality
• COVID-19 mortality in Asia Pacific, thankfully, has been extremely low given population size and
density
Country/Region Deaths Cases Deaths per 1M % Death
population per Case
Philippines 960 18,638 9 5.15%
Japan 891 16,851 7 5.29%
Indonesia 1,641 26,940 6 6.09%
Korea 271 11,503 5 2.36%
Singapore 23 35,292 4 0.07%
New Zealand 22 1,504 4 1.46%
Australia 103 7,204 4 1.43%
Malaysia 115 7,857 4 1.46%
Mainland China 4,634 83,017 3 5.58%
Hong Kong 4 1,088 0.5 0.37%
Taiwan 7 443 0.3 1.58%
Vietnam 0 328 0 0.00%
• World deaths per 1M = 48
Data circa 1 June 2020 (https://www.worldometers.info/coronavirus/)
8Demographic differences
100%
90%
80%
70%
60%
50%
40%
30%
20%
10%
0%
Hong Kong Australia/New USA South Korea Thailand China Singapore Viet Nam Ma laysia Philippines
SAR Zealand
Under 50 Between Over 70
Older Younger
9
Source: United Nations, Department of Economic and Social Affairs, Population Division (2019). World Population Prospects 2019, Online Edition. Rev. 1.About The Lantau Group
Headline Impacts Impact on Demand
Other Points
Summary
10Hubei’s power consumption chronicles the evolution of the COVID-19 situation,
incorporating both lockdown effects and the beginning of a recovery profile
Hubei Province, China
Daily Power Consumption on Hubei Provincial Grid System
800 Jan 23
Hubei/Wuhan
Mar 16-25
movement control order Feb 18
700 Ratio of workers resume
in effective Peak existing confirmed Apr 8
work in large institutions
cases in Hubei (50,633) Exit Wuhan control
in Hubei raises from
eased
600 22-68%
Jan 20
500 Chinese
government
confirmed
GWh
400 human-to-
human
transmission
300 of coronavirus
Feb 12
Mar 25
Peak daily new deaths
200 Exit Hubei (except
in Hubei (242)
Wuhan) control eased
2020 Lunar
100 New Year
2019
Lunar
Holiday
New Year 2020 2019
Holiday
0
1-Jan 8-Jan 15-Jan 22-Jan 29-Jan 5-Feb 12-Feb 19-Feb 26-Feb 4-Ma r 11-Mar 18-Mar 25-Mar 1-Apr 8-Apr 15-Apr 22-Apr 29-Apr 6-Ma y 13-May
Weekly change in daily demand in 2020 (vs. 2019)
0%
-7% -8% -6% -5% -1% -2%
-24% -17% -16%
-36% -27%
-41% -46% -45% -39%
5 6 7 8 9 10 11 12 13 14 15 16 17 18 19 20
Week No.
11
Source: Hubei Statistics, Hubei DRC, DXY.cn; TLG Analysis
* Note: % difference data only available after the week commencing 27 Jan 2020.Policies aimed to contain COVID-19 in Asian Pacific countries (1 of 2)
More Region Steps Taken
Strict
• Home quarantine – exit/entry of neighborhoods regulated and closely monitored; businesses and public services, except for those serving basic living
needs, shut down; all gatherings prohibited. Violation could result in fine and/or imprisonment.
Mainland • City lockdowns – Wuhan city shut down on Jan. 23rd; other cities in Hubei Province and all over the country followed soon; inter/intra-provincial
China transportation strictly controlled.
• Border restrictions – border closed to common foreign passport holders on March 28th
• Current Status – all restrictions, except for border restriction, greatly eased/removed as of first week of May.
• Quarantine Orders – legal order issued to travelers and citizens suspected of carrying COVID-19 infection in March;
• Partial lockdown (“circuit breaker”) across the country – 85% of workplaces shutdown, with only most essential services remaining open.
Singapore
• Border restrictions – border closed to foreign visitors on March 15th
• Current status– partial lockdown recently eased (1 June); border control still in effect
New Zealand:
• Lockdown – nationwide lockdown in effect on March 26th ; businesses & schools closed, public gathering prohibited
• Home quarantine – people are required to stay at home except for absolutely necessary reasons
• Border restriction – border closed to foreigners on March 19th
New Zealand • Phased relaxation starting on May 14th
& Australia
Australia:
• Lockdown in place for two months, policies vary in different states, in most states social gathering with more than 2/10 people is not allowed; people
are required to stay at home and minimize outings, very recent easing
• Border closed to all foreigners on March 19th; policy eased on April 7th; Australian nationals not allowed to travel abroad with few exemptions
Malaysia:
• Movement control order (MCO) in place on March 18th -- closure of all government and private premises except those for essential services; prohibition
of mass gatherings; Border closed to foreigners; MCO eased on May 4th
Philippines:
Philippines,
• Partial lockdown – strict lockdown in Luzon, lockdown in certain regions/municipalities in Visayas; border closed to all foreigners; border restriction still
Malaysia
in place
& Thailand
• Metro Manila lockdown ended on Monday, June 01
Thailand:
…
• Lockdown – Partial lockdown in Bangkok since Mar. 21st; nationwide lockdown since Apr. 20th; State of emergency on Mar. 9th, curfew in place
• Border closed on April 4th
[continued…]
12Policies aimed to contain COVID-19 in Asian Pacific countries (2 of 2)
Region Steps Taken
Korea:
• No lockdown/quarantine ordered – restriction on personal activities is advised but not enforced; the Enhanced Social Distancing
…
campaign from 22 March to 19 April advising limited operation of high-risk facilities, businesses and sectors; relaxed form of social
distancing from 20 April to 5 May; transition to ‘Distancing in Daily Life’ form 6 May
Korea & • Border restrictions – entry ban to travellers from selective countries/areas with severe outbreaks, i.e. Japan, Hubei Province, China, etc.;
Taiwan all incoming Koreans and foreign nationals are subject to 14-day quarantine
Taiwan:
• Early and aggressive track, trace
• No lockdown – some businesses suspended, public gatherings restricted
• Border restriction – border closed to foreigners on March 19th
Vietnam:
• Movement control from April 1st – 22nd ; more than 30,000 business shut down
• Border restrictions – flights from China suspended on Feb. 1st, international flights on Mar. 25th , visas stopped
Less Oher
• Status quo – movement control lifted, businesses reopening
Strict ASEAN
Cambodia:
Countries
• No lockdown – state of emergency declared; New Year (Sangkran, Festival in Mid April, 2020) cancelled; some public/private zones are
closed (gyms, nightlife areas, etc)
• Border restrictions – suspending foreign visas; entry ban on selective countries with severe outbreaks, i.e. U.S., EU, Thailand, Vietnam
13Peninsular Malaysia (example): COVID-19 Impact
Number of active cases, deaths, and recoveries No. of COVID tests: 519,944 (15,391 tests per 1M population)
9,000
Pre-MCO MCO 1 MCO 2 MCO 3 MCO 4 CMCO 5 Movement Control Order (MCO) Phases
8,000
6,941 7,629
7,000 6,535 March 18 April 15 May 12*
5,851
6,000 5,305
5,000 4,119
1 2 3 4 5
4,000
2,470 April 1 April 29
3,000
2,000 1. Prohibition of mass gatherings including religious, sports,
900 social and cultural activities. All houses of worship and
1,000 25 117
22 business premises would be closed, except for supermarkets,
0
public markets, grocery stores and convenience stores.
23 y
ay
22 b
29 b
eb
14 r
21 r
28 r
ar
y
16 y
11 r
18 r
25 r
pr
2. Closure of all government and private premises except those
a
a
Ap
p
p
Ma
a
e
e
Ma
Ma
-A
-A
-A
-M
-M
-M
-M
-M
-F
-F
-F
4-
7-
2-
9-
15
involved in essential services (water, electricity, energy,
Active Case Death Recovery telecommunications, postal, transportation, irrigation, oil, gas,
fuel, lubricants, broadcasting, finance, banking, health,
Total number of cases per 1M population pharmacy, fire, prison, port, airport, safety, defence, cleaning,
Selangor: 274 retail and food supply)
3. Closure of all kindergartens, government and private schools,
Kuala Lumpur: 1,042 public and private higher education institutions, and skills
training institutes nationwide
Putrajaya: 983
4. Sanctions covering all Malaysians travelling abroad. Those
Negeri Sembilan: 682 who have returned from overseas would be required to
undergo a health check and a 14-day quarantine.
5. Restrictions on the entry of all tourists and foreign visitors into
the country
Note: *Phase 5, a conditional movement control order (CMCO), is a relaxation
Melaka: 225 40 500 1000
of MCO regulations, which allows operations of major economic sectors..
14
Source: Worldometer (29 May), Department of Statistics Malaysia, Ministry of International Trade and IndustryLockdown measures were clearly the immediate cause of reduced demand
17 March 2020 Philippines 18 March 2020 Malaysia
Enhanced Community Quarantine Movement Control Order
250 500
▼12.2 % ▼ 16.0 %
200 400
150 300
GWhs
GWhs
100 200
50 100
- -
16-Mar 17-Mar 18-Mar 19-Mar 20-Mar 21-Mar 22-Mar 16-Mar 17-Mar 18-Mar 19-Mar 20-Mar 21-Mar 22-Mar
1 April 2020 Vietnam 7 April 2020 Singapore
“Soft Lockdown Measures” Circuit breaker measures
800 200
▼ 6.8 %
▼6.2 %
600 150
GWhs
GWhs
400 100
200 50
- -
30-Mar 31-Mar 1-Apr 2-Apr 3-Apr 4-Apr 5-Apr 6-Apr 7-Apr 8-Apr 9-Apr 10-Apr 11-Apr 12-Apr
In the charts above we highlight the day to day drop in reported GWhs between the day before lockdown and the day of lockdown. However, for Vietnam and Singapore the impact was slightly delayed.
• For Singapore we measure the day to day drop based on 8 Apr (day after lockdown, and day when schools closed)
• For Vietnam we measure the day to day drop based on 3 Apr (2 days after lockdown as 2 Apr was a public holiday)
15
Source: PEMC; GSO; NLDC EVN; EMC; TLG AnalysisLockdown measures were clearly the immediate cause of reduced demand (2)
25 March 2020 New Zealand 25 March 2020 Australia
Lockdown “Stage two restrictions"
150 600
▼3.0 %
▼12.5 %
100 400
GWhs
GWhs
50 200
- -
23-Mar 24-Mar 25-Mar 26-Mar 27-Mar 28-Mar 29-Mar 23-Mar 24-Mar 25-Mar 26-Mar 27-Mar 28-Mar 29-Mar
Comparison with the 3 preceding weeks Comparison with the 3 preceding weeks
New Zealand Australia NEM
110 600
100
Lo
GWhs
GWhs
ck
do 500
wn
we
90 ek Lockdown week
80
400
Mo nday Tuesday We dnesday Thursday Frid ay Saturday Sunday
Mo nday Tuesday We dnesday Thursday Frid ay Saturday Sunday
We ek 10 (2 Mar - 8 Mar) We ek 11 (9 Mar - 15 Mar)
We ek 10 (2 Mar - 8 Mar) We ek 11 (9 Mar - 15 Mar)
We ek 12 (16 Mar - 22 Mar) We ek 13 (23 Mar - 29 Mar)
We ek 12 (16 Mar - 22 Mar) We ek 13 (23 Mar - 29 Mar)
16
Source: EA; AEMO; TLG AnalysisThe initial impact of lockdowns was then typically followed by further
consumption declines in weeks to follow
Daily Electricity “Demand” (March and April)
800
700 Average Daily “Demand”
% change Week before Week after
Daily electricity “demand” (GWh)
600 Lockdown Lockdown
▼ 7.8 % 680 GWh 627 GWh
500
400
300
▼ 29.2 % 380 GWh 269 GWh
200 ▼ 25.5 % 257 GWh 192 GWh
▼ 6.5 % 145 GWh 136 GWh
100
▼ 12.4 % 101 GWh 88 GWh
-
r r ar ar ar Ap
r pr pr pr
- Ma - Ma -M -M -M 6- 3-A 0-A 7-A
2 9 16 23 30 1 2 2
March 17 March 18 March 25 April 1 April 7
Philippines Malaysia New Zealand Vietnam Singapore
Lockdown start date
Vietnam Peninsular Malaysia Philippines (Luzon and Visayas) Singapore New Zealand
17
Source: PEMC; GSO; NLDC EVN; EMC; EA; TLG AnalysisDiversity of impacts and staging across Asia Pacific to end March
Change in March Electricity “Demand”
Average Daily Electricity “Demand”
February & March - 2019 & 2020 Y-o-Y M-o-M
Mar 2020 vs Mar 2019 Mar 2020 vs Feb 2020
.
Peninsu
Philippi Australi Malaysi
Malaysia February
Pe
n in su la
r Ma
l a
y sia
-10.0% Pe
n in su la
r Ma
l a
y sia
-8.3%
lar
a
(Peninsular) March
nes a - NEM
Australia February Au
s tra lia - N E
M
-6.6% Au
s tra lia - N E
M
-7.0%
(NEM) March
February -5.2% -1.0%
Philippines
Ph
il ip in e
s Ph
il ip in e
s
March
(Luzon and Visayas)
China
February -4.2% 16.8%
China
Ch
in a Ch
in a
March
re Zealand Korea
Singapo New South
South February
March
So
u th K o
re a
-4.0%
So
u th K o
re a
-7.6%
Korea
February
New March Ne
wZ e
a la n
d
-1.9%
Ne
wZ e
a la n
d
-4.2%
Zealand
February
March 2.4%
S in
g a p
o re
1.3%
Singapore
S in
g a p
o re
Vietnam Taiwan
February
Taiwan March Ta
iw a n
2.6%
Ta
iw a n
2.0%
Vietnam February
March 4.8%
3.0%
V ie
t n
a m
V ie
t n
a m
All countries 0 500 1,000 1,500 2,000
except China
0 5,000 10,000 15,000 20,000 February 2019 February 2020
China
March 2019 March 2020
Average Daily “Demand” (GWh)
18
Source: GSO; AEMO; PEMC; NEA; KPX; EA; EMC; MOEA BOE; Taipower Statistics; NLDC EVN; TLG AnalysisIt then just got worse (April)
Change in April Electricity “Demand”
Average Daily Electricity “Demand”
March & April - 2019 & 2020 Y-o-Y M-o-M
April 2020 vs April 2019 Apr 2020 vs Mar 2020
March
Philippine Malays
Penins
Malaysia -22.5%
ular
April -13.0%
Pe
n in su la
r Ma
l a
y sia
ia
Pe
n in su la
r Ma
l a
y sia
(Peninsular)
Philippines March
-19.8%
s
(Luzon and Visayas) April
Ph
il ip in e
s Ph
il ip in e
s
-10.8%
China
March
China April Ch
in a
0.7% Ch
in a
4.8%
Zealand
March
Singapor New
New Zealand April Ne
wZ e
a la n
d
-9.5% Ne
wZ e
a la n
d
-6.9%
March
Singapore
e
April S in
g a p
o re
-6.0%
S in
g a p
o re
-6.2%
Vietnam
Vietnam March
April V ie
t n
a m
-8.8%
V ie
t n
a m
-7.6%
Korea
South
South March
Korea April So
u th K o
re a
-6.5%
So
u th K o
re a
-6.4%
Taiwan
March
Taiwan April -2.2%
-3.4%
Ta
iw a n
Ta
iw a n
All countries
except China 0 500 1,000 1,500 2,000
China
March 2019 March 2020
0 5,000 10,000 15,000 20,000
April 2019 April 2020
Average Daily “Demand” (GWh)
19
Source: GSO; PEMC; EA; EMC; NLDC EVN; KPX; MOEA BOE; Taipower Statistics; TLG AnalysisWith more movement or adaptation, some reversion/recovery is evident
Change in May Electricity “Demand”
Average Daily Electricity “Demand”
April & May - 2019 & 2020 Y-o-Y M-o-M
May 2020 vs May 2019 May 2020 vs April2020
April
Philippines Malaysia
Peninsul
Malaysia May -11.1%
14%
ar
Pe
n in su la
r Ma
l a
y sia
(Peninsular)
Pe
n in su la
r Ma
l a
y sia
Philippines April
(Luzon and Visayas) May -13.8% Ph
il ip in e
s
Ph
il ip in e
s
13%
Singapore
April
Singapore May -8.3% -1%
S in
g a p
o re
S in
g a p
o re
Vietnam
April
Vietnam May V ie
t n
a m
1.8% V ie
t n
a m
13%
South Korea
April
South Korea May So
u th K o
re a
-0.8% So
u th K o
re a
-8%
Taiwan
April
Taiwan
May Ta
iw a n
19.8% Ta
iw a n
16%
0 400 800 1,200 1,600
April 2019 April 2020
Average Daily “Demand” (GWh)
May 2019 May 2020
20
Note: South Korea data is as of May 10th ,2020 Source: GSO; PEMC; EA; EMC; NLDC EVN; KPX; MOEA BOE; Taipower Statistics; TLG AnalysisImpact on Electricity Demand Level and Profile – Peninsular Malaysia
Daily Consumption Before and After MCO
• Movement Control Order (MCO) resulted in a 16% drop in daily GWh
450
consumption on March 18, 2020
400
• The daily consumption has experienced a slight recovery after
350
the conditional movement control order (CMCO) was
300
implemented within MCO phase 4 on May 4, 2020
250
• Total consumption in April 2020 decreased by 22.5%, compared
200
to that of the same month in the previous year March 18, 2020 May 4, 2020
150
• Peak demand in April shifted from daytime (8am – 7pm) to MCO in effect CMCO of phase 4
100 in effect
night-time (7pm – 1am)
50
0
Monthly Consumption 2019 vs 2020
TWh
0
0
0
0
0
0
0
0
0
0
02
02
02
02
02
02
02
02
02
02
12 -9.99% -22.50%
-2
-2
-2
-2
-0.79% 6.85%
-2
-2
-2
-2
-2
-2
ay
an
an
an
eb
ar
ar
ar
pr
pr
-A
-A
-M
-M
-M
-M
-J
-J
-J
-F
11.4
15
30
01
16
31
15
01
16
31
15
10 11.0 10.9 11.1
10.4 10.2
9.8 Shift in Diurnal Demand Profile (Evening Peak)
100%
8 8.6
95%
6
Load Factor
90%
4 85%
80%
2
75%
0 70%
2019 2020 2019 2020 2019 2020 2019 2020 1 2 3 4 5 6 7 8 9 10 11 12 13 14 15 16 17 18 19 20 21 22 23 24
Jan Feb Mar Apr Hour
Apr 2020 (Post-MCO) Feb 2020 (Pre-MCO)
Before Movement Control After Movement Control
21 Apr 2019 (Pre-MCO)
Source: GSOWith Covid-19 still under control Taiwan maintains a mostly upbeat outlook
Taiwan has managed to contain the outbreak (442 confirmed cases and 7 deaths as of 31 May) without a
lockdown seen elsewhere. Taiwan’s economy is heavily reliant on exports (70% of GDP). Major export partners
includes Mainland China and HK (40%), ASEAN (18%), USA (12%), Europe (9%) and Japan (7%). In March 2020,
exports dropped to Europe, USA, and Japan but increased to Mainland and HK.
Daily New Cases (as of May 31) Taiwan 2020 GDP forecast
30
1.7% Taiwan government (28 May)
25
-1.32% IHS Markit (May)
20
0.5% S&P (4 May)
15
1.6% TIER (24 Apr)
Taiwan Institute of Economic Research
10
1.0% CIER (17 Apr)
Chung-Hua Institution Economic Research
5 -4% IMF (14 Apr)
0 1.80% ADB (3 Apr)
Ma y 04
Ma y 08
Ma y 12
Ma y 16
Ma y 20
Ma y 24
Ma y 28
Apr 02
Apr 06
Apr 10
Apr 14
Apr 18
Apr 22
Apr 26
Apr 30
Feb 2
Feb 6
Feb 10
Feb 14
Feb 18
Feb 22
Feb 26
Ma r 01
Ma r 05
Ma r 09
Ma r 13
Ma r 17
Ma r 21
Ma r 25
Ma r 29
Jan 21
Jan 25
Jan 29
-5% -4% -3% -2% -1% 0% 1% 2% 3%
Source: S&P, IMF, IHS Markit, ADB, TIER, CIER, Directorate General of Budget, Accounting and Statistics
Source: Taiwan CDC
22Taiwan’s electricity demand in April dropped due mainly due to slowing global
growth and lower temperature
Average Daily Demand by Week (Jan - May) Peak Daily Demand (Jan - May)
800 35% 800 30%
700 2020 Chinese New Year 30%
700 25%
25%
600 600 20%
20%
% changes
500 15%
% changes
500
GWh
15%
GWh
400 10% 10%
400
2019 Chinese New Year 5% 5%
300 300
0% 0%
200 200
-5% -5%
100 -10% 100 -10%
- -15% - -15%
1 2 3 4 5 6 7 8 9 10 11 12 13 14 15 16 17 18 19 20 21 22 1 2 3 4 5 6 7 8 9 10 11 12 13 14 15 16 17 18 19 20 21 22
Week No. Week No.
% 2020 2019 % 2020 2019
Average Daily Demand by Month
700 30%
600 25%
20%
500
15%
% changes
GWh
400 10%
1.9% 2.9% 5%
300 1.4%
0%
200
-5%
-3.4%
100 -10%
- -15%
Jan & Feb Ma rch April Ma y
Week No.
23
% Change 2020 2019 Source:TaipowerNever forget to check the temperature….
Taipei temperature comparison (Jan - May)
35
30
25
20
15
10 Jan Feb Mar Apr May
2019/2020
5 -3.2% -1.1% 4.7% -13.6% 7.7%
YoY
0
Ma y
Ma y
Ma y
Ma y
Ma y
Ma y
Ma y
Ma y
Ma y
Ma y
Ma y
Feb
Feb
Feb
Feb
Feb
Feb
Feb
Feb
Feb
Ma r
Ma r
Ma r
Ma r
Ma r
Ma r
Ma r
Ma r
Ma r
Ma r
Jan
Jan
Jan
Jan
Jan
Jan
Jan
Jan
Jan
Jan
Jan
Apr
Apr
Apr
Apr
Apr
Apr
Apr
Apr
Apr
Apr
2019 2020
35
Taipei temperature comparison - April 35 Taipei temperature comparison - May
30 30
25 25
20 20
15 15
10 10
5 5
0 0
1 2 3 4 5 6 7 8 9 10 11 12 13 14 15 16 17 18 19 20 21 22 23 24 25 26 27 28 29 30 1 2 3 4 5 6 7 8 9 10111213141516171819202122232425262728293031
24 2019 2020 2019 2020
Source:Taiwan Central Weather BureauPhilippine experience highlights temperature in a different way…lockdown has
occurred during an exceptional heat wave recovering some of the lost demand
MW Luzon MW Visayas
12,000
2,200
11,000
2,000
10,000 2017
2017 1,800
9,000
Nearly 50 degrees C 1,600 July 2017
earthquake
~20% fall in Luzon (extreme heat wave) in Leyte
8,000 peak demand vs.
preceding weeks
1,400 Limited impact
7,000 1,200
6,000 1,000
More resilient offpeak demand in Visayas relative to
Unlike Visayas, offpeak demand in Luzon, likely reflecting a lower concentration of industrial
the main economic region of Luzon demand – we note, however, that quarantine measures
5,000 has also suffered a sharp decline 800 were implemented later in Visayas compared to Luzon
4,000 600
3,000 400
k.1 k.5 k.9 k.1
3
k.1
7
k.2
1
k.2
5
k.2
9
k.3
3
k.3
7
k.4
1
k.4
5
k.4
9 k.1 k.5 k.9 k.1
3
k.1
7
k.2
1
k.2
5
k.2
9
k.3
3
k.3
7
k.4
1
k.4
5
k.4
9
W W W W W W W W W W W W W W W W W W W W W W W W W W
2017 Min 2017 Max 2018 Min 2018 Max 2017 Min 2017 Max 2018 Min 2018 Max
2019 Min (YTD) 2019 Max (YTD) 2020 Min (YTD) 2020 Max (YTD) 2019 Min (YTD) 2019 Max (YTD) 2020 Min (YTD) 2020 Max (YTD)
25 Note: Years have been rebased to show Week 1 commencing from the first Monday of each year; demand figures are ex-post
Source: PEMC; TLG analysisSummary points
• Covid-19 incidence rates are still not under control across all countries, but the mortality story is
distinctively encouraging and population age demographics are favourable
• Lockdowns had by far the largest impact on demand (of course)
• Several countries are showing demand recovery, even modest growth, on a year-over-year
basis as Covid progresses and movement restrictions ease
– Mainland China’s recovery continues to show strength
– Many Asian countries are still poised get back onto a growth track, even if the rate is less than it was
– The impact of the rest-of-world economic demise is not yet clear
• In teasing out key factors, just note that February through May has highly variable weather
– Normally the peak period for markets like the Philippines
– Residential bill shock in the Philippines, for example, will be much greater
– Temperature effects also present in the data
• Because growth is already part of many (not all) Asian’ electricity systems, adaptation to a lower
rate of growth will often lead to new project deferral, restoring fundamentals sooner
26About The Lantau Group
Headline Impacts Impact on Fuel Markets
Other Points
Summary
27Fuel market “stories” are always easiest in retrospect
Dated Brent Price Outlook (Real) Year
In US$/bbl Dated
120 over
Brent
2017-2018 Year
Higher-than-expected 2014 99.0
100 production management;
sharp collapse in 2015 52.4 -47%
Venezuelan output;
2019
2016 43.7 -17%
US sanction expectations on Price declined 9% y-o-y to
US$/bbl (real terms 2020)
80 Iran; Geopolitical risks $64/bbl in 2019 amidst escalated 2017 54.4 24%
US-China trade tensions and
weaker global oil demand 2018 71.0 31%
2019 64.3 -9%
60
?
2020 39.7 -38%
2021 41.6 5%
40
2014-2016 2022 44.7 7%
Oversupply (driven by surge in US
20
output); weak demand; Saudi
policy to keep market share
2020 Recent events have
Covid-19 and Saudi/Russia been dramatic, but
we’ve seen similar year-
0 over-year changes in
2010 2011 2012 2013 2014 2015 2016 2017 2018 2019 2020 2021 2022 2023
the past
28 Notes: Forecast prices in 2020US$/bbl; 2010-2019 are actuals, forecast thereafter
Source: ICE, Based on latest market forward curves for the front 2 yearsKorea’s cost-based electricity pool market is a useful “lens” into the impact of
the most recent (short-term) fuel market disruption
Snapshot of Short Run Cost-Based Merit Order in Q3 2020 at Different Oil Prices
160
140
Price
Prices($/MWh)
at oil price $65/bbl in H1 2020 (prior expectation)
120 Prices
Price at oil price ~$52/bbl in Q1 2020 / ~$23/bbl in Q2 2020
($/MWh) Oil
100
Price ($/MWh)
80 LNG
60
Coal
40
Coal and LNG
20
Renewables Nuclear ILLUSTRATIVE
0
0 10,000 20,000 30,000 40,000 50,000 60,000 70,000 80,000 90,000 100,000
Cumulative Quantity (MW)
• The chart compares typical merit order of the Korea wholesale power market – stacking renewables, nuclear, coal, LNG and oil in the order –
against the expected merit order for Q3 2020 based on outturn oil prices since Q1 2020.
• Typically, there are occasions where SRMC of high coal units coincides with low-priced LNG-based units, SRMC of LNG generation mostly sit
after coal. And, LNG often sets SMP (more than 85% of the time).
• In 2020, the impact of oil price drop in Q1 2020 on SMP is expected to be realised in Q3 2020. Associated price drop in oil-linked gas volume
would make many of LNG-using power plants competitive against coal unit, resulting in reversal of coal and gas in the merit order. (This would
be highly dependent on plant efficiencies of coal and gas power units). Accordingly, SMP currently hovering 75-85 KRW/kWh is forecast to
drop to 40-50 KRW/kWh level.
29
Note: The supply curve is a snapshot of a particular timeslot of Q3 2020, on the basis of TLG assumptions around availability of each power plant.
Source: TLG AnalysisThe outlook for oil prices has changed less than immediate disruption suggests
Dated Brent Monthly Price Dated Brent and Forward Curves
80
140
Since 2008
70
Global Financial Crisis
120 Since 2014
60
June 2014
100
October 2014
50
US$/bbl
Dated Brent fell to multi year lows of
End 2009 Since 2015
80 Jun 2015
USD/bbl
US$17/bbl on April 21, 2020
40
Jul 2018
End 2008 Feb 2019
60
30 Aug 2019
Demand reduction from Covid-19 Spot
outbreak following on from the Saudi- Brent May 2020
Russia production standoff 40
20
Jan 2016
10 20
0 0
2000 2002 2004 2006 2008 2010 2012 2014 2016 2018 2020 2022 2024
19
20
9
19
20
9
01
01
20
20
20
20
l-2
-2
n-
n-
r-
r-
ct
Ju
Ap
Ap
Ja
Ja
O
3031
thousands of barrels produced in the USA per day
3,500
7,000
10,500
14,000
0
1983-01-01
1984-01-01
1985-01-01
1986-01-01
1987-01-01
1988-01-01
1989-01-01
1990-01-01
1991-01-01
1992-01-01
1993-01-01
1994-01-01
1995-01-01
1996-01-01
1997-01-01
1998-01-01
1999-01-01
2000-01-01
2001-01-01
2002-01-01
2003-01-01
2004-01-01
2005-01-01
2006-01-01
Things to watch: US Oil Production (bbls per day)….
2007-01-01
2008-01-01
2009-01-01
0
20
40
60
80
100
120
2010-01-01
2011-01-01
2012-01-01
2013-01-01
2014-01-01
2015-01-01
Source: www.macrotrends.net
2016-01-01
2017-01-01
2018-01-01
Brent Price Outlook (Real)
2019-01-01
2020-01-01Dated Brent Forward Curve Evolution – a lot of strengthening lately –
particularly at the back end
Brent Forward Curve
USD/bbl As of end of May
65
14 J
an (B
efore
60 COV
ID-1 29 May
18 Feb 9) February price range
18 May
55
50
arch 20 March
6M
45 rch
1 Ma rch Long-term price saw a recovery
1 a
9M in early May because of the
Will the near term kill easing of economic restrictions
40
and expected demand recovery
so much investment
that the long-term
35
shortage risk rises?
30
25 Near-term prices continued dropping in
il
Apr
April due to depressed demand and
insufficient storage
29
20
Sep-20
Sep-21
Sep-22
Sep-23
Sep-24
Sep-25
Sep-26
Sep-27
Sep-28
Jun-20
Jun-21
Jun-22
Jun-23
Jun-24
Jun-25
Jun-26
Jun-27
Jun-28
Dec-20
Dec-21
Dec-22
Dec-23
Dec-24
Dec-25
Dec-26
Dec-27
Dec-28
Mar-21
Mar-22
Mar-23
Mar-24
Mar-25
Mar-26
Mar-27
Mar-28
Mar-29
32
Source: BloombergIn Asia Pacific, coal market impacts are strongly influenced by China
China’s annual coal import and export China’s Coal import by country in 2019
350
China became a net
300 coal importer for the United States
Vietnam Others
first time in 2009 0% 5%
0%
250 Colombia
Annual import/export (mmt)
1%
200 Canada
1% Russia
9%
150
Indonesia
100 46%
Mongolia
12%
50
0
-50 Australia
26%
-100
2000
2001
2002
2003
2004
2005
2006
2007
2008
2009
2010
2011
2012
2013
2014
2015
2016
2017
2018
2019
Import Export Net import
Source: NDRC, World Bank Source: Bloomberg
33China’s thermal generation (coal) down 10% in January-March, but could have
been much worse, as there was also sharply reduced hydro availability
China Daily Average Generation mix 2017-19
2019 – 2020
Jan-Feb vs Mar Q1 Changes
CAGR
%
20 18.6 18.4
17.7 17.8 Total +6.4% -15.6%
17.1 16.7 17.0 Solar
15.8
15 Solar +37.5% +40.2%
Win d
Wind +15.0% +19.7%
TWh
10 Hydro
Note: Weak water flow in
Hydro +3.1% -13.6% Q1 and weak demand
Thermal both contributed to hydro
generation reduction.
5 China also probably
Thermal +5.5% -10.5% increased some storage.
Nuclear
0
Nuclear +18.5% +1.9%
2017 2018 2019 2020 2017 2018 2019 2020
Jan-Feb Ma r
6 China daily thermal coal consumption estimation
-10.3% -8.1%
yoy yoy
Million tonne
4
2
0
Jan-Feb 19 Ma r-20 19 Apr-2019 Ma y-2019 Jun-2019 Jul-2019 Aug-2019 Sep-2019 Oct-2019 Nov-2019 Jan-Feb 20 Ma r-20 20
34
Source: Generation from NBS, Demand from CEC. TLG AnalysisCoal price dynamics were less immediately responsive, but subsequently
responded to downward demand pressure
In US$/MT
Monthly Newcastle Coal Price
Newcastle Coal Price Outlook (Real)
120
100
80
USD/MT
140 2017-2018
60
Coal prices were historically strong in 40 Coal price has fallen ~32% ~59
recent years as China’s power demand
jumped 8.5% y-o-y in 2018. Coal imports 20 from a year ago to US$59/MT
120
increased 3.9% while exports fell by 0
55.3% in 2018
19
20
9
19
19
20
9
9
0
19
19
9
9
9
9
0
l-1
r-1
-1
r-2
-1
-1
-1
-1
-2
b-
b-
n-
n-
n-
g-
p-
ar
ar
ct
ov
ec
ay
Ju
Ap
Ap
Fe
Fe
Ja
Ju
Ja
Au
Se
O
M
M
N
D
M
100
US$/MT (real terms 2020)
Impacts on Fuel Markets US$/MT
Observation: If coal prices recover
80 faster than (or do not decrease as
much as) oil/gas, then gas may enjoy a
60
? more persistent advantage. This is not
a strong theme that we’ve noticed yet in
2019
China, but it would make sense.
Coal prices plunged nearly 28% y-o-y in
40 2019 to $77.5/MT on the back of 2020
slackened demand from China coupled
with switch to gas amidst the glut of Near term outlook expected to remain
cheap gas in Europe soft as concerns over weakened
economic and industrial activities place
20 growing pressure on demand.
0
2010 2011 2012 2013 2014 2015 2016 2017 2018 2019 2020 2021 2022 2023 2024 2025
Notes: Forecast prices in 2020US$/MT; 2010-2019 are actuals, forecast thereafter
35 Source: ICE, Based on latest market forward curves for the front 2 yearsAbout The Lantau Group
Headline Impacts Impact on Utility Costs
Other Points
Summary
36The pandemic will have different effects in each jurisdiction – however, we can
look at the impacts for a generic utility cost structure
Generic Utility Cost Structure in SEA Before Pandemic
Other
(Retail, Operations)
100%
4%
Distribution Network Costs Over 50% of utility costs are largely fixed in the near-
16% • These are often the next term, and thus, demand destruction related to the
largest component gen pandemic will generally increase the average costs per
80% • Distribution is typically more kWh for customers corresponding to these costs (NB: not
Transmission an increase in costs, but in average rates)
costly than transmission
10%
The details of the differences between regulatory
Generation Generation Costs frameworks from one jurisdiction to the next will
(Capacity and FOM)
• These are often the largest determine the mechanics of the extent to which these
60%
23% utility cost component, often costs are passed through (future tariffs and ‘clawbacks’),
comprising around 70% of and the period over which they are passed through
total utility costs
• These are often primarily
Generation
40% (Fuel and VOM)
variable costs (~2/3rds),
mostly related to fuel, but also
contain a substantial amount of
fixed costs related to capacity Broad energy demand destruction globally has placed
payments immense pressure on energy prices, which have
47%
20% • These can vary substantially plummeted since the beginning of the year – this will drive
by jurisdiction depending on declining variable costs across jurisdictions
the generation mix and
Domestic fuel availability and
policy
0%
1
37The short-term loss of sales from reduced demand is likely to be more than
offset by the longer-term fall in fuel prices
Indicative Analysis of Cost Impacts of Pandemic
Lockdown Period Easing Period Recovery Period
(Apr – May 2020) (e.g., Jun – Dec 2020) (2021)
• The process by which demand
Fixed Cost Pressures: Demand destruction related to the pandemic will increase the burden of fixed
destruction increases end-user
Assuming Fixed Costs are ~53% of Total costs for remaining customers
tariffs will differ by regulatory
Demand Destruction: regime, and in some cases, this
-15% -5% -2% burden may be borne in part by the
(Indicative assumptions)
utilities/retailers
Impact on Average Cost: • Generally, this takes more time
(Assuming all non-fuel/VOM costs are +9.4% +2.8% +1.1% under most regulatory mechanisms
‘fixed’ in the near-term)
to impact end-user rates (lagged)
Softened fuel markets related to the pandemic will decrease sector costs for • In regulated jurisdictions, fuel cost
Fuel Cost Relief:
Assuming Fuel Costs are ~43% of Total customers savings will be passed through to
end-users, albeit with some lag
Coal Price Change*: depending on the applicable regulatory
(Newcastle, adjusted for shipping) +3% -22% -16% mechanisms
• In unregulated jurisdictions, fuel
Gas Price Change*: cost savings may not be
(Brent price change – this does not
account for new gas/LNG contract -25% -54% -41% immediately realized by retailers,
slopes or spot purchases of gas/LNG) who often hedge these, nor by
customers, who sometimes are
Fuel Cost Impact: -4.6% -16.3% -12.1% ‘locked-in’ to specific rates for a period
(Assuming fuel costs are 50/50 coal/gas)
of time
Net Cost Impact: +4.8% -13.5% -11.0%
* Pre-Pandemic price based on Jan forwards; Post-pandemic based on combination of actual spot prices (April – May 2020) and recent
38forward curves (June 2020 and beyond)Comparison of fuel price expectations / out-turn before and after the pandemic
Newcastle Coal Brent Oil
USD/MT USD/bbl
80 10% 70 0%
5% -10%
75
60
0% -20%
70
50
-5% -30%
65
-10% -40%
40
60
-15% -50%
30
55
-20% -60%
50 -25% 20 -70%
2020-Aug
2020-Sep
2021-Aug
2021-Sep
2020-Aug
2020-Sep
2021-Aug
2021-Sep
2020-Apr
2021-Apr
2020-Apr
2021-Apr
2021-Feb
2021-Feb
2020-Jul
2021-Jul
2020-Jul
2021-Jul
2020-Jun
2020-Nov
2020-Dec
2021-Jan
2021-Jun
2021-Nov
2021-Dec
2020-Jun
2020-Nov
2020-Dec
2021-Jan
2021-Jun
2021-Nov
2021-Dec
2020-Oct
2021-Oct
2020-Oct
2021-Oct
2020-May
2021-Mar
2021-May
2020-May
2021-Mar
2021-May
Change Pre-Pandemic Post-Pandemic Change Pre-Pandemic Post-Pandemic
‘Pre-pandemic’ based on forward curve beginning of February 2020
‘Post-pandemic’ based on actual spot prices through May 2020, and forward curves at beginning of May for June 2020 onwards
39About The Lantau Group
Global Financial Crisis as
Headline Impacts Comparator
Other Points
Summary
40A perspective from the Global Financial Crisis
Monthly Electricity Demand
5,000 25% 5,000 25% 25,000 25%
4,500 4,500
20,000 20%
4,000 20% 4,000 20%
17%
Monthly “Demand” (GWh)
Monthly “Demand” (GWh)
Monthly “Demand” (GWh)
3,500 3,500
Annual growth rate (%)
Annual growth rate (%)
Annual growth rate (%)
15,000 15%
3,000 15% 3,000 15%
2,500 2,500 10,000 10%
7%
2,000 10% 10% 2,000 9%
10%
5,000 5%
1,500 1,500 3%
2%
5%
1,000 5% 1,000 4% 5%
3% 3% - 0%
2% 3%
500 500 -1%
1% -2%
1%
0.1%
- 0% - 0% -5,000 -3%
-5%
07
08
09
10
11
12
06
07
08
09
10
11
12
06
07
08
09
10
11
12
20
20
20
20
20
20
20
20
20
20
20
20
20
20
20
20
20
20
20
20
Annual Electricity Demand Growth Rate (%) Annual Electricity Demand Growth Rate (%) Annual Electricity Demand Growth Rate (%)
Monthly Electricity Demand (GWh) Monthly Electricity Demand (GWh) Monthly Electricity Demand (GWh)
41
Source: PEMC; EMC; MOEA BOE; Taipower Statistics; TLG AnalysisDuring the GFC, for example, Philippine GDP growth stayed positive through a
15-month decline, taking ~9 months to recover from its bottom
Historical quarterly YoY real GDP growth in the Philippines
10.0% • In the 2008 Global Financial Crisis, Philippine GDP growth fell
from 5.1% to 1.1% over 15 months, with electricity demand less
impacted (the demand-GDP elasticity trended above 1)
• Whilst the nature of the exogeneous shock from COVID-19 is in many ways unique, analysis
of the GFC highlights that the recovery of GDP to pre-GFC levels took 9 months. This is not
inconsistent with the recovery currently projected by the IMF, ADB, and World Bank (see RHS)
7.5%
“V” Recovery
5.0%
2.5%
0.0%
8 08 09 09 10 10 11 11 12 12 13 13 14 14 15 15 16 16 17 17 18 18 19 19 20 20 21 21
-0 - - - - - - - - - - - - - - - - - - - - - - - - - - -
Q1 Q3 Q1 Q3 Q1 Q3 Q1 Q3 Q1 Q3 Q1 Q3 Q1 Q3 Q1 Q3 Q1 Q3 Q1 Q3 Q1 Q3 Q1 Q3 Q1 Q3 Q1 Q3
42 Note: Third party forecasts for GDP lack quarterly granularity..
Source: Bangko Sentral ng Pilipinas; ADB; IMF; World BankAs of now, the recovery profile is not yet clear – and probably depends most on
the nature of COVID-19 response (vaccine, treatment, herd immunity, distancing etc.)
20% Real GDP growth rate yoy
Taiwan South Korea Australia Ma inland China Ma laysia Singapore Thailand Vietnam Philippines
15%
10%
5%
0%
2000 2001 2002 2003 2004 2005 2006 2007 2008 2009 2010 2011 2012 2013 2014 2015 2016 2017 2018 2019 2020E
-5%
Global Financial Crisis COVID-19
-10%
43 Source: WorldBank, and BloombergSome segments (e.g. tourism) will be hurt more deeply and for longer – due to
public fear and because of less discretionary income if a prolonged recession
Forecast providers Indicator Impact of COVID-19
44% International tourist arrivals in 2020: three scenarios
International air (YoY monthly change %)
passenger traffic 80%
20
Airlines’ revenue passenger Jan Feb Mar Apr May Jun Jul Aug Sep Oct Nov Dec
56% 0
kilometers (intl. and dom.)
Monthly change, %
-20 Actual data
International tourism US$910bn (-62%)
Scenario 1
receipts Gradual opening of borders
US$1,170bn (-79%) -40 Scenario 2
and lifting travel restrictions
Scenario 3
13% -60
Global merchandise trade
volume 32% In July In Sep
-80 In Dec
World GDP -3% contraction
-100
-6% contraction Source: UNWTO
Source: ICAO, IATA, UNWTO, WTO, IMF, Note: All figures are
V-shaped recovery 2020 data compared with 2019 data, except for airport revenue
figures which are compared to 2020 business-as-usual.
U-shaped recovery
Commercial flights flow statistics
150,000 2020 domestic 2020 international 2020 not specified 2019 total
100,000
50,000
0
1-Jan 1-Feb 1-Mar 1-Apr 1-May
Source: radarbox.com
44Sorting out economic impacts will take time. For example, Thailand, hospitality
is a significant driver of electricity demand (a correlate with GDP)
Thailand
GWh Historic power consumption by industry type GWh
Historic power consumption by business type
90,000
90,000
80,000
80,000
70,000
70,000
60,000 Manufacturing (Other)
60,000
50,000
Petroleum, Natural Gas 50,000
& Petrochemicals
40,000
40,000
Food
30,000
30,000
Restaurants & Hospitality
20,000
20,000
Retail
10,000 Metals, Metal Products, and Machining
10,000
Government, Public Services, and NGOs
0
02 03 04 05 06 07 08 09 10 11 12 13 14 15 16 17 18 19 0
20 20 20 20 20 20 20 20 20 20 20 20 20 20 20 20 20 20
02 03 04 05 06 07 08 09 10 11 12 13 14 15 16 17 18 19
20 20 20 20 20 20 20 20 20 20 20 20 20 20 20 20 20 20
Metals, Metal Products, and Machining Food
Petroleum, Natural Gas, and Petrochemicals Manufacturing (Other) Government, Public Services, and NGOs Retail
Textiles Agriculture, F orestry, and Fishing Restaurants and Hospitality Logistics, Transportation, and Storage
Mining Other Real Estate
Wholesale Financial Institutions
Construction
45 Note: Analysis based on TLG interpretation of TSIC codes - all industry types not necessarily represented
Source: EPPO; TLG analysisChina seems likely to recover faster (at this point) but exports from ASEAN
countries depend heavily on USA and EU markets
Export from ASEAN to USA Export from ASEAN to EU28 Export from ASEAN to China
(2019) (2019) (2018)
70 50 70
60 60
40
50 50
30
Billion Euros
40
Billion USD
40
Billion USD
30 30
20
20 20
10
10 10
0 0 0
T h ys ia
do d
M nam
ei
am os
ya s
a a
Br ia
M nam
M nam
T h ys ia
ng nd
T h ys ia
ng nd
ar
ar
am es
am es
ar
on e
ilip sia
ya a
o e
ilip sia
ya a
ei
ei
Br s
Br s
ilip re
I n ilan
M pine
T h ing esi
o
o
T h I nd por
M odi
T h nd por
M odi
un
d
un
un
C La
nm
nm
nm
Ph po
C pin
C pin
Si ila
Si la
La
La
bo
Ph e
Ph ne
a
S n
a
a
et
a
ai
b
b
et
et
a
a
a
al
al
al
Vi
Vi
Vi
I
e
e
e
46 Source: USA census, European commission, and General Administration of Customs of ChinaAgenda
1. Executive Summary
2. Overview of Singapore Electricity Market
About The Lantau Group
3. Key Market Drivers
4. Modelling Results
Headline Impacts
5. Appendix
Other Points
Summary
47About The Lantau Group
Headline Impacts
Other Points Diversity
Summary
48Wide variations in industry mix – suggesting very uneven impacts likely
Percentage Share of GDP by Industry Type (2018)
Cambodia 16% 23% 40% 22%
Vietnam 16% 28% 41% 15%
Malaysia 22% 18% 52% 8%
China 29% 11% 53% 7%
South Korea 27% 17% 54% 2%
Thailand 27% 8% 57% 8%
Philippines 19% 12% 60% 9%
Taiwan 33% 4% 61% 2%
Australia 6% 25% 67% 2%
Singapore 21% 10% 69% 0%
0% 10% 20% 30% 40% 50% 60% 70% 80% 90% 100%
Manufacturing Non-Manufacturing Industry Services Agriculture
49 Source: WB, TW Stats, TLG analysisMarkets like Singapore, Japan, Thailand, Korea (for example) all import LNG
and will benefit (or offset pain) via lower imported fuel costs
(others like Philippines have gas linked to oil prices, and others like Taiwan, Malaysia and Vietnam import a lot of coal)
100%
90%
80%
70%
60%
50%
40%
30%
20%
10%
0%
Vic, Vietnam Indonesia Korea Ma laysia Taiwan China New Delhi, Thailand Me ra lco, WA , Tepco, Singapore
Australia India Philippines Australia Japan
Hydro Other Renewables Nuclear Coal Natural Gas Oil Other
Source: Department of the Environment and Energy - Australian Energy Statistics, Electricity of
Vietnam (EVN), Ministry of Energy and Mineral Resources Republic of Indonesia, Bureau of
50 Energy - Ministry of Economic Affairs - Taiwan, China Electricity Council, Central Electricity
Authority – India, Meralco & Department of Energy – The Philippines, TEPCO – Japan, IEA,Countries like Vietnam with remarkably high growth rates may slow down, but
are unlikely to reverse
Power demand by sector in Vietnam 05-18 CAGR of
Consumption
200 192 40 • Against the backdrop of strong economic
+9.1% growth, electricity consumption more than
180 175 trebled from 46 TWh in 2005 to 192 TWh in
35 +18.4%
159 2018 – representing a CAGR of nearly 11.7%
05-18
160 Consumption over 2005-2018 period. Peak demand is
144 30 growing at a CAGR of 10.8% during the same
CAGR
140 129 period.
+11.7%
Peak demand (GW)
Consumption (TWh)
120
115 25 • The industrial sector is the main driver of
105 +13.5% electricity demand, accounting for over half
100
95
20 (55%) of electricity consumption in 2018,
86 having grown at 13.5% CAGR since 2005.
Peak Demand
75 CAGR 10.8%
80
66 15 • The residential sector accounts for
58 approximately one third of total electricity
60 51 +13.6%
46
10
consumption, with its share having gradually
40
reduced over time. Its CAGR of 9.1% is lower
than demand growth in either the industrial or
5 commercial sectors.
20
+9.1%
• The commercial and agricultural sectors
0 0
account for a relatively small portion of
electricity demand but recorded relatively
05
06
07
08
09
10
11
12
13
14
15
16
17
18
20
20
20
20
20
20
20
20
20
20
20
20
20
20
robust CAGR 13.6% and 18.4% respectively
Residential Commercial over the 2005-2018 period.
Industrial Agriculture
Others Peak Demand
51
Source: ADB, EVN and EVN NLDCImplications will vary greatly by region, and not just by country
Power demand growth YoY
2020 Jan-Feb Northeast Grid
2020 Mar Northeast Grid 2020 April Northeast Grid
+2.4% -1.2% +0.3%
+5.4% +1.3% +1.2% +5.0%
+1.0% +1.5%
+4.9% -1.1% +5.5% -4.0% +7.0% -0.5%
+4.9% North Grid -3.3% -1.0% North Grid -3.4% +6.6% North Grid -7.2%
-8.2% -7% -0.6%
Northwest Grid -7.6% Northwest Grid -4.6% Northwest Grid -1.7%
+0.1% -4.1% -0.6% +1.4%
-9.1% -8.8% -8.6%
+1.3% -1.2% +1.4%
+6.4% -0.4%
-7.9% -0.7% +2.0%
-13.7% -6.5% +0.5%
-16.8% -6.3% +0.3%
-2.3% Central Grid - -5.4% Central Grid -0.8% +11.7% Central Grid +5.3%
-2.6% -20.0% 10.4% -12.9% -2.9% -28.3% -9.3% +4.5% -5.4% -2.3%
-7.9%
East Grid
-21.3%
-6.9% East Grid
-1.3% -0.0% East Grid
-6.7% -12.2% -8.5% +6.6%
-0.8%
-1.4% +5.9%
-5.5% -2.7% +5.1%
-7.9% -6.8% -2.5%
South Grid South Grid
+6.6% +4.3% South Grid +9.3%
-1.9%
-13.2% Central grid and -3.8%
-6.2%
+5.2%
-5.6%
costal provinces were
-4.9% hit bad, and has not -7.8% -11.7%
recovered to 2019
level in March. Almost all provinces saw
improved growth rate in April.
20%
Jan-Feb Ma r April
10%
0%
-10%
Northeast Northwest South
-20% Central Grid East Grid North Grid Grid Grid Grid
-30% lo ilin
ng
H i
Sh i
Li lia
Si ng
Be n
an
ho nan
su
jin
I n ha x i
Yu n
t
Sh ng
Sh uan
G i
H xi
ou
g
H i
G ng
Z h su
Xi ia
N ai
ng g
G an
ng
J i ai
on g
Fu i
gx
e
e
be
hu
nx
jia
na
ijin
ua ian
r M on
gx
ub
eb
n
ng
gh
gh
go
an
g
ia
qi
en
an
jia
zh
do
nn
ni
J
an
a
aa
Ti
An
an
u
ai
ch
ne nd
in
ej
ng
ua
in
j
H
H
ao
an
Ti
ng
n
ui
Ji
Q
S
ei
C
G
H
52
Source: CEC; TLG research and analysisFor some, fuel cost decreases already more than offset demand reduction
Generation Total operating Total operating Profit margin
output 2020Q1 income 2020Q1 cost 2020Q1 vs. 2020Q1 vs.
vs. 2019Q1 vs. 2019Q1 2019Q1 2019Q1
Datang International
-5.7% -2.3% -3.3% +64.3%
(601991.SH)
Huadian International
-10.8% -6.0% -9.1% +54.4%
(600027.SH)
Huaneng International
-18.5% -11.6% -11.2% -22.4%
(600011.SH)
China Resources Power
-12.5% -8.2% N/A -10.4%
(00836.HK)
Guangdong Electric
-16.2% -15.8% -13.9% -93.3%
Power (000539.SZ)
Zhejiang Zheneng
Electric Power -36.8% -34.1% -32.8% -47.6%
(600023.SH)
Note: Generation output - 完成发电量; Total operating income - 营业总收入;
Total operating cost - 营业总成本; Profit margin - 归属于上市公司股东的净利润
Source: Company announcements; TLG Analytics, Caixin
53You can also read