Creating Value in Colombia & Ecuador - Gran Tierra Energy
←
→
Page content transcription
If your browser does not render page correctly, please read the page content below
Creating Value in Colombia & Ecuador
June 2019
General Advisory                                                                                                     core areas; our prospects and leads; the plans, objectives, expectations and intentions of the Company
                                                                                                                     regarding production, exploration and exploration upside, drilling, permitting, testing and development;
The information contained in this presentation does not purport to be all-inclusive or contain all                   Gran Tierra’s 2019 capital program including the changes thereto along with the expected costs and
information that readers may require. You are encouraged to conduct your own analysis and review of                  the expected allocation of the capital program; and Gran Tierra’s financial position and the future
Gran Tierra Energy Inc. (“Gran Tierra”, “GTE”, or the “Company”) and of the information contained in                 development of the Company’s business. Statements respecting reserves are forward-looking
this presentation. Without limitation, you should read the entire record of publicly filed documents                 statements as they involve the implied assessment, based on estimates and assumptions, that the
relating to the Company, consider the advice of your financial, legal, accounting, tax and other                     reserves and resources described exist in the quantities predicted or estimated and can be profitably
professional advisors and such other factors you consider appropriate in investigating and analyzing                 produced in the future. Unrisked prospective resources are highly speculative and do not represent
the Company. You should rely only on the information provided by the Company and not rely on parts                   current reserves, future production or even future possible reserves.
of that information to the exclusion of others. The Company has not authorized anyone to provide you
with additional or different information, and any such information, including statements in media articles           Estimates of future production, cash flow guidance and certain expenses may be considered to be
about Gran Tierra, should not be relied upon. No representation or warranty, express or implied, is                  future-oriented financial information or a financial outlook for the purposes of applicable Canadian
made by Gran Tierra as to the accuracy or completeness of the information contained in this document,                securities laws. Financial outlook and future-oriented financial information contained in this presentation
and nothing contained in this presentation is, or shall be relied upon as, a promise or representation by            about prospective financial performance, financial position or cash flows are based on assumptions
Gran Tierra.                                                                                                         about future events, including economic conditions and proposed courses of action, based on
                                                                                                                     management’s assessment of the relevant information currently available, and to become available in
An investment in the securities of Gran Tierra is speculative and involves a high degree of risk that                the future. In particular, this presentation contains projected production and operational information for
should be considered by potential purchasers. Gran Tierra’s business is subject to the risks normally                2019 and 2020. These projections contain forward-looking statements and are based on a number of
encountered in the oil and gas industry and, more specifically, certain other risks that are associated              material assumptions and factors set out above. Actual results may differ significantly from the
with Gran Tierra’s operations and current stage of development. An investment in the Company’s                       projections presented herein. These projections may also be considered to contain future-oriented
securities is suitable only for those purchasers who are willing to risk a loss of some or all of their              financial information or a financial outlook. The actual results of Gran Tierra’s operations for any period
investment and who can afford to lose some or all of their investment. You should carefully consider the             will likely vary from the amounts set forth in these projections, and such variations may be material. See
risks described under the heading “Risk Factors” in the Company’s Annual Report on Form 10-K and in                  above for a discussion of the risks that could cause actual results to vary. The future-oriented financial
the Company’s other SEC filings available at www.grantierra.com..                                                    information and financial outlooks contained in this presentation have been approved by management
In this presentation, unless otherwise indicated, all dollar amounts are expressed in US dollars. All                as of the date of this presentation. Readers are cautioned that any such financial outlook and future-
production, reserves and resources are working interest before royalties (“WI”). Please see the                      oriented financial information contained herein should not be used for purposes other than those for
appendices to this presentation for important advisories relating to the Company’s presentation of oil               which it is disclosed herein. The Company and its management believe that the prospective financial
and gas information and financial information, including the presentation of non-GAAP measures,                      information has been prepared on a reasonable basis, reflecting management’s best estimates and
Current market values are based on a NYSE share price of US$1.97 as at close on May 30, 2019 and                     judgments, and represent, to the best of management’s knowledge and opinion, the Company’s
384.5 million issued and outstanding shares as of March 31, 2019.                                                    expected course of action. However, because this information is highly subjective, it should not be
                                                                                                                     relied on as necessarily indicative of future results.
Forward-Looking Information Advisory
                                                                                                                     The forward-looking statements contained in this presentation are based on certain assumptions made
This presentation contains forward-looking statements within the meaning of the United States Private                by Gran Tierra based on management’s experience and perception of historical trends, current
Securities Litigation Reform Act of 1995, Section 27A of the Securities Act of 1933, as amended, and                 conditions, anticipated future development and other factors believed to be appropriate. Such
Section 21E of the Securities Exchange Act of 1934, as amended, and financial outlook and forward                    statements are subject to a number of assumptions, risks and uncertainties, many of which are beyond
looking information within the meaning of applicable Canadian securities laws (collectively, “forward-               Gran Tierra’s control, which may cause actual results to differ materially from those implied or
looking statements”). All statements other than statements of historical facts included in this                      expressed by the forward-looking statements. These include the factors discussed or referenced under
presentation regarding our financial position, estimated quantities and net present value of reserves,               the heading “Part 1. Item 1A. Risk Factors” in Gran Tierra’s Annual Report on Form 10-K, under the
business strategy, plans and objectives for future operations, capital spending plans and those                      heading “Part II. Item 1A. Risk Factors” in Gran Tierra’s Quarterly Reports on Form 10-Q and in the
statements preceded by, followed by or that otherwise include the words “believe”, “expect”, “intend”,               other reports and filings with the Securities and Exchange Commission.
“anticipate”, “forecast”, “will”, “estimate”, “target”, “project”, “goal”, “plan”, “should” or similar expressions
                                                                                                                     All forward-looking statements speak only as of the date on which such statements are made, and Gran
are forward-looking statements. Such forward-looking statements include, but are not limited to,
                                                                                                                     Tierra undertakes no obligation to correct or update any forward-looking statements, whether as a
statements about: future projected or target production and the growth of production including the
                                                                                                                     result of new information, future events or otherwise, except as required by applicable law. Gran
product mix of such production and expectations respecting production growth; our ability to grow in
                                                                                                                     Tierra’s forward-looking statements are expressly qualified in their entirety by this cautionary statement.
both the near and long term and the funding of our growth opportunities; our possible creation of new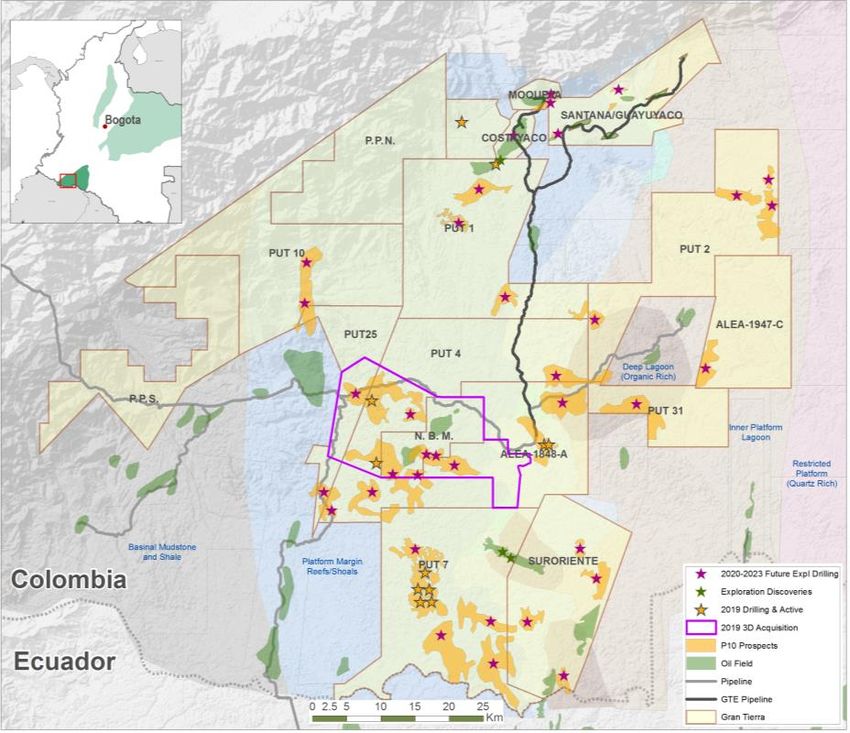
REASONS TO INVEST IN GRAN TIERRA
Quality assets with low declines
Focused on low cost, conventional oil & gas
developments High-Quality Profitable
Assets Production
Access to infrastructure with the ability to Growth
monetize at Brent pricing
CREATE
LONG-TERM
World class exploration portfolio
SHAREHOLDER
VALUE
Exploration and development funded by cash flow
$2.1 billion1 of free cash flow overCostayaco
from existing reserves
the next 5 years
Sustainable
Potential for share buybacks
Moqueta
High-Impact
Exploration
Business
Model
Strong balance sheet
Sustainable business model, expected to be fully funded by forecasted cash flows
1. Free Cash flow means the GAAP line item “net cash provided by operating activities”, less projected total 2P capital costs for 2019-2023 from McDaniel 2018 YE Reserves Report. Includes Suroriente W.I. of 52% after Vetra’s W.I. acquisition in March 2019 and VMM-2
W.I. of 100% after the acquisition of an additional 20% in April 2019. 3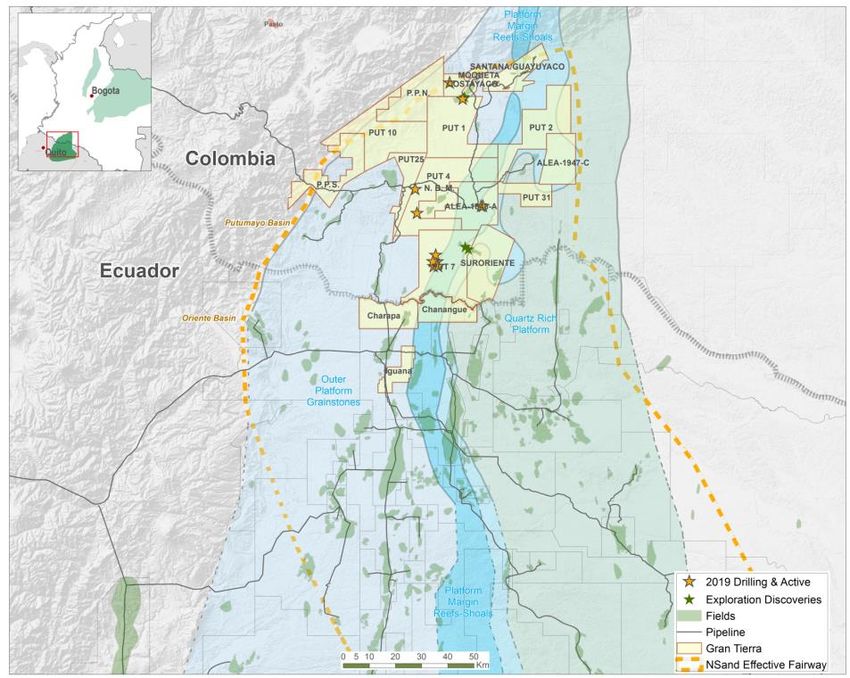
GRAN TIERRA SNAPSHOT
Publicly listed, independent international exploration & production                                                                                                                                                   100%                                       Diversified                                                           +95%
company focused in Colombia & Ecuador                                                                                                                                                                                                                                      High-quality,                                               Operated
                                                                                                                                                                                                                                 Oil
                                                                                                                                                                                                                                                                            asset base                                                 Production
Production                                                                2016                                2017                                2018                                     2019E
WI Production (boepd) 1                                                26,216                              31,426                             36,209                       41,000-43,000

Financials                                                                 2016                              2017                                  2018                                Q1 2019

EBITDA (US     $MM)2                                                         120                                183                                  377                                           93

Funds Flow from Operations (US $MM) 2                                        105                                220                                  306                                           76

2018 Reserves3                                                                                    1P                                  2P                                       3P

MMBOE                                                                                             70                                150                                      215

RLI (years)4                                                                                         5                                 11                                      15                                                                                        Middle
                                                                                                                                                                                                                                                                        Magdalena
NPV10 BT (US $bn)                                                                              $1.4                                $2.8                                    $4.0                                                                                           Valley                                      Llanos
NPV10 AT (US $bn)                                                                              $1.2                                $2.2                                    $3.0

Mean Prospective Resources5                                                                                                  Risked                              Unrisked

                                                                                       MMBOE                                        361                                  1,419

Market Values                                                                                                                                                                                                                                                           Putumayo/Oriente
Market Capitalization (May 30, 2019)                                                                 US$ 0.76 bn

Net Debt6                                                                                            US$ 0.48 bn
                                                                                                                                              NYSE AMEX:
Enterprise Value                                                                                     US$ 1.24 bn
                                                                                                                                                    LSE:
                                                                                                                                                    TSX:
                                                                                                                                                                                       GTE
Avg 30-day combined trading volume                                                              4.2 MM shares

                                                      High quality diversified asset base: 100% oil & over 95% operated
                          1.   Colombia WI annual average production
                          2.   EBITDA and funds flow from operations are non-GAAP measures and do not have a standardized meaning under GAAP. Refer to "Non-GAAP Measures" in the appendix for descriptions of these non-GAAP measures and reconciliations to the most directly comparable measures calculated and presented in accordance                           4
                               with GAAP.
                          3.   Based on Dec. 31 2018 McDaniel Reserve Report. Includes Suroriente W.I. of 52% after Vetra’s W.I. acquisition in March 2019 and VMM-2 W.I. of 100% after the acquisition of an additional 20% in April 2019. See appendix for McDaniel Brent oil price forecast.
                          4.   Calculated using average fourth quarter 2018 WI production of 38,156 BOEPD
                          5.   Based on July 31 2018 McDaniel Prospective Resource Report, excludes recent acquisitions and Ecuador
                          6.   Based on pro-forma Q1 2019 net debt of $482 million, comprised of cash of $208 million, convertible notes of $112 million (net of unamortized fees; $115 million gross), high yield bonds of $579 million (net of unamortized fees; $600 million gross), reserves-based credit facility of -$2 million (net of unamortized fees; $0
                               million gross) and number of shares of Gran Tierra's common stock outstanding at March 31, 2019 of 384.5 million. Net working capital and debt at March 31, 2019, prepared in accordance with GAAP. See appendix for “Presentation of Oil and Gas Information” and “Non-GAAP” Measures.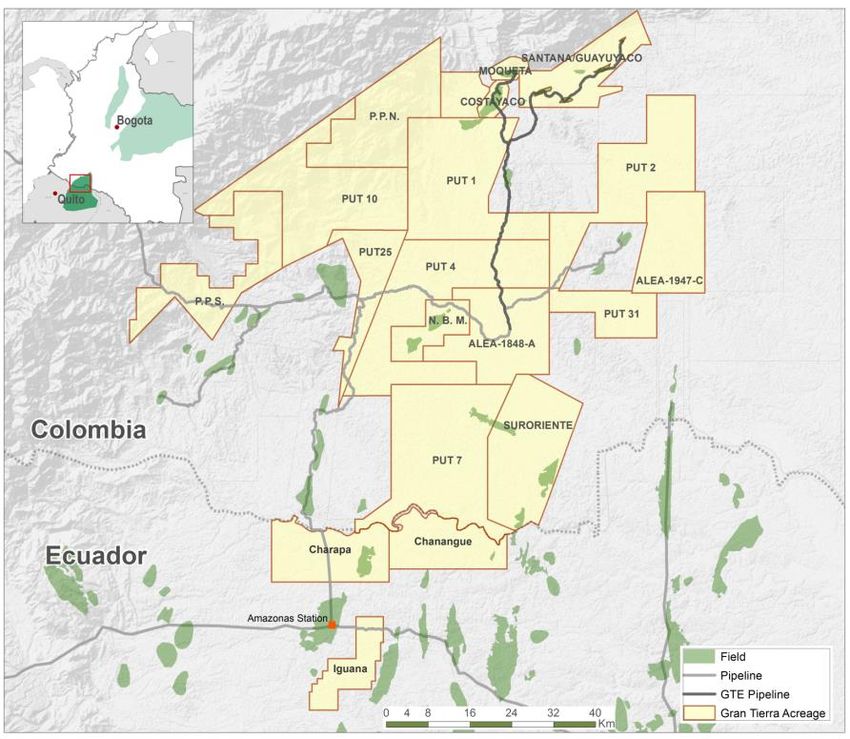
GRAN TIERRA – EXCELLENT VALUE PROPOSITION
    High-Quality                                                                Profitable Production
    Assets                                                                      Growth
•   +95% operated, 100% oil                                                   • Short cycle times
•   Low decline rates                                                         • Focused on full-cycle returns
•   Low operating costs          High-Quality                    Profitable
                                    Assets                       Production   • Large inventory of
•   Top quartile netbacks                                         Growth        undeveloped well locations

                                                  CREATE
                                                 LONG-TERM
                                                SHAREHOLDER
    High-Impact
                                                   VALUE                        Sustainable Business
    Exploration                                                                 Model
• Material, world-class                                                       • Strong balance sheet
  prospective resource base                                                   • Exploration & development
• Sizable prospect inventory                                   Sustainable      programs funded through
• Proved underexplored basins,    High-Impact                   Business
                                  Exploration                    Model
                                                                                cash flow
  with stacked horizons

                          Key objective: grow NAV/share by 3-5 times within 5 years
                                                                                                                5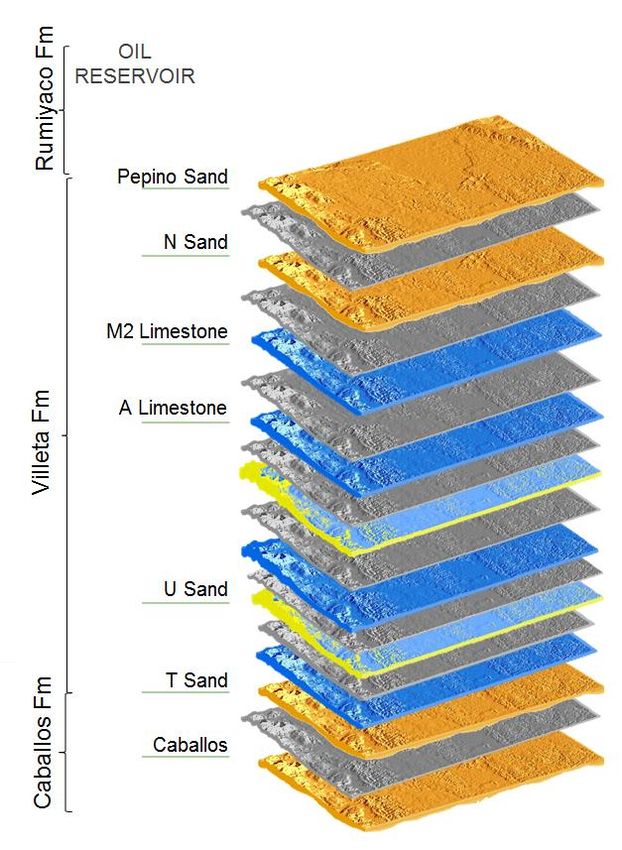
GRAN TIERRA’S FOCUSED STRATEGY
Targeting 3-5 x’s growth in NAV/share in 5 years

                     S T R AT E G Y                                                                                                                      TAC T I C S
            Proven, Under-Explored Conventional
                            Hydrocarbon Basins                                                                                                      Apply Proven Technology
            World-class exploration program targeting WI Unrisked                                                                                   GTE has been able to reduce
                  Mean Prospective Resources of 1.4 billion BOE1                                                                                    drilling times/costs by ~40%

   Access to Established Infrastructure                                                                                                                   Maintain a Strong
    Large spare capacity in pipelines & trucking, leads to
                                                                                                                                   Colombia &             Financial Position
strong oil prices linked to Brent, short cycle times & quick
                                    access to world markets
                                                                                                                                    Ecuador                Self-funded model, debt to cash flow
                                                                                                                                                           1.0-1.3x, >$500MM in liquidity at
                                                                                                                                     an ideal fit          Q1/20192, exploration program funded
                                                                                                                                      for GTE              through cash flow
    Strong, Stable Economic Environment
      Pro-Western governments that ensure contract sanctity,
      rule of law & encourage FDI and resource development                                                                                           Maintain Flexibility & Control
                                                                                                                                                     the Allocation of Capital
                                                                                                                                                     +95% operated asset base allows for
                                      Highly Competitive Fiscal Regime                                                                               disciplined capital allocation and pace
                                                                                                                                                     setting
                 Flexible, progressive fiscal regimes with sliding scale royalty or
                             contractor take that are among the best in the world

                      Colombia & Ecuador are an excellent fit for Gran Tierra’s strategy and tactical plan
                       1.   Based on July 31 2018 McDaniel Prospective Resource Report, excludes recent acquisitions and Ecuador
                       2.   Pro-forma Q1/2019, includes recent $300 MM high yield bond proceeds                                                                                                6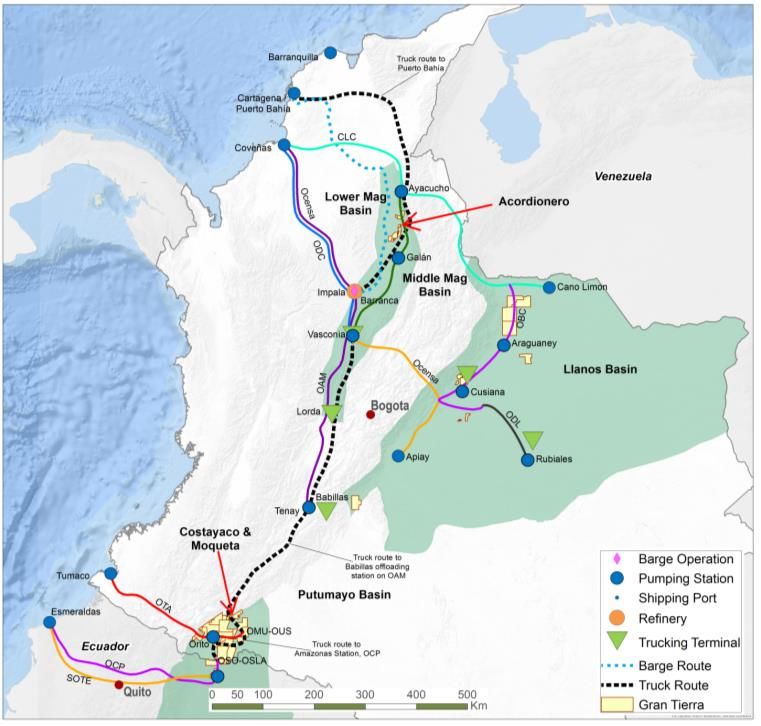
DELIVERING ON OUR FOCUSED STRATEGY
                                                                                                                                                                                         215
                                                                                                                                                                                                        212%
  Production          Growth1                                                                                           Reserves Growth1
                                                                                                                                                                                                                  3P reserves
  (mboe/d, gross WI)                                                                                                     (mmboe, gross WI)
                                                                69%                                                                                                                      150             163%
                                                                     Production
                                                                                                                                                                                                                  2P reserves
                                               38.2

    22.6
                                                                                                                                            69
                                                                                                                                            57                                                                67%
                                                                                                                                                                                          70                        1P reserves
                                                                                                                                            42

  Q2/2015                                  Q1/2019                                                                                   Dec/2015                                       Dec/2018
                                                                                                                            1P Reserves                    2P Reserves                   3P Reserves
  Expanded Exploration Potential1
  (mmboe, mean prospective                                                                                              NAV Per Share Growth2                                             9.11
  resources, gross WI)                                                                                                      (US$/share)
                                                                                                                                                                                                        104%
                                                                   183% Unrisked
                                                                                                                                                                                                                3P NAV BT
                                                1419
                                                                                                                                           4.47
                                                                                                                                                                                          6.12
                                                                                                                                                                                                            77% 2P NAV BT

     501
                                                 361
                                                                   203%   Risked
                                                                                                                                           3.46
     119
   Dec/2015                                 Jul/2018                                                                                  Dec/2015                                      Dec/2018
                                                                                                                                        2P NAV BT                                  3P NAV BT
      Risked                            Unrisked
      Growth in Colombian reserves/production/exploration potential = shareholder value creation
               1.   Based on actuals and/or Dec. 31 2015 and 2018 McDaniel Reserve Reports (includes Suroriente W.I. of 52% after Vetra’s W.I. acquisition in March 2019 and VMM-2 W.I. of 100% after the acquisition of an additional 20%          7
                    in April 2019) and Dec. 31 2015 and July 31 2018 McDaniel Resource Reports
               2.   Based on pro-forma Q1 2019 net debt of $482 million, comprised of cash of $208 million, convertible notes of $112 million (net of unamortized fees; $115 million gross), high yield bonds of $579 million (net of unamortized
                    fees; $600 million gross), reserves-based credit facility of -$2 million (net of unamortized fees; $0 million gross) and number of shares of Gran Tierra's common stock outstanding at March 31, 2019 of 384.5 million. Net
                    working capital and debt at March 31, 2019, prepared in accordance with GAAP. See appendix for “Presentation of Oil and Gas Information”, “Non-GAAP” Measures and McDaniel Brent price forecast.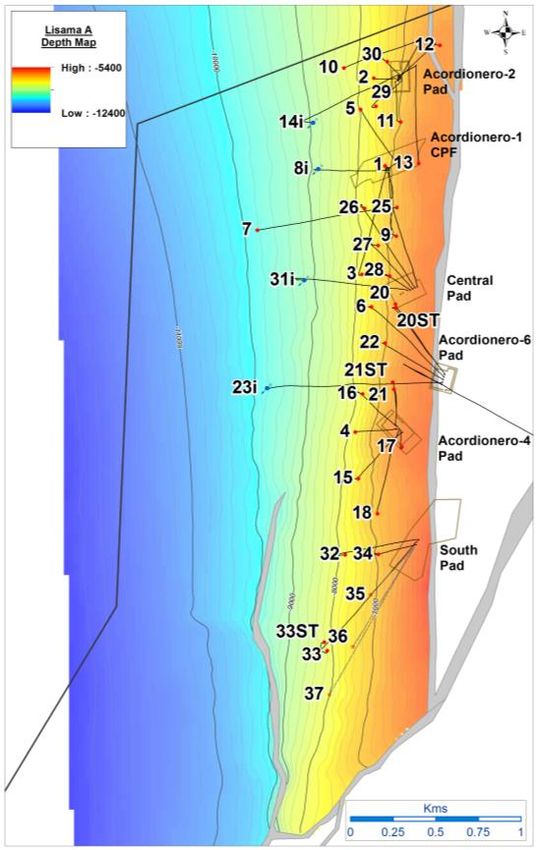
STEADILY GROWING PRODUCTION

        50,000
                    Forecast
        45,000                                                                                                                                                                     41,000-
                    Actuals                                                                                                                                                        43,000
        40,000

        35,000
boepd

        30,000

        25,000

        20,000

        15,000

        10,000

         5,000

            -
                           2015                                        2016                                        2017                                        2018       2019 E

                 From 2015 to 2019, Gran Tierra forecasts average production growth rate of 16% per year
                    1.   Based on GTE 2015-2018 actuals, 2019 production guidance; see press release dated February 27, 2019 for more details and important disclaimers                      8
                    2.   Based on Colombia WI production only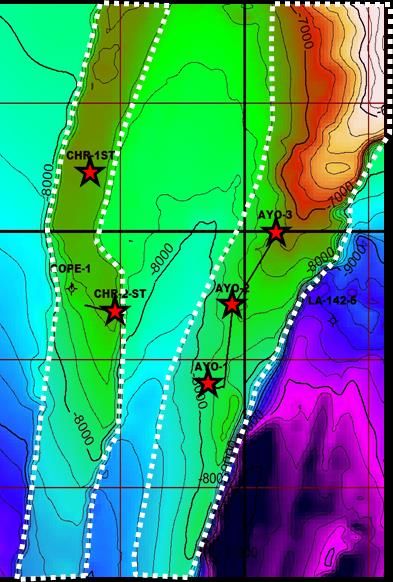
TRANSPORTATION OPTIONALITY
Ample takeaway capacity and no infrastructure
bottlenecks to GTE’s operations
• Spare capacity exists in many pipelines due to Colombian
production declining from >1 MMbbl/d in early 2015 to
~0.87 MMbbl/d in 2018; trucking is priced in Colombian
pesos and can be a very economical alternative to
pipelines
Through major export terminals, GTE has access to
world markets, including Asia, US (West, East &
Gulf Coasts) & Europe
Transportation Export Point
Truck + pipeline Esmereldas (Ecuador)
Putumayo Pipeline Tumaco (Colombia)
(Costayaco, Moqueta, Others)
Truck or truck + pipeline Coveñas (Colombia)
Truck or truck + barge Puerto Bahía (Colombia)
Middle Magdalena
(Acordionero, Others) Truck or truck + pipeline Coveñas (Colombia)
Significant flexibility in transportation arrangements
9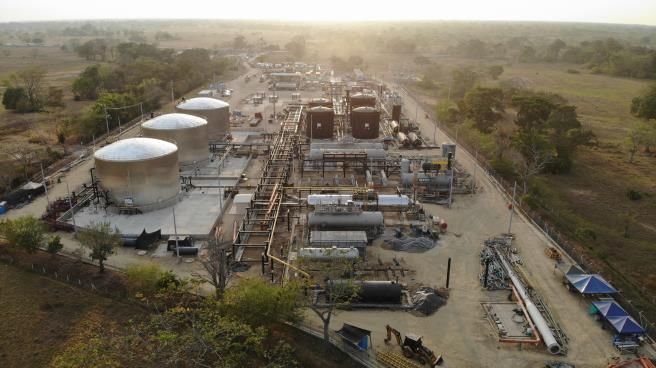
Vasconia – Brent
OIL PRICE UPSIDE EXPOSURE differential
GTE produces nearly 100% oil; all crude sales Key Differentials
0 0
contracts use Brent as the reference price
-5 -5
Strong netbacks and clean balance sheet -10 -10
reduce need for long-term hedging -15 -15
Crude oil prices strong in Colombia & Ecuador -20 -20
with steady differentials, unlike in the US & -25 -25
US$ per bbl
US$ per bbl
Canada -30 -30
-35 -35
• Availability of multiple transportation options
-40 -40
keeps differentials in check
-45 -45
• Vasconia-Brent differential has averaged
-50 -50
approximately -$4.70/bbl over the past 10
years -55 -55
-60 -60
• Oriente-Brent differential has averaged
approximately -$8.80/bbl over the past 10
years Western Canada Select - Brent Edmonton Sweet - Brent
Oriente - Brent WTI Cushing - Brent
Vasconia - Brent
Crude oil prices strong in Colombia & Ecuador with steady, narrow differentials, unlike in US & Canada
Source for market pricing: Bloomberg 10SIGNIFICANT RESERVES GROWTH
250
Reserves Progression (MMboe) 2P Reserves by Property1 (MMboe)
200
65.6 Minor Fields
65.5 25
73.1
150
Ramiquiri
100 53.3 63.2 79.7 3
50
72.8 74.1 69.9
0 Acordionero
Moqueta
2011 2012 2013 2014 2015 2016 2017 2018
9 76
Proved Probable Possible
Achieved reserve replacement2 195% (2P) and 196% (3P)
with total 2018 reserve additions of 25.8 MMboe (2P) and 25.9
MMboe (3P)
Increased Acordionero 2P reserves by 12.5MMbbl
Acordionero, Costayaco, Moqueta, PUT-7 & Suroriente represent 81% of the asset portfolio
After a very active year, GTE achieved significant 2P & 3P reserve growth
1. Gross WI Dec.31 2018 reserves, based on Dec. 31, 2018 McDaniel Reserve Report. Includes Suroriente W.I. of 52% after Vetra’s W.I. acquisition in March 2019 and VMM-2 W.I. of 100% after the acquisition of an 11
additional 20% in April 2019.
2. Reserve replacement calculation includes acquisitionsDEPLOYING CAPITAL PROFITABLY
GTE already generates high return on average
capital employed (“ROACE”), over 13% in 2018 20.00
3-Yr Avg 2P FD&A Costs (US$/BOE)1
GTE ROACE expected to trend toward long- 18.00
term internal rate of return target of 20%+ 16.00
FD&A (US$/BOE)
14.00
ROACE (%) 12.00
14%
10.00
12% 8.00
6.00
10%
4.00
8%
2.00
6% 0.00
Excluding FDC Including FDC
4%
2% Long-term Finding, Development & Acquisition
(“FD&A”) Costs of $10-15/BOE demonstrate
0%
2017 2018 the value of re-investing in GTE’s business
Gran Tierra is focused on growing value, not just growing barrels
1. Based on Dec. 31, 2018 McDaniel Reserves Report; please see press release dated Jan.29,2019 for additional information and important disclaimers. 12May 30/2019 Share Price
$1.97/share (USD)
NET ASSET VALUE
$9.11/sh
4,000 Dec.31/2018 NAV Before Tax (US$MM, US$/share)1
3,500
3,000
$3,503
$6.12/sh $1,151
2,500
2,000 $2,352
1,500 $1,422
$2.42/sh
$1,412 $482
1,000
$1.97/sh
500 $930
0
Proved Net Debt Mar.31/2019 1P NAV Probable 2P NAV Possible 3P NAV
4,000
3,500 Dec.31/2018 NAV After Tax (US$MM, US$/share)1
3,000 $6.43/sh
2,500
$4.37/sh $789 $2,470
2,000
1,500
$1,681
$1.78/sh $997
1,000 $482
$1,167 $1.97/sh
500
$685
0
Proved Net Debt Mar.31/2019 1P NAV Probable 2P NAV Possible 3P NAV
Gran Tierra shares currently trade at a significant discount; 0.3x 2P NAVBT, 0.5x 2P NAVAT per share
1. Based on pro-forma Q1 2019 net debt of $482 million, comprised of cash of $208 million, convertible notes of $112 million (net of unamortized fees; $115 million gross), high yield bonds of $579 million (net of 13
unamortized fees; $600 million gross), reserves-based credit facility of -$2 million (net of unamortized fees; $0 million gross) and number of shares of Gran Tierra's common stock outstanding at March 31, 2019 of 384.5
million. Net working capital and debt at March 31, 2019, prepared in accordance with GAAP. See appendix for “Presentation of Oil and Gas Information” and “Non-GAAP” Measures. See appendix for McDaniel Brent
oil price forecast.ACORDIONERO – ASSET OVERVIEW
ASSET DETAILS
o 100% WI Gran Tierra
o Generating free cash flow from day “0”
o 2019 drilling program includes 15 wells Acordionero
o Fault-bounded to the east / south
o West dipping steep monocline
o Producing Zones: Lisama-A and Lisama-C
YE 2018
YE 20181
Category
(MMbbl)
NPV10 BT1 76 MMBOE1
($MM) 2P WI Reserves
1P 32 840
2P 76 1,704
~22,500 BOEPD
3P 97 2,110 2019 Production Outlook2
Production has more than quadrupled since acquisition, while generating free cash flow
1. Based on McDaniel NI 51-101 Reserves Report as of December 31, 2018. 14
2. GTE 2019 internal forecast.ACORDIONERO – FIELD OVERVIEW
25,000 16.0
14.0
20,000
12.0
Oil (bbl/d) / Water (bbl/d) / Fluid (bbl/d) /
Cumulative Oil (MMbbl)
10.0
15,000
Water Injection (bbl/d)
8.0
10,000
6.0
4.0
5,000
2.0
Acordionero Field
Drilled 33
0 0.0 Producers 27
Dec/12 Dec/13 Dec/14 Dec/15 Dec/16 Dec/17 Dec/18
Injectors 4
Oil (bbl/d) Water (bbl/d) Fluid (bbl/d) Source 2
Water Inj (bbl/d) Cum Oil (bbl)
Major oil producing asset in MMV with highly economic near-term production growth engine
15ACORDIONERO – FURTHER DETAIL
o 100% working interest (operator)
NI 51-101 2017 YE 2018 YE Change
o High netback ~19° API oil
A C A C A C
o Stacked pay:
Sand Sand Sand Sand Sand Sand
Thick (~330’), permeable (200-1,300mD)
-
Overview oil pay in Lisama A&C OOIP (MMbbl) 224 55 250 62 +26 +7
- New discoveries in Lisama D (AC-8i &
Mochuelo) 1P
o Field currently powered by diesel and natural RF (%) 13 23 13 28 NC +5
gas; will shift entirely to natural gas in 2019
OOIP (MMbbl) 263 69 263 69 NC NC
o Waterflood commenced in Q4 2017
Development
o Full 2P development: 54 oil wells; 10 water 2P
Plan
injectors1 RF (%) 24 28 27 35 +3 +7
OOIP (MMbbl) 302 83 276 72 -26 -11
o Conversion of 3P and 2P reserves to 1P
Potential o Successful waterflood could increase reserves 3P
Upside materially
RF (%) 30 35 33 40 +3 +5
Acordionero delivers strong growth while generating free cash flow
1. Based on full 2P development plan, as per Dec 31, 2018 McDaniel Reserve Report 16AYOMBERO – ASSET OVERVIEW
ASSET DETAILS
o 100% WI Gran Tierra
o Highly-fractured, conventional carbonate
o Significant potential in 3 horizons
o 2019 drilling program includes 2-6 wells
o Unrisked Prospective Resources1:
Chuira
21 MMBOE (P90) & 119 MMBOE (P10)
o Producing Zones: Galembo Ayombero
YE 20182
YE 20182
Category NPV10 BT 4.6 MMBOE2
(MMbbl)
($MM) 2P WI Reserves
1P 2 22
2P 5 67 ~64 MMBOE
Estimated Unrisked Mean
3P 8 118 Prospective Resource1
Complex reservoir, significant upside to be appraised
1. Based on McDaniel NI 51-101 Prospective Resources Report.
2. Based on McDaniel NI 51-101 Reserves Report as of December 31, 2018. 17AYOMBERO – FIELD OVERVIEW
Significant Upside La Luna Depth Map Ayombero-1 Logs
o 3 wells drilled to date: similar lithologies, oil Chuira
saturations & over-pressure in Galembo Ayombero
Member of La Luna Carbonate reservoir,
indicating reservoir & structural continuity
o 600-700 ft gross reservoir, ~13% matrix
porosity, natural fracturing, permeability up
to 200 md, significant over-pressure
w/gradient = 0.88 psi/ft
o Large potential oil-in-place = 321 MMBOE,
could yield Pmean Unrisked Prospective
Resources = 64 MMBOE
o Analogous to La Paz oil field in Venezuela
(>1.0 BBOE recovered to date)
o Significant prospective resource size
could represent upside potential to
increase GTE’s total 2P reserves by 43%
Ongoing appraisal/development of Ayombero/Chuira structure planned to unlock significant resources
18AYOMBERO – COMPLEX, BUT SIGNIFICANT UPSIDE
Reservoir Challenges Next Steps Potential Oil-In-Place Map
Highly over-pressured formations Applying knowledge from similar,
have proved challenging in terms challenging reservoirs which are
of drilling & completion operations exploited successfully elsewhere
Umir formation above target zone
in the world
has proved difficult to drill and Geomechanical study addressing
case appropriate Umir formation
After encouraging initial drilling techniques
production results at Ayombero-1 Optimizing drilling equipment to
& 2, both wells offline from handle over-pressured zones
apparent solids plugging
After completion of Ayombero-3
Ayombero-3 in completion phase finished, workovers are planned
but delayed due to the challenges for both Ayombero-1 & 2
listed above
McDaniels OOIP (mmstb)
Galembo 258,515
GTE is excited about the potential of Ayombero-Chuira La Luna
Pujamana 50,566
conventional carbonate resource play, its substantial prospective Salada 11,965
resource base & inventory of future potential drilling opportunities Total 321,046
Over-pressured, naturally fractured conventional carbonate: both challenges and opportunities
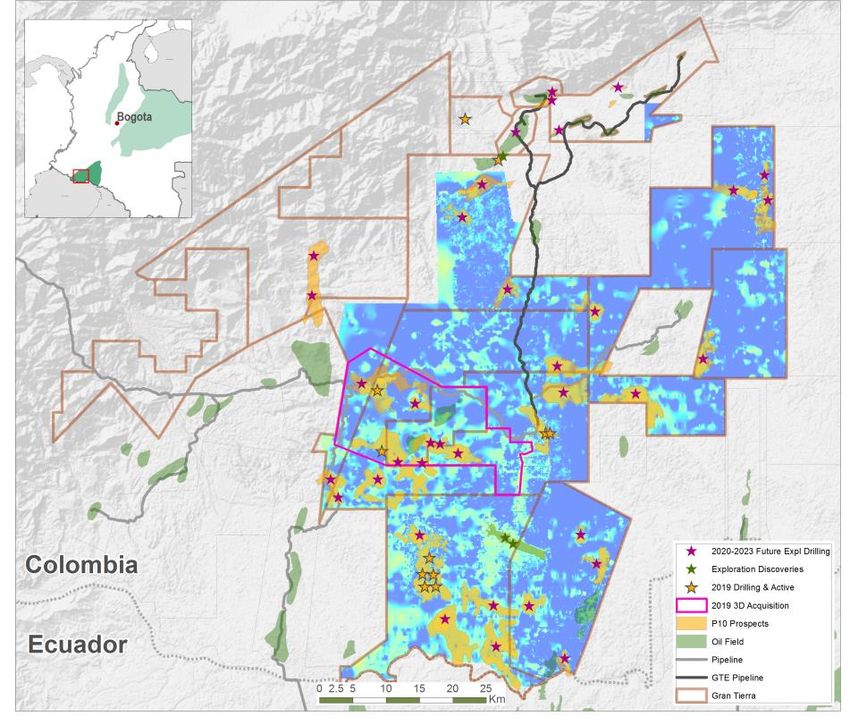
1. OOIP – original oil in place 19PUTUMAYO & ORIENTE - UNDEREXPLORED, PROVEN BASINS
Colombia’s Putumayo basin is underexplored
due to past above-ground security issues,
now mitigated by Peace Agreement
Same geology as Ecuador, where almost 6
billion bbls of oil produced1
Highly prospective geological trends in
Ecuador extend into Putumayo
In the Putumayo Basin, GTE is the largest
landholder (1.1 MM gross/1.0MM net acres),
operates 16 of 16 blocks & has substantial
seismic data base covering much of basin
In the Oriente Basin, GTE has been officially
awarded 3 blocks (100% WI) in Ecuador
(140,000 gross acres)
GTE has built a dominant position across the proven & high-potential Putumayo & Oriente Basins
1. Source: https//asb.opec.org/index.php/data-download 20PUTUMAYO BASIN SIZE OF THE PRIZE
Total Putumayo – Unrisked Mean Prospective Resources
(1,106 MMBOE)1
Structural 14%
N-Sand 12%
A-
Limestone*74%
Total Putumayo – Risked Mean Prospective Resources
(298 MMBOE) 1
Structural 8%
N-Sand 20%
A-Limestone*
72%
Dominant land position, large exploration upside, tot. unrisked mean prospective resources = 1,106 MMBOE
1. Based on July 31, 2018 McDaniel Prospective Resource Report 21
* A-Limestone does not include resources for other carbonate plays (B and M2 Limestones)WORLD-CLASS EXPLORATION UPSIDE IN COLOMBIA
GTE WI Risked Mean Prospective Resources (MMBOE)
400 Carbonate 361
350
18 16
Strat / Struc / Combo 29
300 118
25
250 59
200
150
100 214 243
50
0
A Limestone N Sand Structural La Luna (Ayombero) Combo* Structural & Combo
PUT MMV LLANOS TOTAL
1,600 GTE WI Unrisked Mean Prospective Resources (MMBOE)
Carbonate
1,419
1,400
117
1,200 Strat / Struc / Combo 132 533
64
1,000 150
800 134
600
400 822 886
200
0
A Limestone N Sand Structural La Luna (Ayombero) Combo* Structural & Combo
PUT MMV LLANOS TOTAL
Portfolio has ~360 mmboe & ~1.4 bnboe of risked and unrisked mean prospective resources, respectively
* MMV Combo includes 2 prospects in Sinu Basin 22
NOTE: Putumayo A-Limestone does not include resources for other carbonate plays (B and M2 Limestones)NEW COUNTRY ENTRY INTO ECUADOR
GTE has been officially awarded three
blocks in the Intracampos bid round
Increases GTE’s acreage position in
conventional resource plays in Ecuador
and Colombia from 1.1 to 1.2 MM gross
acres
No costs payable upon signing
Committed to drill 14 wells over the next
4 years, across the three blocks
Exploration activities scheduled to
commence in 2020, or late 2019 if
possible
Potential to construct strategic gathering
infrastructure & potentially utilize
existing infrastructure in Ecuador
GTE has created a contiguous land position in the Oriente Basin, complimenting its acreage in the Putumayo
232019 GUIDANCE1 – GROWTH WITHIN CASH FLOW
Production Guidance Capital Guidance Base
WI Production (boepd) 41,000 – 43,000 Total Capital ($MM) $320-340
Y-o-Y growth2 13 – 19%
2019 Capex Program
Cash Flow Guidance Base Seismic &
Brent ($/bbl) $65 Studies, $25-
Cash Flow3 ($MM) $375-395 30MM
Facilities,
Brent $85-90MM
Expense & Operating Netback Guidance ($/boe) $65.00/bbl
Transportation & Quality Discount $11.00 - $13.00
Royalties $9.00 - $10.00
Development
Operating Costs $9.00 - $10.00 $130-135MM
Exploration,
Transportation Costs (Pipeline) $1.50 - $2.00 $80-85MM
Operating Netback4 $30.00 - 34.50
General and Administrative $1.75 - $2.50 2019 capital budget expected
Interest and Financing $1.50 - $2.00
to positively impact 2019YE reserves,
2019 exit rate & 2019 production
Taxes $3.00 - $4.00
GTE forecasts significant 2019 production growth (13% to 19%), funded by cash flow
1. See Gran Tierra press release dated February 27, 2019 for more details and disclaimers 24
2. YoY growth calculated as 2019 WI production guidance range over 2018 average WI production of 36,209 BOEPD
3. “Cash flow” means the GAAP measure “net cash provided by operating activities”
4. Operating netback is a non-GAAP measure and does not have a standardized meaning under GAAP; refer to "Non-GAAP Measures" in press release dated Feb.27/2019 for a description; estimated 2019 operating
netback is calculated by subtracting 2019 forecasts of transportation and quality discount, royalties, operating costs and pipeline transportation from the 2019 budget Brent oil price forecast as outlined in the table above2019 CAPITAL PROGRAM DETAILS
Acordionero CPF Expansion
Development Capital ($215-225 MM; ~65%)
Acordionero (MMV) New truck
loading facility
o Drill 14 wells: 9 development & 5 water injection
o Ongoing CPF expansion
o Expand gas-to-power project to 20MW
o Initiate natural gas injection project
Putumayo Basin & Minor Fields
o Drill 11-13 development wells
o Drill 1-3 injection/water source wells
o 7-8 workovers, reactivations &/or stimulations
Exploration Capital ($105-115 MM; ~35%)
Putumayo
o Drill 4-5 exploration wells
o 3D seismic surveys (340 km2) New storage
tanks & processing
MMV equipment under
o Drill 1-2 exploration wells construction
Llanos
o Drill 1 exploration well
GTE’s 2019 capital program is expected to be fully funded by cash flow
25SUSTAINABLE BUSINESS
Self-Funding Business Low Debt Levels
Cash Flow & Uses @ $65/bbl Brent 2019F net debt1 to cash flow2 of
450
1.0-1.3x @ $65/bbl Brent
400
No near-term maturities:
350
300 Debt Maturity Profile
250
$ MM
200
$300
150
100 $300 $300
50 $115
0 2019 2020 2021 2022 2023 2024 2025 2026 2027
Cash Flow Sustaining Discretionary Discretionary Buybacks
Capital 3 Capex - Capex -
Development Exploration Senior Notes Convertible Debt
Drawn Bank Facility Undrawn Bank Facility
Gran Tierra has created a self-funded, sustainable business model
1. “Net debt” (non-GAAP) is an estimate of 2019 year-end debt less cash plus working capital deficit less cash. See “Presentation of Oil and Gas Information” and “Non-GAAP Measures” in appendix for more information. 26
2. “Cash flow” means the GAAP measure “net cash provided by operating activities”.
3. Sustaining capital of ~$100MM is estimated level of investment to hold production flat in 2019 at 2018 average level.ENVIRONMENTAL, SOCIAL & GOVERNANCE EXCELLENCE
SAFETY GHG EMISSIONS NATURAMAZONAS LICENSING
In May 2019, GTE reached an Voluntary projects underway to Partnership with Conservation GTE has optimal performance
important safety milestone with no eliminate routine flaring and use International, largest voluntary O&G within existing regulatory
Lost Time Injury for 7 million gas to generate power will reduce industry-funded conservation project in framework. Opportunity to work
person-hours, all during very active emissions by 9000 tonnes of Colombia. GTE funding $11MM over with new government to effect
years of record production & increasing CO2 per year 5 years, to sequester 8.7 million regulatory changes to make the
drilling and development activities tonnes of CO2 over project lifetime system more efficient
GTE adheres to the highest standards of safety, environmental, social and governance practices
27REASONS TO INVEST IN GRAN TIERRA
Quality assets with low declines
Focused on low cost, conventional oil & gas
developments High-Quality Profitable
Assets Production
Access to infrastructure with the ability to Growth
monetize at Brent pricing
CREATE
LONG-TERM
World class exploration portfolio
SHAREHOLDER
VALUE
Exploration and development funded by cash flow
$2.1 billion1 of free cash flow overCostayaco
from existing reserves
the next 5 years
Sustainable
Potential for share buybacks
Moqueta
High-Impact
Exploration
Business
Model
Strong balance sheet
Sustainable business model, expected to be fully funded by forecasted cash flows
1. Free Cash flow means the GAAP line item “net cash provided by operating activities”, less projected total 2P capital costs for 2019-2023 from McDaniel 2018 YE Reserves Report. Includes Suroriente W.I. of 52% after Vetra’s W.I. acquisition in March 2019 and VMM-2
W.I. of 100% after the acquisition of an additional 20% in April 2019. 28Appendix
PUTUMAYO BASIN - GEOLOGY OVERVIEW
   PROVEN OIL
   RESERVOIR                                                                                                                                     API      Net Pay   Porosity   Permeability
                                                                                      Reservoir                 Play Type
                                                                                                                                              (degrees)     (ft)      (%)         (mD1)

                                                                                      N Sand                 Stratigraphic                     15-25       5-40      10-30       10-1000

                                                                                       M2                                                                                        Matrix +
                                                                                                             Stratigraphic                     25-35      10-100     3-10
                                                                                    Limestone                                                                                   Fractures

                                                                                                             Stratigraphic
                                                                                                                                                                                 Matrix +
                                                                                  A Limestone                Conventional                      25-35      10-150     3-10
                                                                                                                                                                                Fractures
                                                                                                              Resource

                                                                                                           Stratigraphic &
                                                                                      U Sand                  Structural
                                                                                                                                               15-30      10-80      10-25       10-1000

                                                                                      T Sand                    Structural                     20-30      10-80      10-25       10-1000

                                                                                     Caballos                   Structural                     20-30      20-100     15-30       10-1000

      Limestone & Sandstone                              Sandstone
      Reservoir                                          Reservoir
       Shale                                             Limestone
       Seal                                              Reservoir / Source

                              The Putumayo Basin is underexplored, Gran Tierra is at the forefront
                1.mD= millidarcys = a measure of permeability                                                                                                                               30
                Note: Villeta Fm in the Putumayo equivalent geologically to the Napo Fm in Ecuador; Caballos Fm equivalent to the Hollin Fm
PUTUMAYO N SAND PLAY
GTE has identified 27 N Sand prospects
WI mean prospective resources:
– 134 MMBOE (unrisked)/59 MMBOE (risked)1
N Sand relatively low risk for an
exploration play (McDaniel estimated
average chance of success = 50%)1
Of 82 exploration wells in Putumayo
with structural targets, 47 encountered
N Sand, of which 43 found oil charge
(53% chance of finding oil-saturated N Sand)2
N Sand readily identifiable on both 2D
and 3D seismic, which has allowed GTE
to map prospects across much of the
Putumayo
GTE’s extensive seismic database is
important competitive advantage in play
Putumayo N Sand play is an important component of GTE’s Putumayo exploration portfolio
1. July 31, 2018 McDaniel Resource Report 31
2. Internal evaluation by GTE Exploration TeamHEDGING SUMMARY
Oil price 2019 hedges
Period and Type of Instrument Volume (bopd) Reference Purchased Put ($/bbl) Sold Call ($/bbl)
Collars: April 1, 2019 to December 31, 2019 5,000 Brent $60.00 $71.50
Period and Type of Instrument Volume (bopd) Reference Purchased Put ($/bbl) Deferred Premium Put ($/bbl)
Put: April 1, 2019 to December 31, 2019 5,000 Brent $60.00 $2.38
FX 2019 hedges
Volume per month
Period and Type of Instrument Reference Weighted average floor (COP) Weighted average cap (COP)
(Millions COP)
Collars: May 1, 2019 to December 31, 2019 22,500 USD/COP 3,019 3,446
32MCDANIEL 2018 & 2019 PRICE DECKS
Brent Comparison (US$/bbl)
McDaniel, Jan 1, 2019 McDaniel, Jan 1, 2018
SEC Brent, Jan 1, 2019 SEC Brent, Jan 1, 2018
85
80
75
70
65
60
55
50
45
40
2019 2020 2021 2022 2023 2024 2025 2026 2027
33NON-GAAP MEASURES
EBITDA
EBITDA, as presented, is net loss adjusted for DD&A expenses, asset impairment, interest expense and income tax recovery or expense. Management uses this financial measure to
analyze performance and income or loss generated by Gran Tierra's principal business activities prior to the consideration of how non-cash items affect that loss, and believes that this
financial measure is also useful supplemental information for investors to analyze performance and the Company's financial results. A reconciliation from net loss to EBITDA is as
follows:
Three Months Ended Year Ended
March 31, 2019 Dec 31, 2018 Dec 31, 2017 Dec 31, 2016
EBITDA - Non-GAAP Measure ($000s)
Net Income (loss) 1,979 102,616 -31,708 -465,565
Adjustments to reconcile net income to EBITDA
DD&A expenses 62,921 197,867 131,335 139,535
Asset impairment - - - 616,649
Interest expense 7,938 27,364 13,882 14,145
Income tax (recovery) expense 19,686 48,871 69,038 -184,669
EBITDA 92,524 376,718 182,547 120,095
34NON-GAAP MEASURES
Funds Flow from Operations
Funds flow from operations, as presented, is net cash provided by operating activities adjusted for net change in assets and liabilities from operating activities and cash settlement of
asset retirement obligation. Management uses this financial measure to analyze liquidity and cash flows generated by Gran Tierra's principal business activities prior to the consideration
of how changes in assets and liabilities from operating activities and cash settlement of asset retirement obligation affect those cash flows, and believes that this financial measure is
also useful supplemental information for investors to analyze Gran Tierra's liquidity and financial results. A reconciliation from net cash provided by operating activities to funds flow from
operations is as follows:
Three Months Ended Year Ended
March 31, 2019 December 31, 2018 December 31, 2017 December 31, 2016
Funds Flow From Operations - Non-GAAP
Measure ($000s)
Net Income (loss) 1,979 102,616 -31,708 -465,565
Adjustments to reconcile net income (loss) to
funds flow from operations
DD&A expenses 62,921 197,867 131,335 139,535
Asset impairment - - 1,514 616,649
Deferred tax expense (recovery) 8323 4,968 44,716 -204,791
Stock-based compensation expense 1,727 8,299 9,775 6,339
Amortization of debt issuance costs 838 3,183 2,415 5,691
Cash settlement of RSUs - -360 -564 -1234
Unrealized foreign exchange loss (gain) -3,283 11,511 837 -1,428
Financial instruments loss 3,165 12,296 15,929 10,279
Cash settlement of financial instruments -220 -33,931 1,563 438
Loss on sale and (gain) on acquisition - - 44,385 -929
Funds flow from operations (non-GAAP) 75,450 306,449 220,197 104,984
35PRESENTATION OF OIL & GAS INFORMATION
BOEs (Barrel of Oil Equivalent) may be misleading particularly if used in isolation. A BOE conversion ratio of 6 thousand cubic feet of gas to 1 barrel of oil is based on an energy equivalency conversion method
primarily applicable at the burner tip and does not represent a value equivalency at the wellhead. In addition, given that th e value ratio based on the current price of oil as compared with natural gas is significantly
different from the energy equivalent of six to one, utilizing a BOE conversion ratio of 6Mcf:1bbl would be misleading as an i ndication of value. Unless otherwise specified, in this presentation, all production is reported
on a working interest (“WI”) basis (operating and non-operating) before the deduction of royalties payable. Per BOE amounts are based on WI sales before royalties. For per BOE amounts based on NAR production,
see our Annual Report on Form 10-K filed February 27, 2018.
Well test results should be considered as preliminary and not necessarily indicative of long-term performance or of ultimate recovery. Well log interpretations indicating oil and gas accumulations are not necessarily
indicative of future production or ultimate recovery. If it is indicated that a pressure transient analysis or well-test interpretation has not been carried out, any data disclosed in that respect should be considered
preliminary until such analysis has been completed.
In this presentation:
o “reserves” are estimated remaining quantities of oil and natural gas and related substances anticipated to be recoverable from known accumulations, as of a given date, based on: (a) analysis of drilling,
geological, geophysical and engineering data; (b) use of established technology; and (c) specified economic conditions, which are generally accepted as being reasonable. Reserves are classified according to
degree of certainty associated with estimates.
o “proved reserves” or “1P” are those reserves that can be estimated with a high degree of certainty to be recoverable. It is likely that actual remaining quantities recovered will exceed estimated proved reserves;
o “proved developed reserves” are those proved reserves that are expected to be recovered from existing wells and installed facilities or, if facilities have not been installed, that would involve a low expenditure
(e.g., when compared to cost of drilling a well) to put reserves on production. Developed category may be subdivided into producing and non-producing;
o “proved undeveloped reserves” or “PUD” are those proved reserves expected to be recovered from known accumulations where a significant expenditure (e.g., when compared to cost of drilling a well) is
required to render them capable of production.
o “probable reserves” or “2P” are those unproved reserves that are less certain to be recovered than proved reserves. It is equally likely that actual remaining quantities recovered will be greater or less than sum
of estimated proved plus probable reserves. Probable reserves may be developed or undeveloped (“PPUD”).
o “possible reserves” or “3P” are those additional reserves that are less certain to be recovered than probable reserves. There is a 10% probability that quantities actually recovered will equal or exceed sum of
proved plus probable plus possible reserves. Possible reserves may be developed or undeveloped (“PPPUD”).
o “gross” means: (a) in relation to the Company’s interest in production or reserves, its “company gross” production or reserves, whi ch represents the Company’s working interest (operating or non-operating)
share before deduction of royalties and without including any royalty interests of the Company; (b) in relation to wells, total number of wells in which the Company has an interest; and (c) in relation to properties,
total area of properties in which the Company has an interest.
o “NAV” means net asset value.
o “NPV” means net present value.
o “prospective resources” are quantities of petroleum estimated, as of a given date, to be potentially recoverable from undiscovered accumulations by application of future development projects. There is no
certainty that any portion of the prospective resources will be discovered. If discovered, there is no certainty that it will be commercially viable to produce any portion of the prospective resources. Prospective
resources have both an associated chance of discovery and a chance of development. Not all exploration projects will result in discoveries. Chance that an exploration project will result in discovery of petroleum
is referred to as “chance of discovery.” Thus, for an undiscovered accumulation, chance of commerciality is product of two ri sk components: chance of discovery and chance of development.
o “Net debt” based on Q1 2019 net debt of $482 million, comprised of cash of $33 million, convertible notes of $112 million (net of unamortized fees; $115 million gross), high yield bonds of $290 million (net of
unamortized fees; $300 million gross), and $112 million drawn on the reserves-based credit facility (net of unamortized fees; $114 million gross), and number of shares of Gran Tierra's common stock
outstanding at March 31, 2019 of 384.5 million. Net working capital and debt at March 31, 2019, prepared in accordance with GAAP. See appendix for “Presentation of Oil and Gas Information” and “Non-GAAP”
Measures.
36PRESENTATION OF OIL & GAS INFORMATION
Reserves and Prospective Resources Information
Unless otherwise noted, estimates of the Company’s reserves, net present value of future net revenue attributable to Company’s reserves and prospective resources relate solely to the Company’s Colombia reserves
and prospective resources and are based upon reports prepared by McDaniel & Associates Consultants (“McDaniel”), the Company’s independent qualified reserves evaluator and auditor, in accordance with NI 51-
101 – Standards for Oil and Gas Activities (“NI 51-101”) and the Canadian Oil and Gas Evaluation Handbook (“COGEH”); in the case of reserves, dated December 31, 2018 (the “McDaniel Reserve Report”), and in
the case of prospective resources, dated July 31, 2018 (the “McDaniel Prospective Resource Report”). Please see Gran Tierra’s press release dated January 29, 2019 for additional important information and
disclaimers about the McDaniel Reserve Report and the McDaniel Resource Report.
Gran Tierra's Statement of Reserves Data and Other Oil and Gas Information on Form 51-101F1 dated effective as at December 31, 2018 , which will include further disclosure of its oil and gas reserves and other oil
and gas information in accordance with NI 51-101 forming the basis of this press release, will be available on SEDAR at www.sedar.com on or before February 27, 2019.
Estimates of the Company’s prospective resources in the Ayombero field are prepared by McDaniel in accordance with NI 51-101 and COGEH as of April 30, 2018. For positive and negative factors associated with
the Ayombero field’s prospective resources, as well as other relevant information, please see the Company’s press release dated May 1, 2018.
Estimates of reserves provided in this presentation are estimates only and there is no guarantee that estimated reserves will be recovered. Actual reserves may be greater than or less than estimates provided in this
presentation and differences may be material. Estimates of net present value of future net revenue attributable to Company’s reserves do not represent fair market value and there is uncertainty that net present value
of future net revenue will be realized and such estimates of reserves and future net revenue for individual properties may not reflect same confidence level as estimates of reserves and future net revenue for all
properties, due to effect of aggregation. There is no assurance that forecast price and cost assumptions applied by McDaniel in evaluating Gran Tierra’s reserves will be attained and variances could be material.
References to thickness of “oil pay” or of a formation where evidence of hydrocarbons has been encountered is not necessarily an indicator that hydrocarbons will be recoverable in commercial quantities or in any
estimated volume.
Prospective resources are those quantities of petroleum estimated, as of a given date, to be potentially recoverable from undiscovered accumulations by application of future development projects. Prospective
resources have both an associated chance of discovery and a chance of development. Not all exploration projects will result in discoveries. The chance that an exploration project will result in the discovery of
petroleum is referred to as the "chance of discovery." Thus, for an undiscovered accumulation the chance of commerciality is the product of two risk components-the chance of discovery and the chance of
development. There is no certainty that any portion of the Prospective resources will be discovered. If discovered, there is no certainty that it will be commercially viable to produce any portion of the prospective
resources.
The estimates of prospective resources provided in this presentation are estimates only and there is no guarantee that the estimated prospective resources will be recovered. Actual resources may be greater than or
less than the estimates provided in this in this press release and the differences may be material. There is no assurance that the forecast price and cost assumptions applied by McDaniel in evaluating Gran Tierra's
prospective resources will be attained and variances could be material. There is no certainty that any portion of the prospective resources will be discovered. If discovered, there is no certainty that it will be
commercially viable to produce any portion of the prospective resources.
Estimates of prospective resources are by their nature more speculative than estimates of proved reserves and would require substantial capital spending over a significant number of years to implement recovery.
Actual locations drilled and quantities that may be ultimately recovered from our properties will differ substantially. In addition, we have made no commitment to drill, and likely will not drill, all of the drilling locations
that have been attributable to these quantities.
The following classification of prospective resources is used in this presentation:
o Mean Estimate represents the arithmetic average of the expected recoverable volume. It is the most accurate single point representation of the volume distribution.
Please see Gran Tierra’s press release dated January 29, 2019 for additional information re: the following classifications for prospective resources:
o Low Estimate means there is at least a 90 percent probability (P90) that the quantities actually recovered will equal or exceed the low estimate.
o Best Estimate means there is at least a 50 percent probability (P50) that the quantities actually recovered will equal or exceed the best estimate.
o High Estimate means there is at least a 10 percent probability (P10) that the quantities actually recovered will equal or exceed the high estimate.
37PRESENTATION OF OIL & GAS INFORMATION
For a discussion of Gran Tierra’s interest in the prospective resources, the location of the prospective resources, the product type reasonably expected, the risks and level of uncertainty associated with recovery of
the resources, the significant positive and negative factors relevant to the estimate of the prospective resources, a description of the applicable projects maturity sub-categories and other relevant information
regarding the prospective resources estimates, please see the GTE NI 51-101F1 and its press release dated January 29, 2019.
Oil and Gas Metrics
This presentation contains a number of oil and gas metrics, including finding, development and acquisition (“FD&A”) costs, NAV per share, operating netback, reserve life index, reserves per share and reserves
replacement, which do not have standardized meanings or standard methods of calculation and therefore such measures may not be comparable to similar measures used by other companies and should not be
used to make comparisons. Such metrics have been included herein to provide readers with additional measures to evaluate the Company's performance; however, such measures are not reliable indicators of the
future performance of the Company and future performance may not compare to the performance in previous periods.
FD&A costs are calculated as estimated exploration and development capital expenditures in Colombia, divided by the applicabl e reserves additions both before and after changes in FDC. The FD&A cost calculation
also includes the capital expenditures, reserves, and FDC related to acquisitions and divestitures in the total amounts. The calculation of FD&A costs incorporates the change in FDC required to bring proved
undeveloped and developed reserves into production. The aggregate of the exploration and development costs incurred in the fi nancial year and the changes during that year in estimated FDC, including those
relating to acquisitions and dispositions, may not reflect the total FD&A costs related to reserves additions for that year. Management uses FD&A costs per BOE as a measure of its ability to execute its capital
program and of its asset quality.
NAV per share is calculated as before tax NPV discounted at 10% plus estimated net working capital deficit and debt, excluding ri sk management assets and liabilities and investment in PetroTal Corp. shares, and
number of shares of Gran Tierra's common stock outstanding. Management uses NAV per share as a measure of the relative change of Gran Tierra's NAV over its outstanding common stock over a period of time.
Operating netback is calculated as described in this presentation. Management believes that operating netback is a useful supplemental measure for investors to analyze financial performance and provide an
indication of the results generated by Gran Tierra's principal business activities prior to the consideration of other income and expenses.
Cash flow means the GAAP line item “net cash provided by operating activities”.
Reserve life index is calculated as reserves in the referenced category divided by the referenced estimated Colombia production. Management uses this measure to determine how long the booked reserves will last
at current production rates if no further reserves were added.
Reserves replacement is calculated as reserves in the referenced category divided by estimated annual Colombia production. Management uses this measure to determine the relative change of its reserve base
over a period of time.
ROCE is calculated as earnings before interest and taxes (“EBIT”; annualized, if the period is other than one year) divided by capital employed (total assets minus cash and current liabilities). For 2017, the
impairment associated with the sale of the legacy businesses in Peru and Brazil is excluded from EBIT.
38PRESENTATION OF OIL & GAS INFORMATION
Disclosure of Reserves and Resources Information and Cautionary Note to U.S. Investors
Unless expressly stated otherwise, all estimates of proved, probable and possible reserves and related future net revenue and prospective resources disclosed in this presentation have been prepared in accordance
with NI 51-101. Estimates of reserves and prospective resources and future net revenue made in accordance with NI 51-101 will differ from corresponding estimates prepared in accordance with applicable U.S.
Securities and Exchange Commission (“SEC”) rules and disclosure requirements of the U.S. Financial Accounting Standards Board (“FASB”), and those differences may be material. NI 51-101, for example, requires
disclosure of reserves and related future net revenue estimates based on forecast prices and costs, whereas SEC and FASB standards require that reserves and related future net revenue be estimated using
average prices for the previous 12 months. In addition, NI 51-101 permits the presentation of reserves estimates on a “company gross” basis, representing Gran Tierra’s working interest share before deduction of
royalties, whereas SEC and FASB standards require the presentation of net reserve estimates after the deduction of royalties and similar payments. There are also differences in the technical reserves and resources
estimation standards applicable under NI 51-101 and, pursuant thereto, the COGEH, and those applicable under SEC and FASB requirements. The SEC requirements strictly prohibit the Company from including
prospective resources in filings with the SEC.
In addition to being a reporting issuer in certain Canadian jurisdictions, Gran Tierra is a registrant with the SEC and subject to domestic issuer reporting requirements under U.S. federal securities law, including with
respect to the disclosure of reserves and other oil and gas information in accordance with U.S. federal securities law and applicable SEC rules and regulations (collectively, “SEC requirements”). Disclosure of such
information in accordance with SEC requirements is included in the Company's Annual Report on Form 10-K and in other reports and materials filed with or furnished to the SEC and, as applicable, Canadian
securities regulatory authorities. The SEC permits oil and gas companies that are subject to domestic issuer reporting requirements under U.S. federal securities law, in their filings with the SEC, to disclose only
estimated proved, probable and possible reserves that meet the SEC’s definitions of such terms. Gran Tierra has disclosed estimated proved, probable and possible reserves in its filings with the SEC. In addition,
Gran Tierra prepares its financial statements in accordance with United States generally accepted accounting principles, which require that the notes to its annual financial statements include supplementary
disclosure in respect of the Company’s oil and gas activities, including estimates of its proved oil and gas reserves and a standardized measure of discounted future net cash flows relating to proved oil and gas
reserve quantities. This supplementary financial statement disclosure is presented in accordance with FASB requirements, which align with corresponding SEC requirements concerning reserves estimation and
reporting.
The Company's before tax net present values of 2P reserves prepared in accordance with NI 51-101 and COGEH and discounted at 10% ("PV-10") differs from its US GAAP standardized measure because SEC and
FASB standards require that (i) the standardized measure reflects reserves and related future net revenue estimated using average prices for the previous 12 months, whereas NI 51-101 reserves and related future
net revenue are estimated based on forecast prices and costs and that (ii) the standardized measure reflects discounted future income taxes related to the Company's operations. The Company believes that the
presentation of PV-10 is useful to investors because it presents (i) relative monetary significance of its oil and natural gas properties regardless of tax structure and (ii) relative size and value of its reserves to other
companies. The Company also uses this measure when assessing the potential return on investment related to its oil and natural gas properties. PV-10 and the standardized measure of discounted future net cash
flows do not purport to present the fair value of the Company's oil and gas reserves. The Company has not provided a reconcil iation of PV-10 to the standardized measure of discounted future net cash flows because
it is impracticable to do so.
Investors are urged to consider closely the disclosures and risk factors in the Company's Annual Report on Form 10-K, Quarterly Reports on Form 10-Q and in the other reports and filings with the SEC,
available from the Company's website. These forms can also be obtained from the SEC’s website at www.sec.gov.
39You can also read