Credit Investor Presentation - November 2018 - Epiroc
←
→
Page content transcription
If your browser does not render page correctly, please read the page content below
Credit Investor Presentation
November 2018
Some statements herein are forward-looking and the actual outcome
could be materially different. In addition to the factors explicitly
commented upon, the actual outcome could be materially and
adversely affected by other factors such as the effect of economic
conditions, exchange-rate and interest-rate movements, political risks,
the impact of competing products and their pricing, product
development, commercialization and technological difficulties, supply
disturbances, and major customer credit losses
Today’s presenters
                          •   Born in 1962, Anders Lindén is Senior Vice President Controlling and Finance (CFO) of Epiroc since 2017
        Anders Lindén
          Senior Vice     •   Anders Lindén has previously been Vice President Business Control of Atlas Copco’s Mining and Rock
           President          Excavation Technique business area
        Controlling and
        Finance (CFO)     •   Anders Lindén holds a B.Sc. in Economics and Business Administration from the Stockholm School of
                              Economics, Sweden

        Mattias Olsson    •   Born in 1968, Mattias Olsson is Senior Vice President Corporate Communications of Epiroc since 2018
         Senior Vice
                          •   Mattias Olsson has previously been Head of Investor Relations at Assa Abloy AB and Vice President Investor
          President           Relations at Atlas Copco
          Corporate
        Communication     •   Mattias Olsson holds an M.Sc. in Business Administration from the University of Linköping, Sweden

                          •   Born in 1971, Anna Westerlund is Vice President Group Treasury of Epiroc since 2017
       Anna Westerlund
        Vice President    •   Anna Westerlund has previously been Head of Business Control of Atlas Copco Financial Solutions AB
        Group Treasury
                          •   Anna Westerlund holds a B.Sc. in Business Administration and Economics from Luleå University of Technology,
                              Sweden

                                                                                                 Confidential | © 2018 by Epiroc. All rights reserved.   3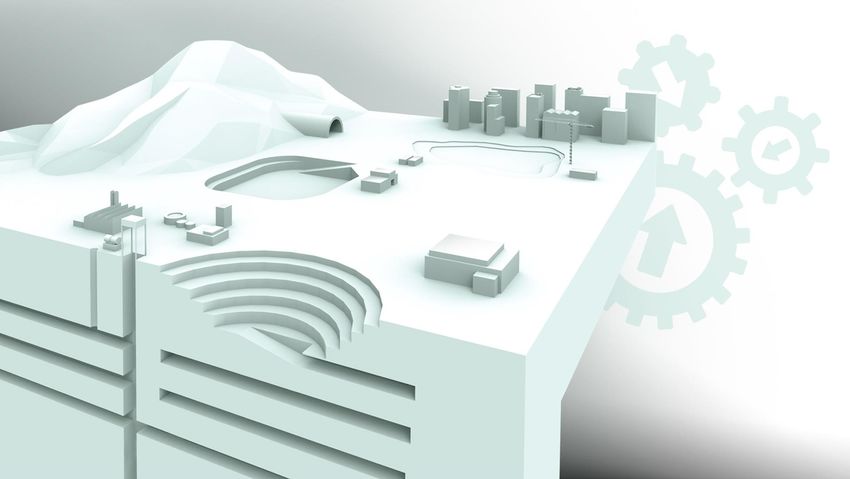
Agenda

1   Introduction to Epiroc                      4
2   Epiroc in detail                            7
3   Financial overview                          17
4   Credit highlight and transaction overview   28
5   Appendix                                    33

                                                     © 2018 by Epiroc. All rights reserved.   4
Epiroc in brief
A leading provider of solutions for rock drilling, excavation, demolition and recycling

• Epiroc’s heritage dates back to 1873 as part
  of the Atlas Copco Group, until June 18,
  2018 when Epiroc was distributed to the
  shareholders of Atlas Copco and listed on
  the stock exchange
• Serving customers in selected niches of the
  global mining, natural resources and
  infrastructure industries
• Annual revenues of SEK 31.4 billion1)
• Operating profit of SEK 5.9 billion1)
• More than 13,000 passionate people
  supporting and collaborating with customers
  in more than 150 countries
1)   2017 reported                                                         © 2018 by Epiroc. All rights reserved.   5
Long history of innovation
Strong innovation track record and competitive advantage with best-in-class technologies
                                                          Selected innovations and revolutionizing technologies

              1905                      1930-1936                          1963 2016                    2005                              2013                           2018

    First rock drill          The Swedish method                    Rig mounted                     Silent drills            Battery-powered equipment                    Digital mine
First rock drill produced   The revolutionizing Swedish           hydraulic breaker        The first almost silent surface      The development of the              Automation and digital
    soon followed by          Method was introduced,            Rig-mounted hydraulic       drill was launched, enabling       battery-powered vehicles           solutions enable connected
 Cyklop, a lightweight,      meaning that lighter and         breaker patented, changing      work around the clock in                  started                       equipment. Second
   handheld rock drill      mobile equipment was used           the demolition industry      densely populated areas                                              generation battery-powered
                                requiring less labor                                                                                                                   vehicles launched

            As a result of Epiroc’s long heritage and strong industry know-how, the company currently manages a substantial IP
                      portfolio comprising approximately 1,450 patents and more than 900 individual trademark rights

                                                                                                                                     Confidential | © 2018 by Epiroc. All rights reserved.   6
Agenda

1   Introduction to Epiroc                      4
2   Epiroc in detail                            7
3   Financial overview                          17
4   Credit highlight and transaction overview   28
5   Appendix                                    33

                                                     © 2018 by Epiroc. All rights reserved.   7
Epiroc’s key application areas
A leading provider of solutions for rock drilling, excavation, demolition and recycling

                            Mining and natural resources                              Orders received by customer category1)
      Underground               Surface                       Geotechnical, well
                                                Exploration
        mining                  mining                        drilling, oil and gas
                                                                                      Infrastructure                                   Mining
                                                                                        and other                                       70%
                                                                                           30%

                                     Infrastructure                                   Mining orders received by commodity2)
                              Surface civil                                                                   Other
       Underground                                              Deconstruction                         Coal
                            engineering and      Quarrying                                                    10%
     civil engineering                                           and recycling                         4%                       Copper
                           urban development
                                                                                             Platinum                            25%
                                                                                                3%
                                                                                                                                     Iron
                                                                                                                                      6%
                                                                                               Gold                                Zinc
                                                                                               34%                                 2%
                                                                                                                          Nickel, Lead
                                                                                                                              16%

1)   Q1-Q3 2018 reported                                                                                              © 2018 by Epiroc. All rights reserved.   8
2)   2017 reported
Epiroc’s key strengths
Epiroc demonstrates a unique value proposition

                         Leadership in attractive, structural growth niches
                     1   in the mining and infrastructure markets

                     2   Strong and proven operating model

                     3    Resilience driven by high aftermarket exposure

                     4    Driving the future in intelligent mining and infrastructure

                     5    Value creation potential as a standalone company

                                                                                        © 2018 by Epiroc. All rights reserved.   9
Characteristics of Epiroc’s addressed markets
Driving growth through solving our customers’ key challenges
                   End-market trends                              Customer priorities

                Growth in resource demand                              Lower costs
                                                       $

              Urban infrastructure investment                       Higher productivity

        Environmental, health and safety regulations       More advanced and efficient equipment

             Shift towards underground mining                     Increased sustainability

                  Depletion of ore grades                         Safer work environment

                                                                                 © 2018 by Epiroc. All rights reserved.   10
Characteristics of Epiroc’s addressed markets
Addressing attractive niches of the mining and infrastructure markets
Key characteristics of addressed markets Impact on productivity and
performance
Equipment
Performance-critical technology
✓
market
characteristics
High productivity impact relative to
customers’ expenditures ✓
Requirement for customer closeness
✓
Aftermarket
characteristics
Significant service requirements over
equipment lifecycle ✓
Service intensity
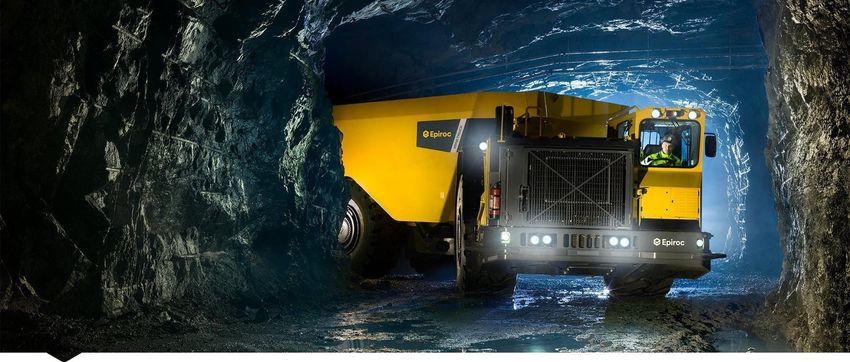
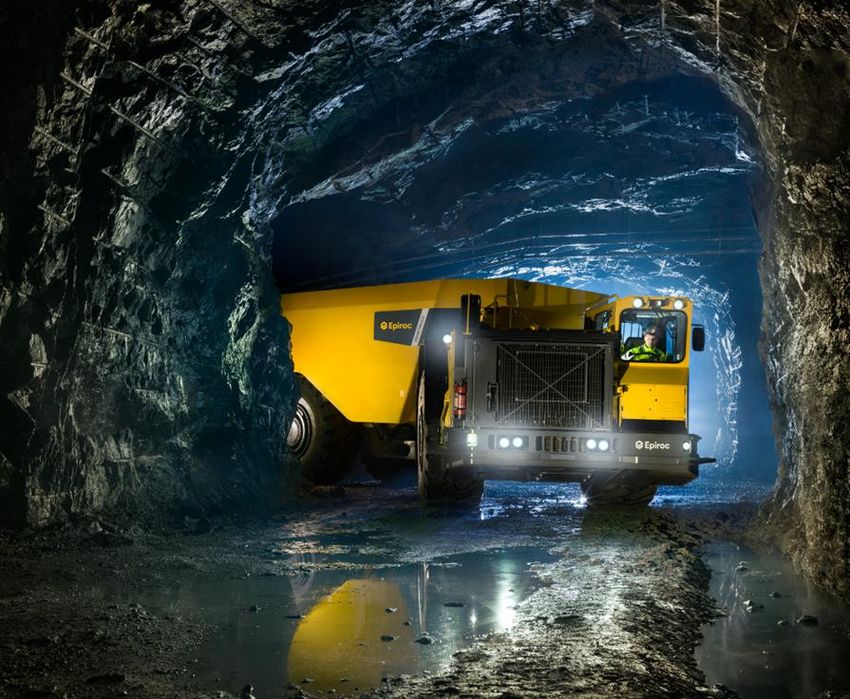
© 2018 by Epiroc. All rights reserved. 11Products and services
World-class offering to improve customer productivity
Underground equipment Surface drill rigs Other applications Service
Equipment & Service
74%
Rock drilling tools Hydraulic attachments and tools
Tools & Attachments Aftermarket
26%
Note: Revenues Q1-Q3 2018, reported
© 2018 by Epiroc. All rights reserved. 12Global footprint and customer base
Customer closeness through collaboration, and direct sales and service footprint
Sales coverage1) Revenue by region1) Customer revenue split2)
Asia / North
Australia America
28% 16%
22%
South
Africa / America
Middle East 12%
14%
Europe
24% Top 10 customers represent
app. 16% of sales
Territories where Epiroc has sales
1) Q1-Q3 2018 reported Confidential | © 2018 by Epiroc. All rights reserved. 13
2) 2017 reportedStrong and proven operational model
Focused business with ability to adapt quickly and effectively to changes in demand
High degree of Sharp Strong Flexible Focused and
direct sales focus on services manufacturing decentralized
and services innovation business philosophy businesses
Close and Solutions Revenues Ability to Agility through
collaborative closely targeted largely driven quickly adapt quick and
productivity to address by resilient to changes in efficient
partnerships customer aftermarket demand decision-
with customers challenges making
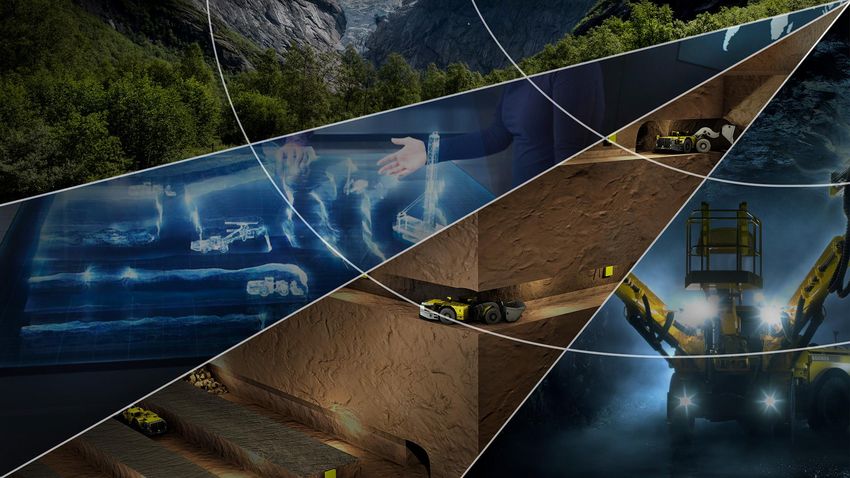
© 2018 by Epiroc. All rights reserved. 14Intelligent mining
Predictive maintenance
through telematics
Control tower for all mine operations
Optimized pit-to-port supply
chain through analytics
On-demand ventilation
Advanced analytics in remote
control center
Assure on-time delivery of
Automated, electric consumables
platooning trucks
Integrated modelling of
Traffic management Automated de-watering
geospatial information
Smart grid technology for
electricity usage
Automated navigated drill rigs
© 2018 by Epiroc. All rights reserved. 15
Drill-to-crush process optimizationToday Tomorrow Future
Emission free
Large scale mining electrified
Selective mining Real time
electrified Ventilation on demand
mining Autonomous
mining
Energy efficiency Maintenance
Hard rock
and consumables continuous
planning operation
Fleet
Connected machines management High capacity
haulage systems
Autonomous
fleet Mechanical Rock
Interoperability Excavation
Autonomous production High performance rock reinforcement
Automation Rock Excavation
© 2018 by Epiroc. All rights reserved.
Confidential | © 2018 by Epiroc. All rights reserved. 16Agenda
1 Introduction to Epiroc 4
2 Company overview 7
3 Financial overview 17
4 Credit highlight and transaction overview 28
5 Appendix 33
© 2018 by Epiroc. All rights reserved. 17Long-term financial performance
Proven “over-the-cycle” growth with resilient margins
Strong organic revenue growth1 Resilient operating margins2
180
30% 30%
25% 25%
160
CAGR
20% 20%
~ 5%
140
15% 15%
~ 3%
~ 2%
120
10% 10%
100 5% 5%
80
0% 0%
2009 2010 2011 2009
2012 20132010 2014 2011
2015 2016 2012
2017 2013 2009 2014
2010 2011 2015
2012 20132016 2014 2017
2015 2016 2017
Epiroc Atlas Copco Mining and Rock Excavation Technique
Large cap global industrials Mining and construction equipment companies
Note: Mining and Rock Excavation Technique (“MR”) is the main part of Epiroc and accounted for 92.8 % of Epiroc’s revenues and 98.2% of Epiroc’s operating profit in 2017
Large cap global multi industrials: 3M, ABB, Alfa Laval, AssaAbloy, Caterpillar, Danaher, Deere, Dover, Eaton, Emerson, Geberit, General Electric, Graco, Hitachi (only adjusted EBIT margin), Honeywell, Illinois Tool Works, Komatsu (only adjusted EBIT margin), Kone, Legrand, Mitsubishi Heavy Industries (only adjusted EBIT
margin), Nordson, Parker-Hannifin, Rockwell Automation, Rolls-Royce, Roper Technologies, Sandvik, Schindler, Schneider Electric, Siemens, SKF, Smiths Group, Trelleborg, United Technologies, Volvo, Wärtsilä, Weir and Xylem
Mining and construction equipment companies: Caterpillar, Komatsu, Metso, Sandvikand Weir
The benchmarking figures for large cap global industrials and mining and construction equipment companies represent the median of the companies in the respective group. 18
1) Indexed numbers starting year 2009 = 100. Epiroc’s starting point is aligned with Atlas Copco Mining and Rock Excavation Technique 2015
© 2018 by Epiroc. All rights reserved.
2) Adjusted EBIT margin benchmark. Epiroc’s figures correspond to operating margin – no adjustments have been madeGrowth in orders received and revenues
Strong end-market conditions reflected in Epiroc’s performance…
Orders received, revenues1 and book-to-bill2 Recent performance
40 000 160
• Orders received nearly SEK 30 billion
35 000 140
for January – September 2018
30 000 120 – Increased customer demand for
equipment and services in almost
25 000 100
all geographic regions
20 000 80 – Expansion investments in existing
mines
15 000 60
– Healthy activity in the
10 000 40 infrastructure industry
5 000 20 • Book-to-bill at 108% for
January – September 2018
0 0
2015 2016 2017 2018 Jan-Sep
Orders received, SEK million Revenue, SEK million Book to bill, %
1) 2018 and 2017 quarterly revenues are in accordance with the new revenue recognition standards in IFRS 15, applicable from January 1, 2018
2) Book-to-bill defined as orders received divided by revenues
© 2018 by Epiroc. All rights reserved. 19Orders received, revenues and operating profit
2017 – 2018 by quarter
Orders received and revenues Operating profit and margin
12 500 125% 2 500 25%
10 000 100% 2 000 20%
7 500 75% 1 500 15%
5 000 50% 1 000 10%
2 500 25% 500 5%
0 0% 0 0%
Q1 2017 Q2 2017 Q3 2017 Q4 2017 Q1 2018 Q2 2018 Q3 2018 Q1 2017 Q2 2017 Q3 2017 Q4 2017 Q1 2018 Q2 2018 Q3 2018
Operating profit, SEK million Split and incentive*, SEK million
Orders received, SEK million Revenues, SEK million Book-to-bill, %
Operating margin, % Operating margin, adj., %
*Includes one-time costs related to the split from Atlas Copco and changes in provision for share-based long-
term incentive programs.
© 2018 by Epiroc. All rights reserved. 20Strong and robust profitability
High margins reflect business model strengths
Epiroc Group and segment operating margins Recent performance
30%
• Increase in Group profitability since
24.6% 2016 primarily driven by volume growth
25%
– Group Functions established
20% – Increase in Administration, Marketing and
19.7% R&D costs since 2016 reflects higher
activity and investment in future
15%
13.6%
technologies
• Q3 2018 negatively impacted by SEK
10%
126 million one-off costs related to the
split and provisions for LTI program
5% – One-off costs corresponds to 1.3
percentage points
0%
2015 2016 2017 Q1 2018 Q2 Q3
Epiroc Group Equipment & Service Tools & Attachments
© 2018 by Epiroc. All rights reserved. 21Strong and robust profitability
Bridge from operating to net profit
Year to date 30 September Year ended December 31
SEK million 2018 2017 2017 2016 2015
• Combined financials 2015-2017
Operating profit 5,223 4,402 5,949 4,548 5,175 – Below operating profit, the numbers
are affected by the fact that Epiroc
As % of revenue 18.8% 19.2% 18.9% 16.8% 18.1%
was not consolidated as a Group
• Operating profit Q1-Q3 2018 up 19%
Net financial items (138) (52) (136) (137) (220)
– Affected by cost related to the split and
change in provision for long-term
incentive program of SEK 402 million
Profit before tax 5,085 4,350 5,813 4,411 4,955
(113)
As % of revenue 18.3% 19.0% 18.5% 16.3% 17.3%
– Effect on operating margin 1.4
percentage points (0.5)
Income tax expense (1,271) (1,156) (1,500) (1,180) (1,384) • Effective tax rate below 26%
Effective tax rate1 25.0% 26.6% 25.8% 26.8% 27.9%
Profit for the period 3,814 3,194 4,313 3,231 3,571
Basic earnings per share (SEK) 3.18 2.63 3.56 2.67 2.95
1) Income tax expense divided with Profit before tax © 2018 by Epiroc. All rights reserved. 22High operating cash flows over the cycle
Asset-light business model
Year to date 30 September Year ended 31 December
SEK million 2018 2017 2017 2016 2015
• Combined financials 2015-2017
– Some numbers, including other net
Cash flow before change in working capital 4,488 4,665 5,970 4,798 6,005
investments, are affected by the fact
Change in working capital (2,290) (246) (423) 895 417 that Epiroc was not consolidated as a
Net change in rental equipment (361) (259) (371) (291) (564) Group
Net cash from operating activities 1,837 4,160 5,176 5,402 5,858 • Cash flow from operating activities
impacted by higher working capital
Net capital expenditures1 (715) (494) (643) (522) (228) requirements in 2017 and Q1-Q3
2018, driven by volume growth
Acquisition of subsidiaries (482) (137) (137) - -
Other net investments 101 3,312 6,3232 (1,283) (2,947) • Capital expenditures
Net cash from investing activities (1,096) 2,681 5,543 (1,805) (3,175)
– Rental equipment, net
– Limited investments in other
Net cash from operating and investing
property, plant and equipment
741 6,841 10,719 3,597 2,683
activities
– Intangible assets mainly R&D and IT
Operating cash flow3 1,642 3,666 4,610 4,880 5,630
1) Net capital expenditure is the sum of Investments in property, plant and equipment, Sale of property, plant and equipment and Investments in intangible assets © 2018 by Epiroc. All rights reserved. 23
2) Mainly related to a reduction of funds placed with the Atlas Copco cash-pool
3) Operating cash flow is cash flow from operations and cash flow from investing activities, excluding company acquisitions/divestments as well as other adjustments. Other adjustments are mainly changes in the cash-pool with Atlas Copco and
currency hedges of loansStrong financial position
Provides flexibility and a strong foundation
Year to date Year ended
SEK million September 30, 2018 December 31, 2017
• Net debt1 as of September 30, 2018 of
SEK 3,146 million
Interest-bearing loans, current and non-current 6,883 7,058
– Net debt/EBITDA 0.39x
Post-employment benefits 212 181
• Financing arrangements
Other financial assets - 7
– SEK 6 billion Bridge facility, where-of
Cash and cash equivalents (3,949) (1,808)
SEK 5 million is utilized
Net debt 3,146 5,423 – SEK 4 billion Revolving credit facility
– SEK 2 billion Commercial paper
Net debt/EBITDA 0.39 0.75
• Epiroc has made share buy-backs to
hedge the long term incentive program
Total equity 17,406 12,047 for SEK 1.1 billion during Q3 2018.
Net debt/equity 18% 45%
1) Net debt consists of interest-bearing liabilities and post-employment benefits, adjusted for the fair value of interest rate swaps, less cash and cash equivalents and certain other financial receivables. © 2018 by Epiroc. All rights reserved. 24Balance sheet
SEK million Sep 30, 2018 Sep 30, 2017* Dec. 31, 2017* • Funding in place, reflected in balance
Intangible assets 3,532 3,076 3,121 sheet as per Sep. 30, 2018
Rental equipment 1,277 1,220 1,215 • Higher working capital, driven by
Other non-current assets 4,237 4,093 3,891 volume growth
Inventories 10,789 7,934 8,440
Receivables 9,674 6,802 7,920
Current financial assets 1,029 3,769 1,152
Cash and cash equivalents 3,949 728 1,808
Total assets 34,487 27,622 27,547
Total equity 17,406 12,521 12,047
Interest bearing liabilities1 7,095 7,104 7,239
Non-interest-bearing liabilities2 9,986 7,997 8,261
Total equity and liabilities 34,487 27,622 27,547
*Financial statements prior to 2018 are combined.
1) Interest bearing loans non-current, Post-employment benefits and Interest bearing loans current © 2018 by Epiroc. All rights reserved. 25
2) Other liabilities and provisions, trade payables, income tax liabilities and other liabilities and provisionsEfficient operations resulting in high returns
ROCE performance
35 000 35
• Asset light operations
30 000 30
• Variable cost structure
• High margins
25 000 25 • High ROCE
20 000 20
15 000 15
10 000 10
5 000 5
0 0
2015 2016 2017 2018, Sep 30
Average capital employed, SEK million 1) Return on Capital Employed, 12 months %
1) The average capital employed is calculated as an average of five quarters. © 2018 by Epiroc. All rights reserved. 26Financial goals
Superior value creation
• Epiroc’s goal is to provide superior value creation through a combination of strong operating performance, efficient use of
capital, and stable and rising dividends to its shareholders
• This will be achieved through agile adaption to cyclical capital equipment demand, combined with a resilient and growing
aftermarket business
Target Description 2015-2017 Sept. 2018
Epiroc’s goal is to achieve an annual revenue growth of eight percent over a
Growth business cycle, and to grow faster than the market. Growth will be organic and 4.7%1) 21.1%4)
supported by selective acquisitions.
Epiroc’s goal is to have an industry-best operating margin, with strong resilience
Profitability 17.9%2) 18.8%5)
over the cycle.
Epiroc’s goal is to improve capital efficiency and resilience. Investments and
Capital efficiency 24.3%3) 30.9%3)
acquisitions shall create value.
Epiroc is to have an efficient capital structure and have the flexibility to make
Capital structure -
selective acquisitions. The goal is to maintain an investment grade rating.
Epiroc’s goal is to provide long-term stable and rising dividends to its
Dividend policy shareholders. The dividend should correspond to 50 percent of net profit over the -
cycle.
1) Revenue CAGR (Compounded annual growth rate)
2) Average operating margin
3) Average ROCE (Return on capital employed)
4) Revenue growth Jan-Sep 2018 vs. Jan-Sep 2017 © 2018 by Epiroc. All rights reserved. 27
5) Operating margin Jan-Sep 2018
Source: Company filingsAgenda
1 Introduction to Epiroc 4
2 Company overview 7
3 Financial overview 17
4 Credit highlight and transaction overview 28
5 Appendix 33
© 2018 by Epiroc. All rights reserved. 28Rating BBB+ (stable) by S&P
Statements from the S&P global rating research November 21, 2018
“The preliminary 'BBB+' rating on Epiroc reflects our view of the company's “We believe that, if the industry enters a downturn similar to 2012-2016, driven
leading global position as a provider of equipment for rock drilling and by lower investments, the company's operating margin and FOCF will show
excavation, its ability to mitigate cyclicality in equipment demand thanks to its resilience, while there will likely be some volatility in revenue because the
high share of aftermarket sales revenues, and our expectations that its sales of new products are adversely affected. Despite a downward trend in
industry-leading EBITDA margins will remain sustainable at around 23%-24%, capital expenditures (capex) for the larger miners during that downturn,
or higher, during stronger periods of the cycle. We also factor into our analysis Epiroc's EBITDA margin remained around 20%, which we view as high,
our projections of healthy revenue growth, a strong balance sheet notably during the softer period of the cycle (we use Atlas Copco's previous
complemented by strong FOCFs, somewhat offset by sizable dividends, and Mining and Rock Excavation division as a proxy for longer periods). The
occasional strategic acquisitions.” proven stability in earnings and margins is an important rating factor,
particularly as the mining sector to which Epiroc is exposed to carries
significant volatility, especially in mining capital capex.”
“The stable outlook reflects our view that, thanks to a flexible and highly “We expect Epiroc to continue to maintain prudent capitalization, meaning a
profitable production system, and low debt, the group should continue to be strong balance sheet, supporting strong coverage ratios. We have forecasted
fairly resilient to industry volatility, with FFO to debt significantly above 45% funds from operations (FFO) to debt and debt to EBITDA of about 200% and
also at the bottom of the cycle, complemented by positive FOCF. We expect below 0.5x, respectively, for 2019 and 2020. The strong and stable FOCF is a
Epiroc to continue to withstand the volatility in its end markets, and the major credit strength for Epiroc, and is the result of good FFO and low capex.”
EBITDA margin at all times will remain above 18%, even though sales are
likely to show some volatility over the cycle.”
© 2018 by Epiroc. All rights reserved. 29Indicative terms for the transaction
SEK bond
Issuer Epiroc
Issuer rating BBB+
Expected bond rating BBB+
Documentation EMTN
Pricing date TBD
Settlement date TBD
Maturity date TBD
Tenors 5yr
Coupon type TBD
Size SEK Benchmark
Business day Stockholm
Governing Law English law
Listing Euronext Dublin
Denominations SEK 2,000,000 +SEK 1,000,000
Bookrunner Danske Bank, Nordea and SEB
Purpose General Corporate Purposes including repayment of debt
© 2018 by Epiroc. All rights reserved. 30Epiroc at a glance
A leading global provider of solutions for rock drilling and excavation
Epiroc Group Credit strengths
1 Global reach and diversified geographical exposure
> 150 countries in global sales coverage
> 13,000 passionate and experienced employees
2 Strong aftermarket position
SEK 31,440 million in revenue1)
SEK 5,949 million in operating profit1) 3 History of innovation and strong pipeline
Revenue by geography 2017
4 Industry leading financial performance
North America Europe
23% 25%
Asia/Australia
25%
5 Track record of resilient cash flow generation
Africa/Middle East
13%
South America
14%
6 BBB+ rating from S&P
© 2018 by Epiroc. All rights reserved. 31
1) Reported 2017
Source: Company filingsAppendix
Share capital and ownership

                                                                    Shareholder                             % of votes                % of shares
•   Epiroc’s share capital is SEK 500,000,000, which consists of    Investor Aktiebolag                           22.7                        17.1
    1,213,738,703 shares of which 823,765,854 are A shares and
    389,972,849 are B shares.                                       Alecta Pensionsförsäkring                     2.9                         4.6

                                                                    Swedbank Robur fonder                         2.5                         3.7
•   Each A share carries one vote and each B share carries one-
    tenth of a vote.                                                SEB Investment Management                     1.4                         1.0

•   The table to the right shows, as at 30 September 2018, the 10   SPP Fonder AB                                 0.6                         0.7
    largest shareholders (by voting rights) that are registered
                                                                    Fjärde AP-fonden                              0.5                         0.9
    directly or as a group with Euroclear Sweden, the Swedish
    central securities depository.                                  Handelsbanken fonder                          0.3                         1.0

                                                                    AMF                                           0.2                         1.6

                                                                    UN Pension fund                               0.2                         0.1

                                                                    Tredje AP-fonden                              0.2                         0.6

                                                                    Others                                        68.5                        68.7

                                                                    Total shareholders                           100.0                       100.0

                                                                    Of which held by the Issuer                   1.2                         0.9

                                                                    Total                                         98.8                        99.1

                                                                                                  Confidential | © 2018 by Epiroc. All rights reserved.   34
United. Inspired. Performance unites us, innovation inspires us, and commitment drives us to keep moving forward. Count on Epiroc to deliver the solutions you need to succeed today and the technology to lead tomorrow. epiroc.com
You can also read