Crowdsourced air traffic data from the OpenSky Network 2019-2020 - ESSD
←
→
Page content transcription
If your browser does not render page correctly, please read the page content below
Earth Syst. Sci. Data, 13, 357–366, 2021
https://doi.org/10.5194/essd-13-357-2021
© Author(s) 2021. This work is distributed under
the Creative Commons Attribution 4.0 License.

       Crowdsourced air traffic data from the OpenSky Network
                              2019–2020
          Martin Strohmeier1,2,4 , Xavier Olive3,4 , Jannis Lübbe4 , Matthias Schäfer4,5 , and Vincent Lenders1,4
                                1 ArmasuisseScience and Technology, 3603 Thun, Switzerland
                      2 Departmentof Computer Science, University of Oxford, Oxford, OX1 3QD, UK
                         3 ONERA DTIS, Université de Toulouse, 31055 Toulouse CEDEX 4, France
                                     4 OpenSky Network, 3400 Burgdorf, Switzerland
                              5 University of Kaiserslautern, 67663 Kaiserslautern, Germany

                         Correspondence: Martin Strohmeier (strohmeier@opensky-network.org)

                                   Received: 3 August 2020 – Discussion started: 18 August 2020
                       Revised: 29 December 2020 – Accepted: 10 January 2021 – Published: 11 February 2021

       Abstract. The OpenSky Network is a non-profit association that crowdsources the global collection of live air
       traffic control data broadcast by aircraft and makes them available to researchers.
          OpenSky’s data have been used by over 100 academic groups in the past 5 years, with popular research applica-
       tions ranging from improved weather forecasting to climate analysis. With the COVID-19 outbreak, the demand
       for live and historic aircraft flight data has surged. Researchers around the world use air traffic data to com-
       prehend the spread of the pandemic and analyse the effects of the global containment measures on economies,
       climate and other systems.
          With this work, we present a comprehensive air traffic dataset, derived and enriched from the full OpenSky
       data and made publicly available for the first time (Olive et al., 2020; https://doi.org/10.5281/zenodo.3931948,
       last access: 9 February 2021). It spans all flights seen by the network’s more than 3500 members between 1
       January 2019 and 1 July 2020. The archive is being updated every month and for the first 18 months includes
       41 900 660 flights, from 160 737 aircraft, which were seen to frequent 13 934 airports in 127 countries.

1   Introduction                                                   into two different areas, epidemiological modelling and un-
                                                                   derstanding the systemic impact of the pandemic.
                                                                      The first category, modelling of the possible spread of
In this paper, we present a dataset of global flight movements     COVID-19, was of crucial interest early in the stages of the
derived from crowdsourced air traffic control data collected       pandemic and will again gain importance in estimating travel
by the OpenSky Network (Schäfer et al., 2014), which are           safety in the future. The utility of flight data for this purpose
widely used in many fields, including several areas pertain-       was illustrated for example in widely circulated studies such
ing to Earth system sciences. With the spread of COVID-19,         as Bogoch et al. (2020) but has been known to be useful in
they are furthermore widely used in the understanding of the       the context of pandemics for much longer (e.g. Mao et al.,
pandemic and its effects.                                          2015).
   OpenSky flight data have regularly been used in analysing          The second main category comprises the analysis of the
environmental issues such as noise emissions (Tengzelius           socio-ecological impact of COVID-19 and measures imple-
and Abom, 2019) or black carbon particulate emissions              mented to fight it. It uses flights for example as an indicator
(Zhang et al., 2019) to name but a few. In the wake of the         of economic activity (at a given airport or region or globally)
pandemic, OpenSky has received a surge of more than 70 re-         as illustrated in Miller et al. (2020). Examples of such use
quests for air traffic data specifically related to COVID-19.      of data provided by OpenSky can be found in the follow-
The research behind these requests can be largely separated

Published by Copernicus Publications.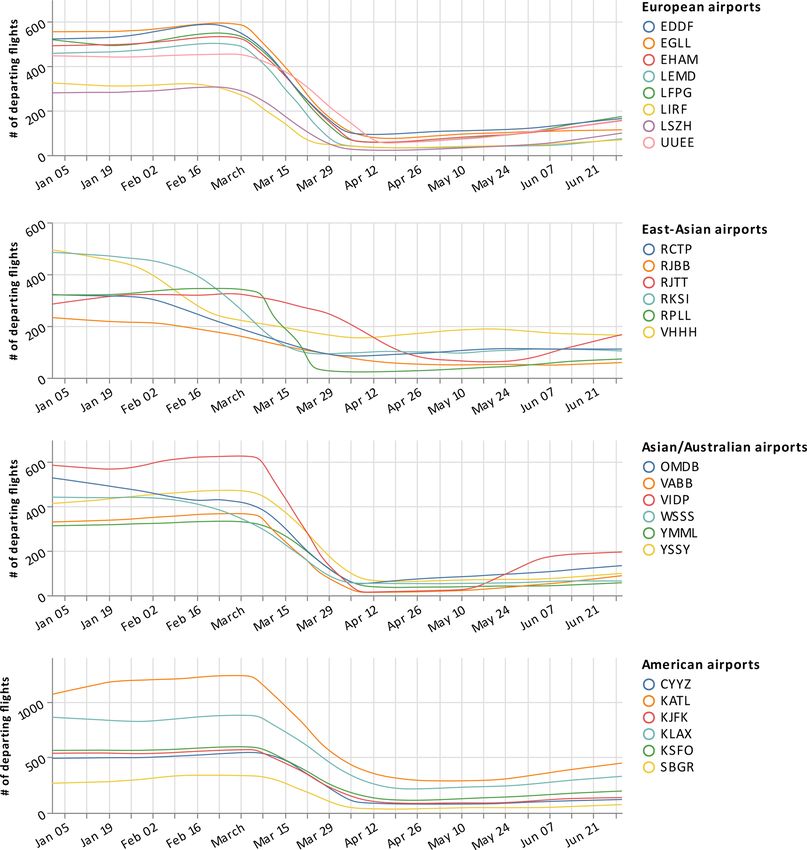
358                                                                         M. Strohmeier et al.: Crowdsourced air traffic data

ing: Bank of England, Monetary Policy Committee (2020),
International Monetary Fund (2020), or United Nations De-
partment of Economic and Social Affairs (2020).
   Flight data can further be used to understand the impact
of the sudden drop in air traffic in many global systems.
For example, Lecocq et al. (2020) employed OpenSky data
recently in order to analyse the impact of COVID-19 mit-
igation measures on high-frequency seismic noise and we
have received several requests relating to research specifi-
cally on the impact of COVID-19. This present dataset, avail-
able at https://doi.org/10.5281/zenodo.3931948 (last access:
9 February 2021), was created in order to make it easier for
researchers to access air traffic data for their own systemic
analyses.                                                          Figure 1. OpenSky message growth 2014–2020.

2   Background                                                     which have typical ranges of 100–500 km in a line-of-sight
                                                                   environment. The data are then sent to the OpenSky Net-
Crowdsourced research projects are a form of “citizen sci-         work, where they are processed and stored in a Cloudera
ence” whereby members of the public can join larger sci-           Impala database. In line with its mission as a non-profit or-
entific efforts by contributing to smaller tasks. In the past,     ganization, OpenSky then grants researchers from academic
such efforts have taken many forms including attempting to         and other institutions direct access to this database on request
detect extra-terrestrial signals (UC Berkley, 2019) or explor-     (Schäfer et al., 2014).
ing protein folding for medical purposes (Pande, 2019). Typ-          Along with the global sensor coverage, the database has
ically, the projects form distributed computing networks with      initially grown exponentially since its inception in 2014 (see
results being fed to a central server.                             Fig. 1) and currently comprises over 24 trillion messages,
   In a parallel development, software-defined radios (SDRs)       taking up around 2 PB. In peak pre-pandemic times, almost
have become readily available and affordable over the past         100 000 flights were tracked per day. The raw data avail-
decade. SDR devices present a significant change to tradi-         able in the Impala database have been used in more than 150
tional radios, in that wireless technologies can be imple-         academic publications as of 2020 (Strohmeier, 2020). How-
mented as separate pieces of software and run on the same          ever, despite available application programming interfaces
hardware. This has greatly reduced the barriers to entry, so       and third-party tools, access to these data requires significant
many more users can now take part in wireless projects such        investment of time and resources to understand the availabil-
as crowdsourced sensor networks with little cost. This devel-      ity and underlying structure of the database. With this dataset
opment has given rise to several global crowdsourced flight        and its accompanying descriptor, we want to address this ac-
tracking efforts, from commercial to enthusiast and research       cessibility issue and make a relevant part of the OpenSky
use.                                                               Network flight metadata accessible to all researchers.
   The concept of flight tracking itself is based on sev-
eral radar technologies. Traditionally, these were expensive
                                                                   3     Methods
and inaccurate non-cooperative radars developed for military
purposes. With the explosive growth of global civil aviation,
                                                                   3.1    Crowdsourced collection
however, more accurate cooperative radar technologies have
been deployed to ensure safety and efficiency of the airspace.     The raw data used to generate the dataset were recorded by
   For this dataset of flight movements, we use the data           more than 3000 crowdsourced sensors of the OpenSky Net-
broadcast by aircraft with the modern Automatic Depen-             work. The network records the payloads of all 1090 MHz
dent Surveillance–Broadcast (ADS-B) protocol. These data           secondary surveillance radar downlink transmissions of air-
include position, velocity, identification and flight status in-   craft along with the timestamps and signal strength indica-
formation broadcast up to twice a second (see Schäfer et al.,      tors provided by each sensor on signal reception. Part of this
2014). The protocol is being made mandatory in many                data collection comprises the exact aircraft locations broad-
airspaces as of 2020, resulting in broad equipage among            cast at 2 Hz by transponders using the ADS-B technology.
larger aircraft from industrialized countries and emerging            As the data come from a crowdsourced system of re-
economies as described by Schäfer et al. (2016).                   ceivers, their collection faces numerous challenges and dif-
   Figure 2 illustrates the principle of OpenSky in the ab-        ficulties found in such an organically grown, non-controlled
stract: the data are broadcast by ADS-B-equipped aircraft          set of receivers. However, it is the only feasible option for
and received by crowdsourced receivers on the ground,              the large-scale collection of open research data as collecting

Earth Syst. Sci. Data, 13, 357–366, 2021                                            https://doi.org/10.5194/essd-13-357-2021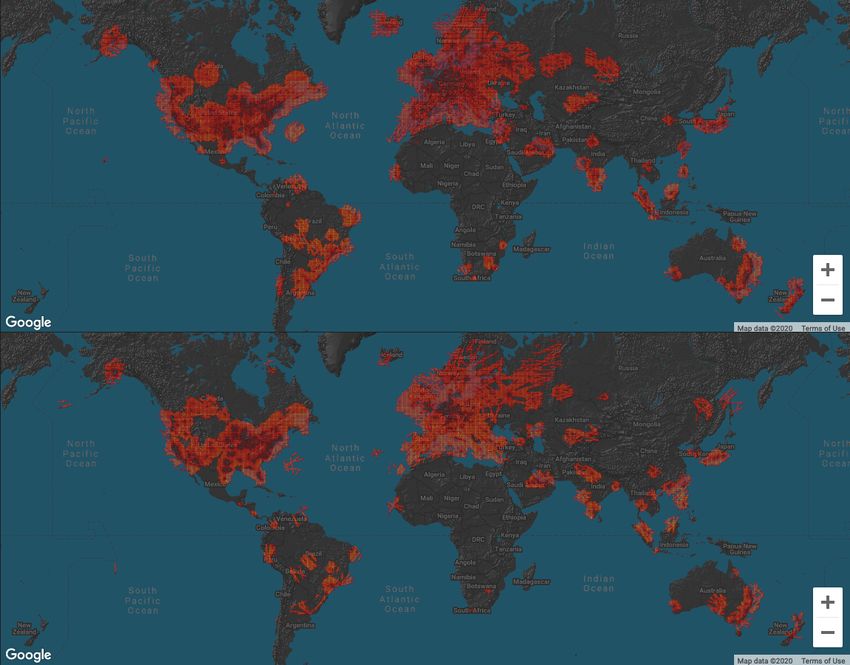
M. Strohmeier et al.: Crowdsourced air traffic data                                                                                359

Figure 2. High-level illustration of the flight data crowdsourcing
process, including map of active receivers on 1 July 2020. © Open-    Figure 3. Coverage of OpenSky on 1 January 2019 (top) and 1 May
StreetMap contributors 2020. Distributed under the Creative Com-      2020 (bottom). © Google Maps.
mons BY-SA License.

                                                                      transponders and real aircraft seen for only a very short time,
data from a synchronized and controlled deployment would              which are generally not of significant value for the dataset.
be less flexible and less widely applicable, in particular for            If an aircraft leaves OpenSky’s coverage range for more
a non-profit research endeavour. Conversely, due to the high          than a threshold T = 10 min, this flight’s track is consid-
sensor density and high level of redundancy in the OpenSky            ered finished at the point of last contact. We further want to
Network, many well-covered regions of these data achieve              avoid creating a new flight record in case an aircraft simply
the quality of controlled deployments on a nationwide level.          leaves the coverage and returns after some time larger than T
   The true coverage of the network, i.e. actually received           (e.g. for any flight over the Atlantic Ocean) without actually
positions of aeroplanes, is illustrated in Fig. 3, both for 1         having landed. We thus apply a simple check: if time, dis-
January 2019 and during the pandemic on 1 May 2020.                   tance and reported velocity fit with a constant extrapolation
Historic coverage for any given day is visible at https:              based on the last-known values (minus a small threshold of
//opensky-network.org/network/facts (last access: 9 Febru-            0.5◦ longitude and/or latitude), they will be considered seg-
ary 2021). We compare this growing coverage to global com-            ments of the same flight. If not, it is assumed that the aircraft
mercial flight tracking website Flightradar24, which tracked          has landed at some point outside OpenSky’s coverage and a
68 948 849 total flights in 2019.1 Unfortunately, this num-           separate flight is recorded.
ber is not broken down into how many of these flights were                The destination airport candidates are received from these
tracked via ADS-B technology (versus other methods such as            identified flight trajectories as follows. If the last position
multilateration or non-crowdsourced approaches including              seen is above 2500 m, no candidate is defined and the value
the use of satellites and primary radar), which would make            is set to “NULL”. Otherwise, the descending trajectory is ex-
it possible to directly compare it with our dataset. Still, with      trapolated towards the ground and the Cartesian distance to
30 989 481 flights recorded by OpenSky for 2019, this means           the closest airports is computed. If there is no airport within
our dataset covers about 45 % of all global flights. Intuitively      10 km, the value is set to NULL. Otherwise, the closest iden-
this number will be significantly higher in the well-covered          tified airport is listed as the destination airport. The procedure
areas (see Fig. 3).                                                   applies in reverse for the origin airport candidates.
                                                                          We note that this approach is necessarily an extrapolation
3.2   Derivation of flights                                           and airports may in some cases be wrongly identified if the
                                                                      contact is lost before the ground, in particular where several
We define a flight for the purpose of this dataset as the contin-     airports are close by.
uous time between the first received ADS-B contact of one
specific aircraft and the last. Such a flight’s length must be        3.3   Data cleaning
at least 15 min. This filter avoids noise from misconfigured
                                                                      To make the data accessible and meet requirements, complex
   1 https://www.flightradar24.com/blog/                              pre-processing is needed in order to reduce the reduce the
flightradar24s-2019-by-the-numbers/    (last   access:   9   Febru-   data volume and eliminate the need to understand all sys-
ary 2021).                                                            tem aspects in order to use the data. Moreover, the infor-

https://doi.org/10.5194/essd-13-357-2021                                                Earth Syst. Sci. Data, 13, 357–366, 2021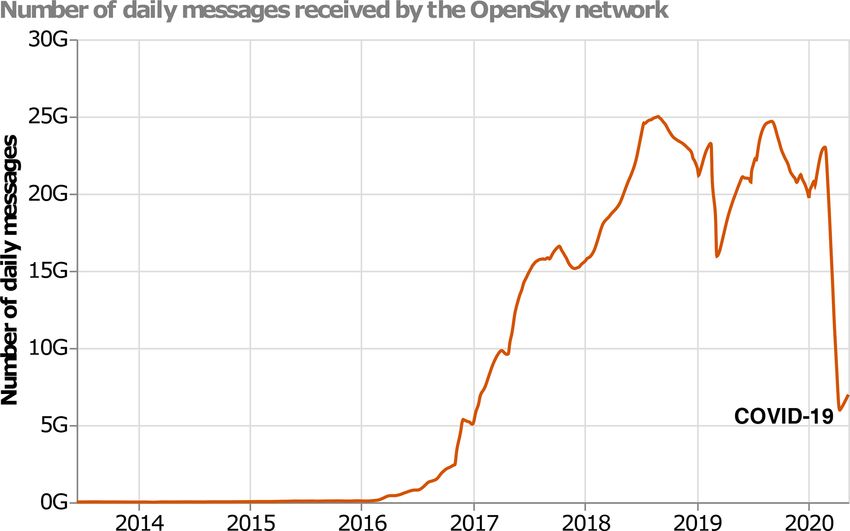
360                                                                          M. Strohmeier et al.: Crowdsourced air traffic data

mation quality needs to be assessed and indicated, allow-          3.4    Data enrichment
ing researchers to choose subsets that match their own re-
quirements. Therefore, we performed the following process-         We use the OpenSky aircraft database to add aircraft types
ing steps to prepare the unstructured OpenSky Network data         to our flight data and access publicly available open applica-
and create a well-defined dataset for scientific analysis.         tion programming interfaces (APIs) to match the commercial
                                                                   flight identifier, where available.
                                                                      The integration of aircraft types enables additional anal-
3.3.1   Decoding                                                   ysis such as gauging the popularity of different types and
Decoding ADS-B correctly is a complex task. Although li-           manufacturers across time, regions and use cases. Aircraft
braries and tutorials such as that of Sun et al. (2019) exist,     type designators follow the International Civil Aviation Or-
it remains a tedious task that requires a deep understand-         ganization (ICAO) convention (International Civil Aviation
ing of the underlying link layer technology Mode S. More-          Union, 2020).
over, the sheer volume of data collected by OpenSky (about            The OpenSky aircraft database was created in 2017 as
120 GB of raw data per hour) makes this process challeng-          an additional crowdsourcing project. It joins different data
ing and resource-intensive. Therefore, we relieve researchers      sources, both official and unofficial ones. The official sources
from this burden by providing readily decoded information          include the registration information from the flight author-
such as position in WGS84 coordinates, altitude information        ities in the USA, UK, Ireland and Switzerland, which is
in metres and the unique aircraft identifier as a 24 bit hex-      downloaded and incorporated daily. Besides these, it re-
adecimal number.                                                   lies on enthusiast knowledge based on live observations
                                                                   and third-party sources. These are integrated opportunis-
                                                                   tically; the database is editable by any registered user of
3.3.2   Timestamps                                                 the OpenSky Network. The enriched metadata reflect the
Timestamps are provided in different resolutions and units,        state of the database at the time of creation; regular up-
depending on the receiving sensor type. For the purposes of        dates of the full aircraft database are made available at
this dataset, we use the time when the messages where re-          https://opensky-network.org/datasets/metadata/ (last access:
ceived at the server, with 1 s precision, which we deem more       9 February 2021).
than sufficient for the macro use cases intended. Where a sin-
gle message is received by multiple receivers, the first times-    4     Data records
tamp is used.
                                                                   Overall, the archive includes 41 900 660 flights, from
3.3.3   Deduplication                                              160 737 aircraft, which were seen to frequent 13 934 airports
                                                                   in 127 countries. One file per month is provided in comma-
OpenSky’s raw data are merely a long list of single measure-       separated values (CSV) format. Table 1 provides a break-
ments by single sensors. However, as most localization algo-       down of the included CSV files and their contents, broken
rithms rely on signals being received by multiple receivers,       down into size, number of flights, number of unique aircraft,
we grouped multiple receptions belonging to the same trans-        unique origins and destinations. Note the significant reduc-
mission based on their continuous timestamp and signal pay-        tion in size and flights since the beginning of pandemic mea-
load. This process is called deduplication. Note that although     sures in March 2020.
most position reports are unique, a small number of falsely           We describe the columns of the dataset in the following:
grouped measurements remain as noise in the data.
                                                                       1. callsign. The identifier of the flight used for display on
3.3.4   Quality assurance                                                 the radar screens of air traffic controllers or voice com-
                                                                          munication. For commercial flights, the first three let-
Crowdsourcing creates potential issues regarding the quality              ters are typically reserved for an airline, e.g. AFR for
and integrity of location and timing information of certain               Air France or DLH for Lufthansa. This is then typically
aircraft and sensors. Such issues can range from faults in the            followed by four digits. For non-airline flights this can
transmission chain (i.e. aircraft transponder, ground station)            often be chosen freely or depending on the customs of
to malicious injection of falsified aircraft data. To allow re-           the airspace of a country. It is broadcast by the aero-
searchers to ignore these effects while still preserving them             plane itself. For anonymity reasons, the callsign is only
as a potential subject of research, OpenSky offers integrity              provided for verified commercial airline flights.
checks to verify and judge the data correctness (see Schäfer
et al., 2018). We also note that the abstracted nature of this         2. number. The commercial number of the flight if avail-
dataset makes it more robust to any issues in the first place as          able through OpenSky. These flight numbers are typi-
low-quality data will be averaged out over time by the many               cally used by the airlines for booking references or de-
involved receivers.                                                       parture boards at airports.

Earth Syst. Sci. Data, 13, 357–366, 2021                                              https://doi.org/10.5194/essd-13-357-2021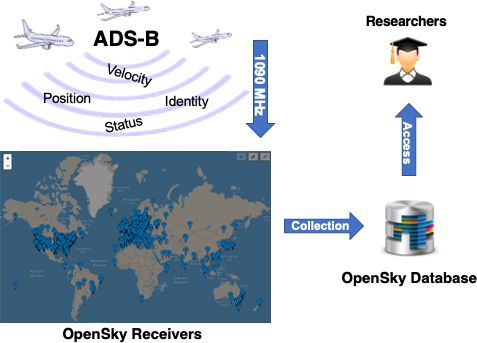
M. Strohmeier et al.: Crowdsourced air traffic data                                                                                 361

Table 1. Overview of the dataset files and content metadata.

                         Filename                          Month             Size         Aircraft       Flights
                         flightlist_20190101_20190131      January 2019      175.5 MB      68 876     2 145 469
                         flightlist_20190201_20190228      February 2019     164.0 MB      68 798     2 005 958
                         flightlist_20190301_20190331      March 2019        186.5 MB      74 362     2 283 154
                         flightlist_20190401_20190430      April 2019        194.6 MB      76 298     2 375 102
                         flightlist_20190501_20190531      May 2019          208.2 MB      79 547     2 539 167
                         flightlist_20190601_20190630      June 2019         218.3 MB      82 879     2 660 901
                         flightlist_20190701_20190731      July 2019         238.3 MB      86 385     2 898 415
                         flightlist_20190801_20190831      August 2019       246.0 MB      89 776     2 990 061
                         flightlist_20190901_20190930      September 2019    224.1 MB      89 963     2 721 743
                         flightlist_20191001_20191031      October 2019      242.3 MB      92 449     2 946 779
                         flightlist_20191101_20191130      November 2019     223.5 MB      92 003     2 721 437
                         flightlist_20191201_20191231      December 2019     222.1 MB      92 253     2 701 295
                         flightlist_20200101_20200131      January 2020      225.4 MB      90 821     2 734 791
                         flightlist_20200201_20200229      February 2020     218.0 MB      97 931     2 648 835
                         flightlist_20200301_20200331      March 2020        177.2 MB      94 631     2 152 157
                         flightlist_20200401_20200430      April 2020        68.3 MB       74 257       842 905
                         flightlist_20200501_20200531      May 2020          87.8 MB       89 721     1 088 267
                         flightlist_20200601_20200630      June 2020         116.9 MB      98 747     1 444 224
                         All files                         17 months         3.4 GB       160 737    41 900 660

  3. aircraft_uid. A unique aircraft identification number             11. latitude_2, longitude_2, altitude_2. This is the position
     randomly generated based on the transponder identifi-                 of the aircraft at the lastseen timestamps. The altitude is
     cation number that is globally unique and specific to an              a barometric measurement based on a standard pressure
     aircraft (rather than a flight). Changes occur only if an             of 1013 HPa.
     aircraft changes ownership, with exceptions for military
     aircraft, which may in some countries be able to have
     their identifier changed arbitrarily.                             5    Technical validation

  4. typecode. This is the aircraft model type if available            In the following, we provide some statistics showing that our
     through the aircraft database.                                    flights dataset reflects the air traffic reality as different time
                                                                       series showing the effect of the COVID-19 pandemic at dif-
  5. origin. This is a four-letter code for the origin airport of      ferent airports and for different airlines.
     the flight if the trajectory was able to be matched suc-             Table 2 shows the distribution of the top 25 aircraft types
     cessfully.                                                        in the flight dataset over 1 month (January 2020). Overall,
                                                                       the top models are dominated by the four largest commercial
  6. destination. This is a four-letter code for the destina-          aircraft manufacturers: Boeing with eight different types ac-
     tion airport of the flight if the trajectory was able to be       counting for 663 308 flights, Airbus with seven models and
     matched successfully.                                             766 499 flights, Embraer with four models (120 163 flights),
                                                                       and Bombardier (three models, 126 052 flights). The 737-800
  7. firstseen. This is the UTC timestamp of the first airborne        is the single most popular aircraft with 378 424 flights in Jan-
     message received by the OpenSky Network.                          uary 2020 alone.
                                                                          Table 3 shows the distribution of the top 20 airport types
  8. lastseen. This is the UTC timestamp of the last airborne          in the flight dataset in January 2020 (based on recorded flight
     message received by the OpenSky Network.                          destinations). Reflecting both global air traffic realities and
                                                                       OpenSky’s coverage focus, 13 of these airports are in the
  9. day. This is the UTC day of the last airborne message             United States, including the 7 busiest with regards to land-
     received by the OpenSky Network.                                  ings. Several of the major hubs in Europe (Frankfurt, London
                                                                       Heathrow, Paris Charles de Gaulle) and Asia (Kuala Lumpur,
10. latitude_1, longitude_1, altitude_1. This is the position          Dubai and Delhi) as well as Toronto in Canada make up the
    of the aircraft at the firstseen timestamps. The altitude is       remaining 7.
    a barometric measurement based on a standard pressure                 Figure 4 shows a time series of airport activity (as mea-
    of 1013 HPa.                                                       sured by departures) in four different regions based on data

https://doi.org/10.5194/essd-13-357-2021                                                 Earth Syst. Sci. Data, 13, 357–366, 2021
362 M. Strohmeier et al.: Crowdsourced air traffic data
Table 2. Flight distribution in dataset January 2020.
Manufacturer Model Type code Flights
Airbus A320neo A20N 77 018
Airbus A321neo A21N 18 411
Airbus A319 A319 116 261
Airbus A320 A320 365 901
Airbus A321 A321 128 332
Airbus A330-200 A332 20 958
Airbus A330-300 A333 39 618
ATR ATR 72-600 AT76 35 788
Boeing 737-700 B737 109 362
Boeing 737-800 B738 378 424
Boeing 737-900 B739 44 131
Boeing 757-200 B752 29 318
Boeing 767-300 B763 28 916
Boeing 777-200 B772 17 147
Boeing 777-300ER B77W 36 925
Boeing 787-9 Dreamliner B789 19 085
Bombardier CRJ200 CRJ2 46 930
Bombardier CRJ700 CRJ7 29 829
Bombardier CRJ900 CRJ9 49 293
De Havilland DHC-8-400 DH8D 34 487
Embraer ERJ145 E145 27 150
Embraer E190 E190 27 871
Embraer E175 (long wing) E75L 43 891
Embraer E175 (short wing) E75S 21 251
Pilatus Eagle PC12 16 663
Table 3. Top 20 airports based on recorded flight destinations in January 2020.
Country City ICAO code Landings
United States Atlanta KATL 35 770
United States Chicago KORD 34 480
United States Dallas–Fort Worth KDFW 27 534
United States Los Angeles KLAX 23 659
United States Las Vegas KLAS 21 195
United States Phoenix KPHX 19 219
United States New York Newark KEWR 18 962
United Kingdom London Heathrow EGLL 18 340
United States San Francisco KSFO 17 824
United States New York JFK KJFK 17 653
United States Houston KIAH 17 626
India New Delhi VIDP 17 498
United States Miami KMIA 17 154
France Paris CDG LFPG 16 889
Malaysia Kuala Lumpur WMKK 16 726
United States Seattle KSEA 16 670
United Arab Emirates Dubai OMDB 16 049
Canada Toronto CYYZ 15 972
United States Boston KBOS 15 927
Germany Frankfurt am Main EDDF 15 904
Earth Syst. Sci. Data, 13, 357–366, 2021 https://doi.org/10.5194/essd-13-357-2021M. Strohmeier et al.: Crowdsourced air traffic data 363
Figure 4. Comparison of flight numbers at various airports as seen by the OpenSky Network during 2020.
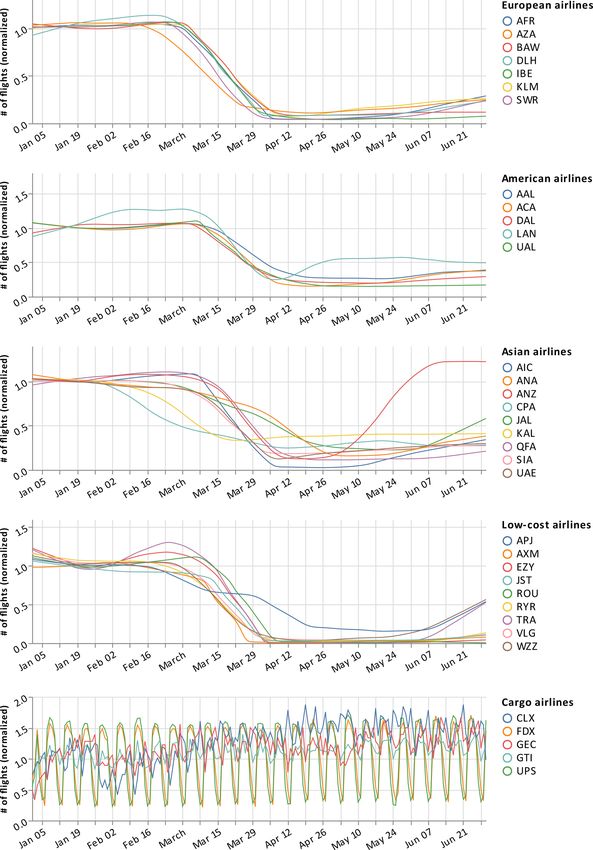
from 1 January to 30 April 2020. The impact of the pandemic – sharply decreasing patterns for all regular airlines in
(or rather the measures to contain it) can be seen clearly in March, with stronger effects for European airlines com-
all four. For example, the data show the following: pared to American and Asian airlines;
– a slow decrease from February in several East Asian air-
ports (even earlier in Hong Kong), – most low-cost airlines practically stopping all business
activities (with the exception of the Japanese Peach air-
– European airports decreasing sharply from early March
line);
onward,
– America’s air traffic dropping later by about 2 weeks,
– a very slow recovery for most airlines and regions be-
– India stopping all air traffic sharply by mid-March ginning in May and June, with some rebounding more
(VABB, VIDP). strongly, for example Air New Zealand (ANZ);
In a similar fashion, Fig. 5 shows COVID-19’s normalized
impact on different airlines across the globe. Among notice- – cargo airlines showing no negative impact of the crisis
able trends, we can identify the following: and some possibly even finding a slight upward trend.
https://doi.org/10.5194/essd-13-357-2021 Earth Syst. Sci. Data, 13, 357–366, 2021364 M. Strohmeier et al.: Crowdsourced air traffic data
Figure 5. Comparison of flight numbers of various airlines as seen by the OpenSky Network during 2020. Flights are grouped by geographic
regions for legacy carriers. Cargo and low-cost airlines are shown separately.
6 Usage notes It is important to note that ADS-B equipage has been in-
creasing over time as existing aircraft have been retrofitted
This dataset may differ from other data sources due to limita- and older aircraft have been replaced. This effectively means
tions of ADS-B data. On the other hand, there are advantages that the number of tracked aircraft in the dataset had been
as it reflects all aircraft types rather than only commercial air- slowly increasing pre-pandemic, reflecting the reality of a
lines. dynamic global aviation industry.
Earth Syst. Sci. Data, 13, 357–366, 2021 https://doi.org/10.5194/essd-13-357-2021M. Strohmeier et al.: Crowdsourced air traffic data 365
Further, there are differences in ADS-B equipage across Author contributions. MaSt contributed through manuscript
countries’ airspaces (depending on their regulatory ap- writing and data collection; XO contributed through data prepara-
proach) as well as potentially between aircraft types. For tion, data cleaning and data visualization; JL contributed through
example, small personal aircraft flying locally and below route data collection; MS and VL contributed through creating
18 000 feet (5486.4 m) are often not required to use ADS- and maintaining OpenSky Network infrastructure. All authors con-
tributed through manuscript review.
B. Similarly, military aircraft may have exceptions for oper-
ational reasons. It is not possible to track and reflect these
highly dynamic developments in a static dataset; however,
Competing interests. The authors declare that they have no con-
this should be kept in mind for comparative analysis pur-
flict of interest.
poses.
Finally, as a recommendation for data handling and vi-
sualization, Figs. 4 and 5 have been created with the open- Acknowledgements. We are thankful to all members and sup-
source Python package traffic (Olive, 2019), which offers porters of the OpenSky Network foundation for making this data
dedicated methods for air traffic data and interfaces with collection effort possible.
OpenSky and other data sources. Further usage notes and
tool recommendations are regularly added on the OpenSky
website (https://opensky-network.org/community/blog/item/ Review statement. This paper was edited by David Carlson and
6-opensky-covid-19-flight-dataset, last access: 9 Febru- reviewed by Simon Proud and one anonymous referee.
ary 2021).
References
7 Code and data availability Bank of England, Monetary Policy Committee: Monetary Policy
Report, Tech. Rep., available at: https://www.bankofengland.
The dataset is available under the CC-BY License at Zen- co.uk/-/media/boe/files/monetary-policy-report/2020/may/
odo (see Olive et al., 2020; https://doi.org/10.5281/zenodo. monetary-policy-report-may-2020.pdf (last access: 9 Febru-
ary 2021), 2020.
3931948, last access: 9 February 2021).
Bogoch, I. I., Watts, A., Thomas-Bachli, A., Huber, C., Krae-
The code to generate and process the data is available in
mer, M. U., and Khan, K.: Potential for global spread of
different components. The popular dump1090 package, used a novel coronavirus from China, J. Trav. Med., 27, taaa011,
as the basis to receive a large majority of crowdsourced infor- https://doi.org/10.1093/jtm/taaa011, 2020.
mation (ca. 80 % in OpenSky), is available in Foster (2017). Foster, N.: gr-air-modes, available at: https://github.com/antirez/
Other receiver software may include proprietary and closed- dump1090, last access: 1 June 2020, 2017.
source software such as Radarcape and SBS-3. Fuchs, M. and Schäfer, M.: Mode S and ADS-B decoding li-
The OpenSky decoder is available in OpenSky’s GitHub brary for Java, GitHub repository, available at: https://github.
repository at https://github.com/openskynetwork/java-adsb com/openskynetwork/java-adsb (last access: 9 February 2021),
(Fuchs and Schäfer, 2020, last access: 9 February 2021). 2020.
Code concerning data cleaning and processing is docu- International Civil Aviation Union: DOC 8643: Aircraft Type
Designators, available at: https://www.icao.int/publications/
mented at https://traffic-viz.github.io/scenarios/covid19.html
DOC8643/Pages/default.aspx (last access: 9 February 2021),
(Olive, 2021, last access: 9 February 2021).
2020.
International Monetary Fund: Ensuring Continuity in
the Production of External Sector Statistics During
the COVID-19 Lockdown, Special Series on Statis-
8 Conclusions tical Issues to Respond to COVID-19, available at:
https://www.imf.org/~/media/Files/Publications/covid19-
Air traffic and flight data are needed for effective research in special-notes/en-special-series-on-covid-19-ensuring-
many areas of Earth systems science and related fields. We continuity-in-the-production-of-external-sector-
presented an openly accessible, specifically crafted dataset statistics.ashx?la=en (last access: 9 February 2021), 2020.
based on crowdsourced data obtained through the OpenSky Lecocq, T., Hicks, S. P., Van Noten, K., van Wijk, K., Koelemei-
jer, P., De Plaen, R. S., Massin, F., Hillers, G., Anthony, R. E.,
Network and validated it successfully. From January 2019
Apoloner, M.-T., et al.: Global quieting of high-frequency seis-
to July 2020, the archive includes 41 900 660 flights, from
mic noise due to COVID-19 pandemic lockdown measures, Sci-
160 737 aircraft, which were seen to frequent 13 934 airports ence, 369, 1338–1343, https://doi.org/10.1126/science.abd2438,
in 127 countries. As it is updated monthly, this dataset will 2020.
be growing significantly and will provide deeper insights into Mao, L., Wu, X., Huang, Z., and Tatem, A. J.: Modeling monthly
flight behaviour before, during and after the COVID-19 pan- flows of global air travel passengers: An open-access data re-
demic. source, J. Trans. Geogr., 48, 52–60, 2015.
https://doi.org/10.5194/essd-13-357-2021 Earth Syst. Sci. Data, 13, 357–366, 2021366 M. Strohmeier et al.: Crowdsourced air traffic data
Miller, S., Moat, H. S., and Preis, T.: Using aircraft location data to Schäfer, M., Strohmeier, M., Smith, M., Fuchs, M., Lenders, V.,
estimate current economic activity, Sci. Rep., 10, 1–7, 2020. and Martinovic, I.: OpenSky report 2018: assessing the integrity
Olive, X.: traffic, a toolbox for processing and analysing of crowdsourced mode S and ADS-B data, in: 2018 IEEE/AIAA
air traffic data, Journal of Open Source Software, 4, 37th Digital Avionics Systems Conference (DASC), IEEE, 1–9,
https://doi.org/10.21105/joss.01518, available at: https://www. 2018.
theoj.org/joss-papers/joss.01518/10.21105.joss.01518.pdf (last Strohmeier, M.: Research Usage and Social Impact of Crowd-
access: 9 February 2021), 2019. sourced Air Traffic Data, in: 8th OpenSky Symposium 2020,
Olive, X.: Impact of COVID-19 on worldwide aviation, [Online], Vol. 59, p. 1, 2020.
available at: https://traffic-viz.github.io/scenarios/covid19.html, Sun, J., Vû, H., Ellerbroek, J., and Hoekstra, J. M.: pyModeS: De-
last access: 9 February 2021. coding Mode-S Surveillance Data for Open Air Transportation
Olive, X., Strohmeier, M., and Lübbe, J.: Crowdsourced air Research, IEEE Transactions on Intelligent Transportation Sys-
traffic data from The OpenSky Network [CC-BY], Zenodo, tems, 2777–2786, 2019.
https://doi.org/10.5281/zenodo.3931948, 2020. Tengzelius, U. and Abom, M.: Aircraft pass-by noise on ground
Pande, V.: Folding@home, available at: https://foldingathome.org modelled with the SAFT-program, in: Inter.Noise 2019, 2019.
(last access: 9 February 2021), 2019. UC Berkley: SETI@home, available at: https://setiathome.berkeley.
Schäfer, M., Strohmeier, M., Lenders, V., Martinovic, I., and Wil- edu/ (last access: 9 February 2021), 2019.
helm, M.: Bringing up OpenSky: A large-scale ADS-B sensor United Nations Department of Economic and Social Affairs:
network for research, in: Proceedings of the 13th international Using experimental statistics to monitor of the impact of
symposium on Information processing in sensor networks, IEEE COVID-19 in Denmark, available at: https://covid-19-
Press, 83–94, 2014. response.unstatshub.org/data-solutions/using-experimental-
Schäfer, M., Strohmeier, M., Smith, M., Fuchs, M., Pinheiro, R., to-monitor-the-impact-of-covid19-in-denmark/ (last access:
Lenders, V., and Martinovic, I.: OpenSky report 2016: Facts and 9 February 2021), 2020.
figures on SSR mode S and ADS-B usage, in: 2016 IEEE/AIAA Zhang, X., Chen, X., and Wang, J.: A number-based inventory of
35th Digital Avionics Systems Conference (DASC), IEEE, 1–9, size-resolved black carbon particle emissions by global civil avi-
2016. ation, Nat. Commun., 10, 534, https://doi.org/10.1038/s41467-
019-08491-9, 2019.
Earth Syst. Sci. Data, 13, 357–366, 2021 https://doi.org/10.5194/essd-13-357-2021You can also read