Cruise Ship Tourism in Akaroa - Visitor experiences and expenditure, and business stakeholder perceptions
←
→
Page content transcription
If your browser does not render page correctly, please read the page content below
PREPARED FOR: CHRISTCHURCH & CANTERBURY TOURISM

Cruise Ship Tourism in Akaroa
Visitor experiences and expenditure,
and business stakeholder perceptions

      Prepared by Lincoln University
                     May 2013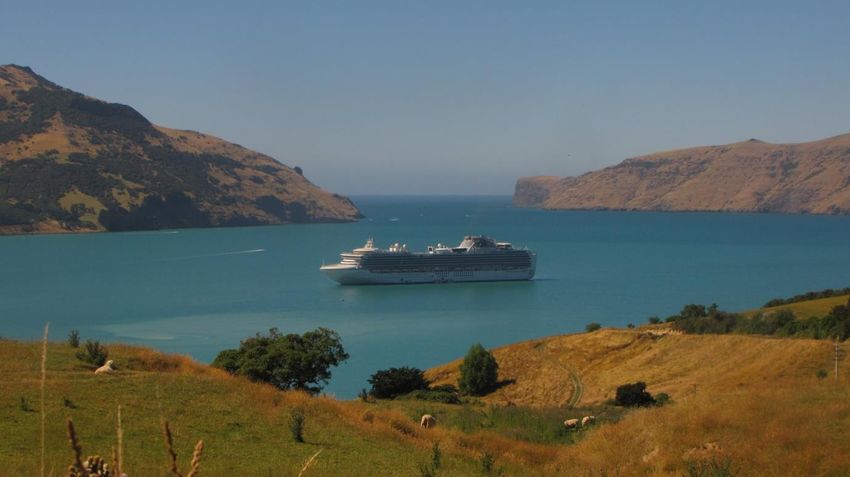
Acknowledgments

The Visitor Survey was undertaken by Monique Smith as a Summer Student Research Project within
the Department of Social Science, Parks, Recreation, Tourism and Sport at Lincoln University. This
Summer Student project was funded by Christchurch and Canterbury Tourism.

Monique was responsible for the majority of the data collection, the preliminary analysis and the
first draft of the report. We are grateful for her contribution to this project. We also wish thank Dr
Joanna Fountain and Dr Emma Stewart for their supervision of the student project and their input
into this final report.

The final analysis, including coding of the open-ended data and the preparation of these results for
the final draft of the report was undertaken by Michael Shone.

The Business Stakeholder interviews were conducted, analysed and written up by Jude Wilson. The
final draft of this report was written by Michael Shone and Jude Wilson.

We wish to thank all those who gave their time to be surveyed and interviewed for this project.

Photograph 1: (Cover) Cruise ship in Akaroa Harbour (Emma Stewart)

                                                                                                         i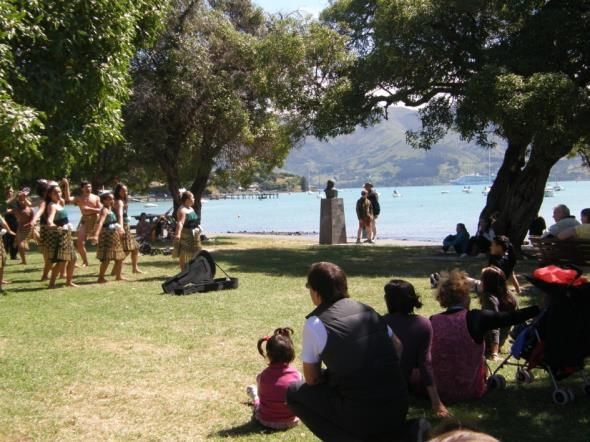
Table of Contents
ACKNOWLEDGMENTS .......................................................................................................................................I

TABLE OF CONTENTS........................................................................................................................................II

LIST OF TABLES ...............................................................................................................................................III

LIST OF FIGURES..............................................................................................................................................III

EXECUTIVE SUMMARY .................................................................................................................................... V

1.0        INTRODUCTION ................................................................................................................................... 1

   1.1 BACKGROUND................................................................................................................................................... 2
      1.1.1 Cruise tourism in New Zealand ............................................................................................................. 2
      1.1.2 Cruise tourism in Akaroa ....................................................................................................................... 3

2.0 VISITOR SURVEY ......................................................................................................................................... 4

   2.1 METHODS ........................................................................................................................................................ 4
      2.1.1 Questionnaire Design ............................................................................................................................ 6
      2.1.2 Data Analysis ........................................................................................................................................ 7
   2.2 RESULTS AND DISCUSSION ................................................................................................................................... 7
      2.1.1 Sample characteristics .......................................................................................................................... 7
      2.2.2 Decision-making for organised tours .................................................................................................... 9
      2.2.3 Destinations visited ............................................................................................................................. 11
      2.2.4 Most enjoyed aspects of destinations visited...................................................................................... 13
      2.2.5 Least enjoyed aspects of destinations visited ..................................................................................... 15
      2.2.6 Visitor spending during their Akaroa port visit ................................................................................... 17
      2.2.7 Responses to destination specific statements..................................................................................... 25
      2.2.8 Visitor satisfaction .............................................................................................................................. 29
      2.2.9 Attractions and activities for Akaroa port visits in the future ............................................................. 32
   2.3 CONCLUSION .................................................................................................................................................. 35

3.0 BUSINESS STAKEHOLDER INTERVIEWS ..................................................................................................... 36

   3.1 METHOD ....................................................................................................................................................... 36
   3.2 RESULTS ........................................................................................................................................................ 37
      3.2.1 Perceptions of the cruise ship visitor market ...................................................................................... 37
      3.2.2 Economic engagement with the cruise ship visitor market................................................................. 38
      3.2.3 Visitor spending................................................................................................................................... 39
      3.2.4 Business challenges ............................................................................................................................. 41
      3.2.5 Hosting the cruise ships ...................................................................................................................... 43
      3.2.6 Cruise ships in context ......................................................................................................................... 46
      3.2.7 The visitor experience ......................................................................................................................... 47
   3.3 CONCLUSION .................................................................................................................................................. 49

4.0 CONCLUDING COMMENTS ....................................................................................................................... 51

   4.1 VISITOR SPENDING ........................................................................................................................................... 51
   4.2 VISITOR EXPERIENCE ......................................................................................................................................... 52

REFERENCES................................................................................................................................................... 54

APPENDICES................................................................................................................................................... 55

                                                                                                                                                                        ii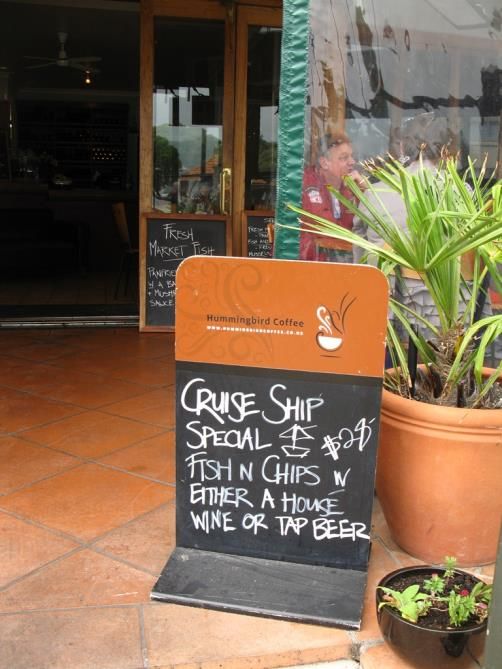
APPENDIX ONE: VISITOR SURVEY - QUESTIONNAIRE..................................................................................................... 55
   APPENDIX TWO: LIST OF STAKEHOLDER INTERVIEW QUESTIONS (GUIDE ONLY) ................................................................. 60

List of Tables

FIGURE 1: AGE GROUPS OF RESPONDENTS (N=430) ........................................................................................................... 8
FIGURE 2: NUMBER OF PREVIOUS CRUISES FOR RESPONDENTS (N=301) ................................................................................. 9
FIGURE 3: DECISION-MAKING ABOUT ACTIVITIES (N=428) ................................................................................................. 10
FIGURE 4: TOTAL SPENDING FOR DESTINATION LOCATIONS BY SPENDING BANDS (N=433) ....................................................... 18
FIGURE 5: SPENDING ON TOURS FOR DESTINATION LOCATIONS BY SPENDING BANDS (N=431) .................................................. 19
FIGURE 6: SPENDING ON TRANSPORTATION FOR DESTINATION LOCATIONS BY SPENDING BANDS (N=431) ................................... 20
FIGURE 7: SPENDING ON RESTAURANT MEALS FOR DESTINATION LOCATIONS BY SPENDING BANDS (N=431) ................................ 22
FIGURE 8: SPENDING ON OTHER FOOD AND REFRESHMENT FOR DESTINATION LOCATIONS BY SPENDING BANDS (N=431) ............... 22
FIGURE 9: SPENDING ON SHOPPING AND SOUVENIRS FOR DESTINATION LOCATIONS BY SPENDING BANDS (N=431) ....................... 23
FIGURE 10: SPENDING ON ‘OTHER’ UNSPECIFIED ITEMS/ACTIVITIES FOR DESTINATION LOCATIONS BY SPENDING BANDS (N=431) .... 24
FIGURE 11: STATEMENTS DESCRIBING AKAROA (DATA REPORTED AS A PERCENTAGE OF RESPONDENTS) ...................................... 25
FIGURE 12: STATEMENTS DESCRIBING CHRISTCHURCH (DATA REPORTED AS A PERCENTAGE OF RESPONDENTS)............................. 28
FIGURE 13: SATISFACTION WITH OVERALL AKAROA PORT VISIT (N=413) .............................................................................. 30
FIGURE 14: LIKELIHOOD OF RETURNING TO AKAROA ON A CRUISE (N=418) .......................................................................... 30
FIGURE 15: LIKELIHOOD OF VISITING AKAROA IN THE FUTURE (N=418)................................................................................ 31
FIGURE 16: LIKELIHOOD OF VISITING CHRISTCHURCH IN THE FUTURE (N=417) ...................................................................... 31
FIGURE 17: LIKELIHOOD OF RECOMMENDING ‘THIS REGION’ TO FAMILY AND FRIENDS (N=414) ................................................ 32
FIGURE 18: RATING THE APPEAL OF ACTIVITIES FOR FUTURE PORT VISITS (N=313) ................................................................. 33

List of Figures

FIGURE 1: AGE GROUPS OF RESPONDENTS (N=430) ........................................................................................................... 8
FIGURE 2: NUMBER OF PREVIOUS CRUISES FOR RESPONDENTS (N=301) ................................................................................. 9
FIGURE 3: DECISION-MAKING ABOUT ACTIVITIES (N=428) ................................................................................................. 10
FIGURE 4: TOTAL SPENDING FOR DESTINATION LOCATIONS BY SPENDING BANDS (N=433) ....................................................... 18
FIGURE 5: SPENDING ON TOURS FOR DESTINATION LOCATIONS BY SPENDING BANDS (N=431) .................................................. 19
FIGURE 6: SPENDING ON TRANSPORTATION FOR DESTINATION LOCATIONS BY SPENDING BANDS (N=431) ................................... 20
FIGURE 7: SPENDING ON RESTAURANT MEALS FOR DESTINATION LOCATIONS BY SPENDING BANDS (N=431) ................................ 22
FIGURE 8: SPENDING ON OTHER FOOD AND REFRESHMENT FOR DESTINATION LOCATIONS BY SPENDING BANDS (N=431) ............... 22
FIGURE 9: SPENDING ON SHOPPING AND SOUVENIRS FOR DESTINATION LOCATIONS BY SPENDING BANDS (N=431) ....................... 23
FIGURE 10: SPENDING ON ‘OTHER’ UNSPECIFIED ITEMS/ACTIVITIES FOR DESTINATION LOCATIONS BY SPENDING BANDS (N=431) .... 24
FIGURE 11: STATEMENTS DESCRIBING AKAROA (DATA REPORTED AS A PERCENTAGE OF RESPONDENTS) ...................................... 25
FIGURE 12: STATEMENTS DESCRIBING CHRISTCHURCH (DATA REPORTED AS A PERCENTAGE OF RESPONDENTS)............................. 28
FIGURE 13: SATISFACTION WITH OVERALL AKAROA PORT VISIT (N=413) .............................................................................. 30
FIGURE 14: LIKELIHOOD OF RETURNING TO AKAROA ON A CRUISE (N=418) .......................................................................... 30
FIGURE 15: LIKELIHOOD OF VISITING AKAROA IN THE FUTURE (N=418)................................................................................ 31
FIGURE 16: LIKELIHOOD OF VISITING CHRISTCHURCH IN THE FUTURE (N=417) ...................................................................... 31
FIGURE 17: LIKELIHOOD OF RECOMMENDING ‘THIS REGION’ TO FAMILY AND FRIENDS (N=414) ................................................ 32
FIGURE 18: RATING THE APPEAL OF ACTIVITIES FOR FUTURE PORT VISITS (N=313) ................................................................. 33

                                                                                                                                                      iii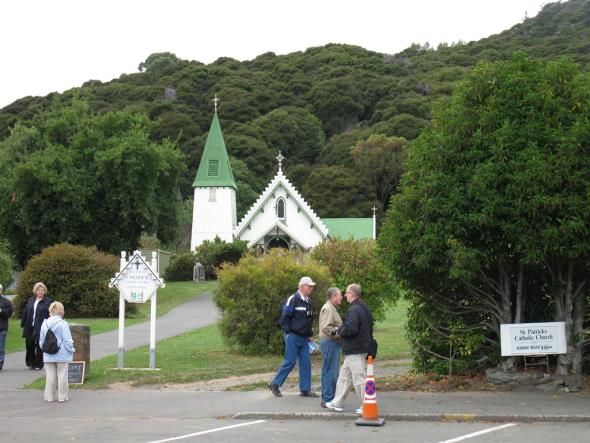
List of Photographs
PHOTOGRAPH 1: (COVER) CRUISE SHIP IN AKAROA HARBOUR (EMMA STEWART) ..................................................................... I
PHOTOGRAPH 2: PASSENGERS DISEMBARKING AKAROA WHARF (JUDE WILSON) ..................................................................... IV
PHOTOGRAPH 3: PRINCESS CRUISES WELCOME AREA, AKAROA WHARF (EMMA STEWART) ........................................................ 4
PHOTOGRAPH 4: DIAMOND PRINCESS IN AKAROA HARBOUR (EMMA STEWART) ..................................................................... 4
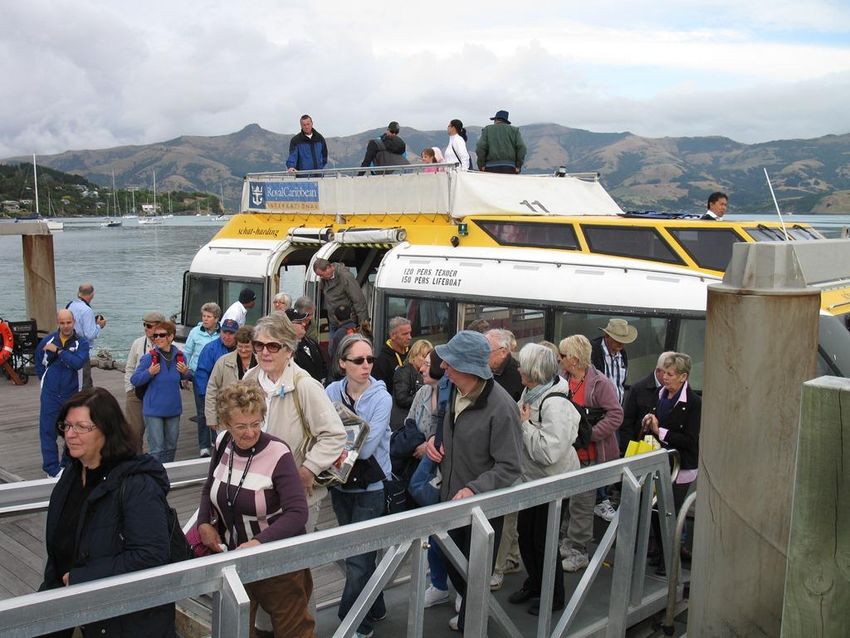
PHOTOGRAPH 5: RADIANCE OF THE SEAS TENDER APPROACHING AKAROA WHARF (JUDE WILSON) ............................................. 4
PHOTOGRAPH 6: TOURS AND TRANSPORTATION AKAROA WHARF (JUDE WILSON) ................................................................. 19
PHOTOGRAPH 7: BUSES LINED UP TO TAKE TOURS TO CHRISTCHURCH (JUDE WILSON) ............................................................ 19
PHOTOGRAPH 8: INDEPENDENT OPERATORS, AKAROA WHARF (JUDE WILSON)...................................................................... 39
PHOTOGRAPH 9: AKAROA FOOD OUTLET ADVERTISING CRUISE SHIPS SPECIAL (JUDE WILSON)................................................... 39
PHOTOGRAPH 10: TEMPORARY INFORMATION CENTRE, AKAROA WHARF (JUDE WILSON) ....................................................... 40
PHOTOGRAPH 11: TOUR BUSES AKAROA (JUDE WILSON) .................................................................................................. 40
PHOTOGRAPH 12: THE MAORI GREETING (EMMA STEWART)............................................................................................. 48
PHOTOGRAPH 13: ENJOYING AKAROA’S CHARMS (JUDE WILSON) ...................................................................................... 48
PHOTOGRAPH 14: WELCOME TO AKAROA (JUDE WILSON)................................................................................................ 49
PHOTOGRAPH 15: PHOTOGRAPHING ONE’S OWN SHIP (JUDE WILSON)................................................................................ 49
PHOTOGRAPH 16: WALKING INTO AKAROA TOWNSHIP (JUDE WILSON) .............................................................................. 49
PHOTOGRAPH 17: VISITING THE LOCAL CHURCH, AKAROA (JUDE WILSON) ........................................................................... 49
Photograph 2: Passengers disembarking Akaroa wharf (Jude Wilson)
iv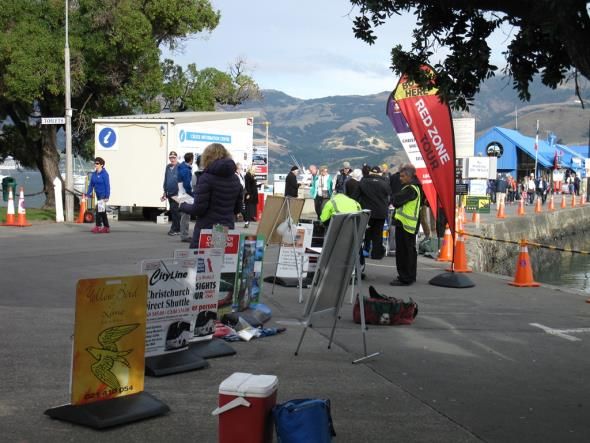
Executive Summary
Christchurch and Canterbury Tourism (CCT) commissioned this research to assess the impact of
cruise ship tourists on the Canterbury economy. As a result of damage to Lyttelton Port suffered
during the 2010-2011 Canterbury earthquakes, the vast majority of cruise ships arrivals in
Canterbury have been relocated to Akaroa Harbour. During the 2012/2013 cruise ship season 86
ships carrying 143,925 passengers were scheduled to visit Akaroa. This level of cruise ship arrivals in
Akaroa represents a significant increase on previous years.
The research, undertaken in both Christchurch and Akaroa, was in two parts: a visitor survey of 433
cruise ship passengers conducted during the cruise ship season; and a set of business stakeholder
interviews undertaken at the conclusion of the cruise ship season.
Visitor survey
Survey respondents were primarily from Australia (70%) and the USA (15.6%); more than
half were aged over 60 years; over half were travelling with a partner or spouse; and, almost
70 per cent had been on at least one cruise previously.
Of the 433 visitors surveyed, 50 per cent stayed in Akaroa Township, 39 per cent visited
Christchurch.
Just under half of all respondents (47.7%) went on an organised tour during their visit
Respondents reported participating in a wide range of activities:
o The three most popular activities in Akaroa were: walking around (88.2% of
respondents), eating and drinking (59.2%) and shopping (56.7%).
o The four most popular activities in Christchurch were visiting specific sites: Botanic
Gardens (56.7% of respondents), Re: START Container Mall (56.9%), earthquake-
related sites (55.7%), Canterbury Museum (55.1%).
Reasons for not visiting Christchurch included: having been before (24.6%), not wishing to
see the earthquake damage (20.9%) and wishing to do activities in Akaroa (17.1%); 7.1 per
cent of respondents were not aware of the opportunity to visit Christchurch.
The most enjoyed aspects of Akaroa visits were the scenery (reported by 42.2% of
respondents), the pretty town (34.5%), the relaxed village atmosphere (19.9%) and the
friendly people (15.6%).
The most enjoyed aspects of Christchurch visits were seeing earthquake/recovery sites
(26.5% of respondents), the scenery (18.4%) and having a good tour experience (18%).
In Akaroa 74.4 per cent of respondents reported there was nothing they least liked about
their visit (the corresponding figure for Christchurch visits was 63%). The weather
encountered featured in both locations as a least liked aspect of visits.
The average (mean) spend of all respondents was $129.26; those who stayed in Akaroa
reported an average spend of $117.90 and those who visited locations outside Akaroa
reported an average spend of $141.55.
o Those who stayed in Akaroa spent more on restaurant meals and other food, and on
shopping and souvenirs.
o Those who went to Christchurch spent more on tours.
When asked to rate destination attributes of Akaroa there was strong agreement that
Akaroa has a beautiful natural landscape, is a friendly town and safe destination. There was
v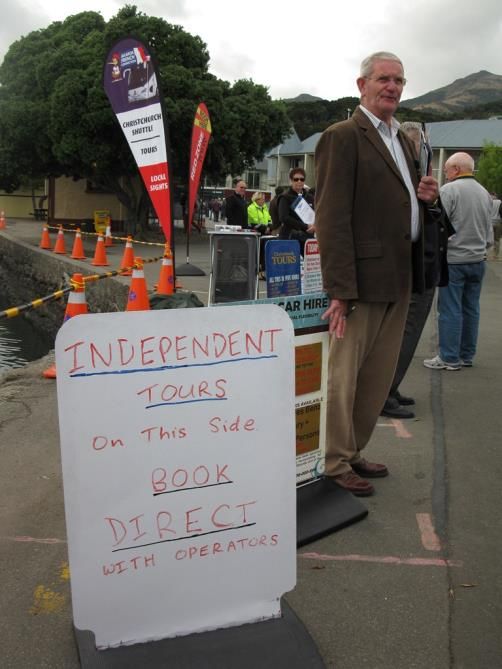
slightly weaker agreement with statements describing its interesting heritage buildings,
French flavour and availability of a range of things to see and do.
Strong agreement was reported in respect of Christchurch being a friendly city, having
beautiful natural landscapes, interesting heritage buildings and being a safe city. There was
slightly less agreement with there being a lot of things to see and do and it being a lively city.
The majority of respondents disagreed with the statements that Christchurch and Akaroa
were expensive destinations (54.2% and 56.3%, respectively).
Altogether 64 per cent of respondents were highly satisfied with their port visit, 58.9 per
cent reported that they were likely to return on a cruise to Akaroa, 67 per cent reported that
they would return to Akaroa and 69.3 per cent that they would return to Christchurch.
Altogether, 90.3 per cent of respondents reported that they would recommend the region
to family and friends.
The most appealing activities for future visits (selected from a provided list) were
experiencing local food and wine (84.5% of respondents), visiting a museum (66.9%)
experiencing Maori culture (63.3%) and attending a performing arts event (52.7%). Going on
a winery tour, visiting and art gallery and farm tours were rated unappealing by more than
half of respondents.
Business stakeholder interviews
The business stakeholders interviewed (14 Akaroa-based, 7 Christchurch-based) were
primarily those who catered to independent visitors (i.e., not with wholesalers or inbound
operators) and represented a range of business types.
Respondents almost universally agreed that it was highly unpredictable which shipping lines,
particular cruises or types of passengers brought the most economic benefits.
Economic engagement with the cruise ship market varied according to particular business’
type, size and previous engagement with the cruise ship market.
While cruise ship visitor spending was primarily on smaller (low value) items and only
contributed between five and 30 per cent of annual turnover, this spending was enough to
support extra employment and engendered considerable business confidence which had
been badly shaken by the global recession and the impacts of the Canterbury earthquakes.
For local companies who do not have arrangements in place with wholesalers or inbound
operators there are considerable business challenges associated with accessing the cruise
ship visitor market. The hosting of cruise ships in Akaroa (rather than Lyttelton) introduced a
number of logistical challenges.
There was a considerable reluctance to institute long-term changes as a result of uncertainty
around the longevity of Akaroa port visits and the relatively small contribution to overall
business income by the cruise ship market.
Suggestions for new product development included more local (i.e., Banks Peninsula) tours,
engagement with local Maori culture and greater involvement of the local population in the
delivery of tourism products.
Respondents reported positive feedback from visitors associated with the uniqueness of
both Akaroa (e.g., its charm, scenic beauty and village atmosphere) and Christchurch (e.g.,
based on the earthquake and recovery experience).
vi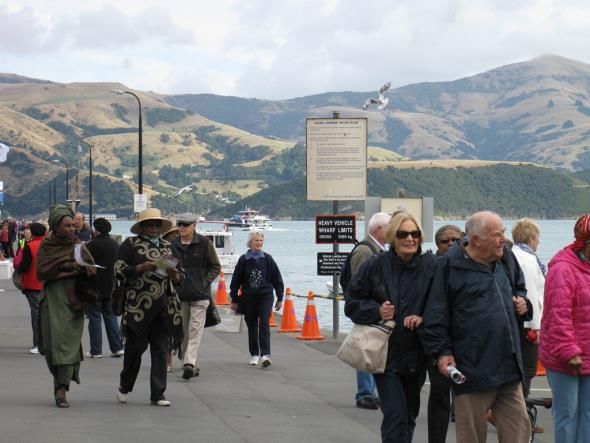
1.0 Introduction
As a consequence of earthquake damage and on-going repairs to the Port of Lyttelton, the town of
Akaroa experienced a dramatic increase in the number of cruise ships visits during the 2011-2013
seasons. In response to this situation, Christchurch and Canterbury Tourism (CCT) has commissioned
a research project assessing the impact of cruise ship tourists on the Akaroa, Christchurch and
Canterbury economy. The project brief outlines the requirement for:
Part A: A report on a visitor survey of cruise ship tourists visiting the port of Akaroa over the
2012/2013 cruise season;
Part B: A report based on interviews with key business stakeholders assessing the economic impact
of cruise ship tourists on their business.
The overall aim of Part A was to examine the perceptions, experiences and economic impact of
cruise ship passengers in Akaroa, Christchurch and Canterbury; with the specific objectives of:
Exploring the characteristics of cruise ship passengers visiting Akaroa and their patterns of
behaviour in port;
Documenting passenger perceptions of Christchurch and Akaroa post-earthquake as well as
exploring visitors’ experiences of Christchurch and Akaroa;
Recording cruise ship passenger expenditure in Akaroa and Christchurch; and
Assessing cruise ship passengers satisfaction and examining the likelihood of passengers
making a return visit to the region.
Linked to Part A was a secondary project that assessed, from the perspective of Akaroa and
Christchurch business stakeholders, the economic impact of increased cruise ship activity in Akaroa.
The stakeholders involved in the research were determined in conjunction with CCT. The specific
objectives of the business stakeholder research were:
Elicit a supply-side view of the economic impacts of cruise ship tourism.
Understand the hosting experiences of a variety of business stakeholders in Akaroa and
Christchurch with respect to the cruise ship visitor market.
As such, this report is divided into four sections:
Section 1 provides contextual material relating to the growth in cruise ship activity in New
Zealand and specifically in Akaroa;
Section 2 outlines the methods used and presents the research results of Part A (the visitor
survey);
Section 3 outlines the methods used and presents the results from Part B (the business
stakeholder interviews); and
Section 4 presents concluding comments in respect of both sets of research findings.
1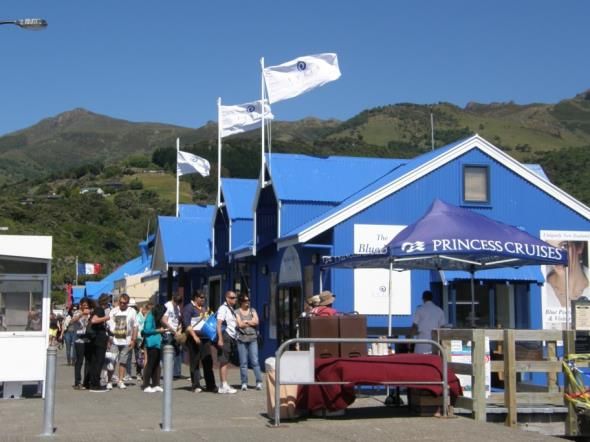
1.1 Background
1.1.1 Cruise tourism in New Zealand
The cruise ship tourism industry has exhibited strong growth in New Zealand over the past 15 years.
For example, in the 1996/97 season a total of 27 cruises brought 19,400 passengers to New Zealand.
By the 2011/12 season, this figure had increased to 121 cruises carrying 173,819 passengers (Market
Economics Limited, 2012: ii). This represents an increase of over this 15 year period of 809 per cent
on the 1996/97 figure (see Table 1). This growth trend has become particularly pronounced since the
2009/10 cruise season, when 109,951 passengers visited New Zealand. Growth in visitation over the
two subsequent seasons (i.e., up to, and including, the 2011/12 season) indicates a growth rate of
58.1 per cent on the 2009/10 season (Tourism New Zealand, 2012). This growth is reflective of a
global trend, which has seen the cruise sector grow to more than 20.6m passengers in 2011, up
more than 106 per cent since 2000 (Market Economics Limited, 2012: 1).

It is expected that this growth in the cruise sector is likely to continue, with larger ships visiting and
passenger numbers continuing to increase. Specifically, forecasts for the recently completed
2012/13 anticipated that 130 cruise ship voyages would bring a total of 205,730 passengers to New
Zealand. In addition to these passengers, these ships were expected to also carry a total of 93,000
crew (Market Economics Limited, 2012: 23). This view of the sector appears to be shared by Tourism
New Zealand (2013), which notes on its ‘Cruise Sector’ web page that cruise tourism is the fastest-
growing of New Zealand's tourism sectors and has considerable potential for future growth.

Table 1: Number of cruises and passengers in New Zealand (1996/97 - 2012/13)

                                 New Zealand’s Cruise Summary
                              Number of                                      No. Of
Year                                           % Change                                         % Change
                               Voyages                                   Passengers
1996/97                             27                  -                    19,400                      -
2008/09                                              -2.0                                             +2.4
                                    96                                      118, 976
2009/10                                                   -15.6                                       -7.6
                                       81                                   109, 951
2010/11                                                    14.8                                     +23.8
                                       93                                   136,168
2011/12                                                    29.0                                     +27.7
                                      120                                   173,819
2012/13 (forecast)                                          8.3                                     +18.4
                                      130                                   205,730
(Source: Tourism New Zealand, 2012)

In addition to the growth in cruise arrivals to New Zealand, there are also considerable economic
benefits associated with the sector. According to Market Economics Limited (2012: ii-iii), cruise ship
passengers generated $411.8m in direct spending during the 2010/11 season. This was anticipated
to increase to $474.5m in 2011/12 (+15.2%). The direct spend generated during the 2010/11 season
generated $718.6m in total gross output, in turn contributing to $288.9m to New Zealand’s GDP (in
the form of value added) for that period. In addition, the cruise industry sustained, either directly or
indirectly, a total of 4,961 ‘employment count’ (as opposed to FTE) jobs. Each passenger whom

                                                                                                         2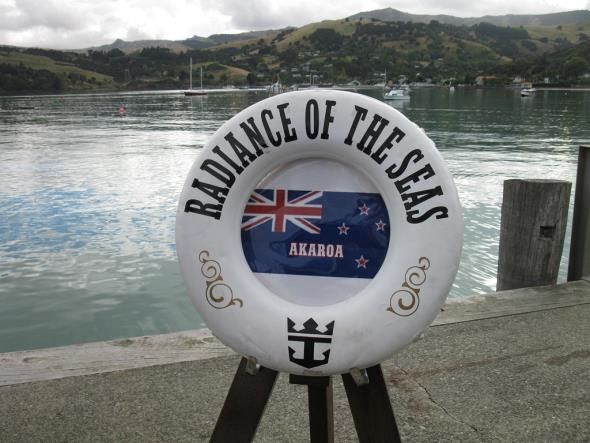
travels on a cruise ship to New Zealand is estimated to generate almost $1,700 in value added for
the economy. In terms of passenger nationality, data obtained by Tourism New Zealand (2012) for
the 2011/12 cruise season indicate that 54.8 per cent of cruise passengers to New Zealand are from
Australia, 14.8 per cent are from USA, 10.7 per cent are from New Zealand (i.e., domestic visitors),
and 7.3 per cent are from UK.

1.1.2 Cruise tourism in Akaroa
As noted in Section 1.0 of this report, over the past two seasons the level of cruise tourism in Akaroa
has rapidly increased as a result of the damage to Lyttelton Port from the Christchurch earthquake in
February 2011. Lyttelton was one of the major ports of calls for the South Island before the
earthquake. As a consequence of the earthquake damage to Lyttelton, 29 of the 64 vessels
scheduled to berth at the port during the 2011/12 cruise ship season were transferred to Akaroa
Harbour for their port visit (Lyttelton Harbour Information Centre, 2011). This immediate response
of rescheduling cruise ship arrivals from Lyttelton to Akaroa has subsequently been increased
significantly. The following data help to illustrate this growth trend (see Table 2).

In the 2009/10 cruise season, Akaroa had 8,754 cruise ship passenger arrivals. In the 2010/11
season, this figure had increased to 21,067 passenger arrivals (+140.7% on the previous season). By
2011/12, this figure had grown to 125,667 passenger arrivals (+496.5% on the previous season) (Tan
& Summers, 2012). At the time of writing, official cruise passenger data was yet to be released for
the 2012/13 cruise season. However, 86 cruise ship arrivals were scheduled for Akaroa in this
season, and forecasts suggest that passenger arrivals would be 143,935 (+14.5% of the previous
season).

Table 2: Total number of passenger arrivals and percentage change in Akaroa 2008-2013

                             Total passenger arrivals Akaroa 2008-2013
Year                                     Total Passenger Arrivals                           % Change
2008/2009                                                   4,882                                   -
2009/2010                                                                                       +79.3
                                                              8,754
2010/2011                                                                                       +140.7
                                                            21,067
2011/2012                                                                                       +496.5
                                                           125,667
2012/2013 (forecast)                                                                             +14.5
                                                           143,925

During the 2011/2012 season the Canterbury region received a significant boost from the cruise
industry with $30.2 million worth of value added to the economy (Market Economics Limited, 2012).
In Canterbury 558 direct/ indirect FTE jobs were supported by the industry. The three dominant
nationalities to arrive in Akaroa during the 2011/2012 season were: Australia (64.3%), USA (16.6%),
and UK (5.5%) (Tan & Summers, 2012). The dominance of Australians amongst cruise passengers to
Akaroa marks a shift from cruise ship visitors prior to the Canterbury earthquakes (2008/2009) when
American passengers (48.4%) dominated arrivals (Tan & Summers, 2012).

                                                                                                       3
2.0 Visitor Survey
2.1 Methods
Part A of this research was conducted using a surveyor-completed questionnaire with cruise ship
passengers in Akaroa and Christchurch. A convenience sampling method was employed whereby
cruise ship passengers aged 18 and over were approached and asked to participate in the research.
In Akaroa, surveyors were stationed at the main wharf (at the southern end of the township) where
passengers boarded the ships’ tenders to return to the cruise ships. In Christchurch, surveyors were
stationed outside the Canterbury Museum near the bus stops used by the cruise ship transfer and
tour companies. A convenience sampling procedure was utilised, whereby every third person
queuing for the tenders (in Akaroa) and the tour buses (In Christchurch) was approached and asked
to participate in the survey.
Photograph 3: Princess Cruises welcome area,
Akaroa wharf (Emma Stewart)
Photograph 4: Diamond Princess in Akaroa Photograph 5: Radiance of the Seas tender
Harbour (Emma Stewart) approaching Akaroa wharf (Jude Wilson)
A total of 433 surveys were undertaken with cruise ship passengers over a twelve-week period from
25 November 2012 to 17 February 2013. Of these surveys, 289 were completed in Akaroa, and 144
were completed in Christchurch. In order to gain a diverse sample, and to ascertain if there were any
differences in the perceptions, experiences and expenditure of cruise ship passengers from different
vessels, data collection days were chosen to ensure passengers from a range of ships were sampled
4in the research. The cruise ships from which passengers were surveyed and the date, location, and
number of surveys collected on each data collection day are outlined in Table 3.
Table 3: Passenger survey: summary of collection characteristics (n=430)
Date Survey Location Ship(s) Ship Company Number of
Surveys
25/11/2012 Akaroa Sea Princess Princess Cruises 14
Dawn Princess Princess Cruises 11
11/12/2012 Christchurch Sea Princess Princess Cruises 15
16/12/2012 Christchurch Celebrity Solstice Celebrity Cruises 10
20/12/2012 Akaroa Dawn Princess Princess Cruises 23
21/12/2012 Akaroa Sea Princess Princess Cruises 42
22/12/2012 Akaroa Sun Princess Princess Cruises 21
23/12/2012 Christchurch Diamond Princess Princess Cruises 9
5/1/2013 Akaroa Dawn Princess Princess Cruises 25
7/1/2013 Akaroa Sun Princess Princess Cruises 20
8/1/2013 Akaroa Celebrity Solstice Celebrity Cruises 31
18/1/2013 Akaroa Oosterdam Holland American Line 9
Dawn Princess Princess Cruises 21
26/1/2013 Akaroa Crystal Symphony Crystal Cruises 16
27/1/2013 Akaroa Radiance of the Seas Royal Caribbean 27
28/1/2013 Akaroa Silver Whisper Silversea Cruises 3
Seabourn Odyssey Seabourn Cruises 9
Dawn Princess Princess Cruises 14
28/1/2013 Christchurch Dawn Princess Princess Cruises 10
30/1/2013 Christchurch Diamond Princess Princess Cruises 16
31/1/2013 Christchurch Celebrity Solstice Celebrity Cruises 14
3/2/2013 Christchurch Pacific Pearl P&O 14
8/2/2013 Christchurch Carnival Spirit Carnival Cruises 15
13/2/2013 Christchurch Sea Princess Princess Cruises 19
15/2/2013 Christchurch Oosterdam Holland American Line 10
17/2/2013 Christchurch Diamond Princess Princess Cruises 12
Passengers travelling on the Princess Cruises ships dominate the survey sample (63.2%, n=272).
Table 4 shows the percentage of survey respondents and the percentage of total cruise passenger
arrivals during all survey days, by individual cruise ship. Altogether, passengers from Princess Cruises
were slightly over-represented in the sample (60.3% of the total arrivals); there was also slight over
representation of passengers from the Radiance of the Seas, Crystal Symphony and the Seabourn
Odyssey. Passengers from the Celebrity Solstice were slightly under-represented.
5Table 4: Survey respondents by cruise ship (n=430)
Ship Percentage of Percentage of total cruise ship
survey passenger arrivals during all survey
respondents days
Dawn Princess 24.2 18.9
Sea Princess 20.9 14.8
Celebrity Solstice 12.8 16.3
Sun Princess 9.5 11.3
Diamond Princess 8.6 15.2
Radiance of the Seas 6.3 4.0
Oosterdam 4.4 7.3
Crystal Symphony 3.7 1.8
Carnival Spirit 3.5 5.1
Pacific Pearl 3.3 3.5
Seabourn Odyssey 2.1 0.9
Silver Whisper 0.7 0.9
The survey consisted of a four-page questionnaire (refer to Appendix One for the full questionnaire).
On average the survey took approximately ten minutes to complete, with some taking as long as 20
minutes. A high response rate was achieved with nine out of ten passengers approached agreeing to
participate. Lack of time (in Akaroa many passengers were in a hurry to catch their tender, in
Christchurch to board their bus), or the weather conditions were the main reasons given for refusal.
2.1.1 Questionnaire Design
The questionnaire was designed to provide an overview of the broader perceptions, experiences and
economic impact of cruise ship passengers in Akaroa, Christchurch and Canterbury.
To assess cruise ship visitors’ perceptions of Akaroa, Christchurch and Canterbury, Likert scale
questions were used. With Likert scales, respondents indicate their attitudes by checking how
strongly they agree or disagree with statements, ranging from very positive to very negative
attitudes (Zikmund, Ward, Lowe & Winzar, 2007). A range of statements which might be used to
describe Christchurch and Akaroa and were presented to respondents who rated them on a five
point Likert scale ranging from strongly agree (1) to strongly disagree (5). Show cards were used to
assist the respondents with the Likert scale questions.
To examine the experiences of cruise ship passengers in Akaroa, Christchurch and Canterbury areas
respondents were asked to report verbally to surveyors where they had visited and what activities
they had participated in during their port visit. They were also asked what they had most and least
liked about their visit.
To assess the economic impact of cruise ship passengers, respondents were asked how much they
had spent during their visit in Akaroa, Christchurch and Canterbury. Six categories of expenditure
used: Tour(s); Restaurant meals; Other food, refreshments; Shopping (e.g., souvenirs, gifts);
Transportation (excluding Tours); and, Other.
6A series of open-ended and closed questions were designed to explore the types of activities
passengers engage in and their satisfaction with their port visit. Data on respondents’ demographic
characteristics, travel party and past experiences with cruise ship travel were collected to gain an
insight into their personal profiles and test for any relationships with perceptions, experience or
expenditure patterns.
2.1.2 Data Analysis
SPSS (Statistical Package for the Social Sciences) software package was used to analyse the data.
Responses to the open-ended questions were coded and entered into SPSS. All data were analysed
using descriptive statistical techniques. Data were analysed by visit location, spend category and
activity type.
2.2 Results and Discussion
2.1.1 Sample characteristics
Sixteen nationalities were represented in the survey sample (see Table 5). The majority of
respondents were from Australia (70.4%, n=302), the United States of America (15.6%, n=67), the
United Kingdom (4.7%, n=20), and Canada (3.5%, n=15). There is clearly a high representation of
Australian respondents in this survey, in terms of the proportionality of nationalities represented in
the sample. A likely cause of this bias is the sampling methodology. For example, a high proportion
of survey days coincided with cruise ships from the Princess Cruise Line in port. The Princess Line
Cruises depart from Australia ports; the stakeholder interview data also confirmed that these ships
carry a significant number of Australian passengers.
Table 5: Nationality of survey respondents (n=433)
Nationality of respondents Percentage Frequency
Australia 70.4 302
USA 15.6 67
UK 4.7 20
Canada 3.5 15
New Zealand 1.9 8
Italy 0.9 4
Vietnam 0.9 4
Austria 0.2 1
Macedonia 0.2 1
Philippines 0.2 1
China 0.2 1
Papua New Guinea 0.2 1
Malaysia 0.2 1
Germany 0.2 1
Singapore 0.2 1
South Africa 0.2 1
7The survey sample is more heavily weighted toward female respondents (56.5%, n=243) than male
respondents (43.5%, n=187). It is unclear what impact, if any, this gender imbalance has on the
research findings. More than one-half of all respondents were over years 60 of age (see Figure 1).
The most commonly identified age groups are ‘60–69 years’ (35.3%, n=152), and ‘over 70 years’
(25.1%, n=108). There were very few respondents below the age of 40 years (8.3%, n=36).
Figure 1: Age groups of respondents (n=430)
Age group of respondents
160 152
140
Number of respondents
120 108
100
75
80
59
60
40
16 16
20 4
0
18-19 20-29 30-39 40-49 50-59 60-69 Over 70
Age group
Respondents were asked to provide an indication of their travel party. A majority of respondents
were travelling with a partner or spouse (52.2%, n=224) or ‘family’ (22.9%, n=99). A further 14.2 per
cent (n=61) were travelling with ‘family and friends’, and 8.4 per cent (n=36) were travelling with
‘friends’. Only 2.1 per cent (n=9) of respondents indicated they were travelling alone.
Respondents were also asked to provide information about their previous cruise ship experience. Of
the 433 respondents, a significant proportion had been on a cruise before (69.3%, n=298) when
compared with those whom had not (30.7%, n=132). Those respondents whom had been on a cruise
before were then asked to indicate how many cruises in total they had been on (see Figure 2 below).
The answers provided ranged from ‘once’ to ‘more than 20’. A total of 19.9 per cent (n=60) had been
on a cruise twice before, 35.9 per cent (n=108) had been on ‘three to five’ cruises, and 23.6 per cent
(n=71) had been on ‘six to ten’ cruises before.
8Figure 2: Number of previous cruises for respondents (n=301)
How many cruises have you been on?
120 108
Number of respondents
100
80 71
60
60
40
22 23
17
20
0
Once Twice 3-5 6-10 11-20 More than
20
Number of cruises
Respondents were also asked whether or not they had been to Akaroa or Christchurch before this
trip. For the majority of respondents this was their first visit to Akaroa and Christchurch (65.8%,
n=283). Less than one per cent of respondents (0.9%, n=4) had been only to Akaroa previously, while
18.1 per cent (n=78) had been only to Christchurch previously. In addition to this, a number of
respondents indicated they had previously visited both Akaroa and Christchurch (15.1%, n=65).
2.2.2 Decision-making for organised tours
Respondents were asked about how and where they made their decisions about which activities
they would undertake during their shore visit. There were four options provided to respondents (see
Figure 3). A majority of respondents (51.9%, n=222) indicated that they made their decision about
activities ‘once they arrived in Akaroa Township’. One-hundred and nine respondents (25.5%)
decided on their activities ‘while on board’, while a further 77 respondents (18%) ‘researched and/or
booked activities before leaving home’. Twenty respondents (4.7%) used ‘a combination’ of these
options to make their decisions about activities to undertake while in port. It is worth noting that it is
likely that the activities they chose had some bearing on when and where they made their decision.
For example, it is likely that respondents who went on the Tranz Alpine train journey to Arthur’s Pass
would have needed to have made their decision about the activity prior to arriving in Akaroa.
Analysis was also undertaken to determine if there were differences in response between those
whom stayed in Akaroa during their port visit and those whom travelled to locations outside of
Akaroa. There is a significant difference between those whom stayed in Akaroa and those whom left
in respect to when they researched, booked, and decided upon their activities for the day. Those
whom stayed in Akaroa, for example, were more than twice as likely to have made activities
decisions once they arrived in Akaroa Township. The reverse was the case for those whom left
Akaroa, with twice as many making their decisions either before leaving home or on board the ship
(i.e., before coming ashore in Akaroa).
9Figure 3: Decision-making about activities (n=428)
How did you choose your activity?
4.7%
Research and/or book
18% activities at home
Decide on activities while
onboard
Make decision about
activities once they are in
51.9% Akaroa
25.5%
Use a combination to
make decision about
activities
Respondents were asked whether or not they had been on an organised tour during their port visit.
This includes tours both within and beyond Akaroa. Responses were relatively even, with 47.7 per
cent (n=205) indicating that they had been on an organised tour, while the remainder replied that
they had not (52.3%, n=225). Of those respondents whom had been on an organised tour, a variety
of tours were identified (see Table 6). The activity or tour most commonly identified by respondents
was ‘Christchurch On Your Own’ (27.9%, n=55). This is a tour operated by Princess Line Cruises and,
as such, its popularity is likely to be influenced by the high proportion of the sample travelling on
Princess Line ships. The number of respondents who indicated undertaking this activity was more
than twice the number for the next most commonly identified activity: ‘Red Zone Bus Tour’ (11.2%,
n=22). A number of other activities, including ‘Wildlife Harbour Cruise’ and ‘Christchurch and
Countryside Farm Tour’, were also popular with respondents. No specific assessment was made
about quality of experience regarding any of these activities.
Table 6: Organised tours undertaken by respondents (n=197)
Tour Percentage Frequency
Christchurch On Your Own 27.9 55
Red Zone Bus Tour 11.2 22
Wildlife Harbour Cruise 9.6 19
Christchurch and Countryside Farm Tour 9.1 18
Double Decker Bus Tour 5.6 11
Historic Akaroa Walk 4.6 9
Local Akaroa Bays Sightseeing Tour 4.1 8
Vintage Car Tour 4.1 8
Mandalay Farm and Banks Peninsula 3.6 7
Christchurch and Antarctic Centre 3.6 7
102.2.3 Destinations visited
Respondents were asked a range of questions about the places they visited and activities they
engaged in during their stay. The first question asked if respondents had left Akaroa Township
during their port visit, and if so to identify the locations they had visited. Of the 422 respondents
whom answered this question, 50 per cent (n=211) stayed in Akaroa during their port visit. A further
39 per cent of respondents (n=167) visited Christchurch, eight per cent (n=35) visited locations on
Banks Peninsula (e.g., the Hilltop Hotel, Barry’s Bay), and two per cent visited locations further afield
in Canterbury (e.g., Arthur’s Pass, Waimakariri River, Woodend). It is important to note that this
finding is necessarily influenced by the methodology utilised in this research project. Specifically, of
the 433 surveys collected in this study, a total of 144 were collected in Christchurch. As such, it is not
possible to infer from this finding that 50 per cent of all cruise ship visitors to Akaroa remain in
Akaroa Township. Rather, the only conclusion that the research methodology supports on this point
is that 50 per cent of respondents in this research sample remained in Akaroa Township during their
port visit. Notwithstanding this methodological constraint, it is still possible to analyse the data to
reveal a range of visitor characteristics and patterns.
The respondents whom remained in Akaroa Township during their port visit undertook a range of
activities (see Table 7). The most commonly identified activity undertaken by these respondents was
‘walking around Akaroa’ (88.2%, n=186). The next most commonly identified activities in Akaroa
were ‘eating and drinking’ (59.2%, n=125), and ‘shopping’ (56.9%, n=120). An additional two
activities were identified by respondents to a lesser degree. These were ‘general sightseeing (27%,
n=57), and ‘guided tours’ (20.4%, n=43). Within these two activity categories, respondents identified
specific tours and sightseeing activities. For general sightseeing, respondents mentioned ‘visiting the
Akaroa lighthouse’ (6.6%, n=14), ‘looking at houses and gardens’ (6.6%, n=14), and ‘visiting the
Giant’s House’ (5.2%, n=11). For guided tours, respondents mentioned ‘walking tours’ (3.3%, n=7),
‘vintage car tours’ (3.3%, n=7), and ‘wildlife tours’ (2.8%, n=6).
Table 7: Activities undertaken by respondents in Akaroa (n=211)
Activity Percentage Frequency
Walking around Akaroa 88.2 186
Eating and drinking 59.2 125
Shopping 56.9 120
General sightseeing 27.0 57
Guided tour 20.4 43
(Multiple response question)
Respondents whom travelled to Christchurch during their port visit undertook a broader range of
activities (see Table 8). This is likely to be a function, at least in part, of the larger number of
activities available in Christchurch for visitors. Of the activities most commonly identified by
respondents, five in particular stood out: the ‘Botanic Gardens’ (56.9%, n=95), ‘Re: START Container
Mall’ (56.9%, n=95), ‘earthquake-related sites’ (55.7%, n=93), and the ‘Canterbury Museum’ (55.1%,
n=92), as well as ‘walking around the city’ (47.9%, n=80). Additional activities such as ‘eating and
drinking’ (36.6%, n=61) were also identified by respondents whom visited in Christchurch.
11Table 8: Activities undertaken by respondents in Christchurch (n=167)
Activity Percentage Frequency
Botanic Gardens 56.9 95
ReSTART Container Mall 56.9 95
Visiting earthquake sites (including Cathedral) 55.7 93
Canterbury Museum 55.1 92
Walking around Christchurch 47.9 80
Eating and drinking 36.6 61
Shopping 17.4 29
Going on a tour (unspecified) 13.1 22
Antarctic Centre 4.2 7
(Multiple response question)
A total of 35 respondents indicated that they visited locations on Banks Peninsula other than Akaroa
Township during their port visit (see Table 9). Approximately one-half of these respondents (51.4%,
n=18) stated that they had been on ‘a farm visit in Banks Peninsula’ during their port visit. A further
37.1 per cent (n=13) had visited ‘the Hilltop Tavern’, which overlooks Akaroa Harbour and affords a
scenic view of the surrounding countryside. Other activities identified by these respondents included
visiting ‘the Barry’s Bay Cheese Factory’ (14.3%, n=5), and visiting an ‘unspecified look-out over
Akaroa’ (14.3%, n=5). It is possible that this unspecified look-out might be the Hilltop Tavern,
however the data does not allow for a definitive answer on this point.
Table 9: Activities undertaken by respondents in Banks Peninsula (n=35)
Activity Percentage Frequency
Farm visit 51.4 18
Hilltop 37.1 13
Cheese factory 14.3 5
Look out (Akaroa) 14.3 5
(Multiple response question)
Nine respondents indicated that they had travelled to locations in Canterbury hinterland and alpine
regions during their port visit (see Table 10). It is important to note that the relatively small number
of respondents in this cohort makes it difficult to extend the findings of activities undertaken to
generalities. Nonetheless, it is useful to know what types of activities these respondents participated
in during their Canterbury visit. As such, the most commonly identified activity was ‘jet boating on
the Waimakariri River’ (55.6%, n=5), going on a ‘train journey to Arthur’s Pass’ (55.6%, n=5), and
‘taking a helicopter flight/tour to various areas within the Canterbury region’ (33.3%, n=3).
Table 10: Activities undertaken by respondents in Canterbury (n=9)
Activity Percentage Frequency
Jet boat 55.6 5
Train (Arthur’s Pass) 55.6 5
Helicopter 33.3 3
(Multiple response question)
12As a corollary to the destinations visited during the port visit question, respondents whom stayed in
Akaroa were asked ‘why did you choose not to visit Christchurch today?’ (see Table 11). This
question was asked in order to gain a better understanding of the range of reasons, motivations and
issues which may preclude cruise ship passengers from travelling on to more distant locations during
their visit. The most commonly identified reason for not travelling on to Christchurch related to the
distance (and time required) from Christchurch from Akaroa (42.6%, n=90). The issue of travel time
and distance from Akaroa to Christchurch, and the associated characteristics of the ride (e.g.,
uncomfortable bus journey), is noted later in this results section, particularly as it relates to aspects
least enjoyed by respondents visiting Christchurch. Given that most cruise ship passengers are in
port for one day only, it is reasonable to suggest there may be a distance decay component relating
to the propensity of cruise ship passengers to visit particular locations during their stay.
Other reasons for respondents not visiting Christchurch included: ‘I have been to Christchurch
before’ (24.6%, n=52), ‘the earthquake damage put me off visiting Christchurch’ (20.9%, n=44), and ‘I
am doing other activities in Akaroa already’ (17.1%, n=36). In addition to these reasons, a number of
respondents indicated that they wanted to use the Akaroa port visit to rest and relax (8.5%, n=18).
This suggests that there is likely to be a proportion of cruise ship passengers whom do not wish to
have their port visit dominated by organised tours and activities.
It is also of interest to note that a small number of respondents stated that they were not aware of
opportunity to visit Christchurch during their port visit (7.1%, n=15). This finding may suggest the
need for destination managers to improve conduits of information for cruise ship passengers.
Table 11: Reasons given for not travelling to Christchurch during the port visit (n=211)
Item Percentage Frequency
Too far to travel/not enough time 42.6 90
Been there before 24.6 52
Earthquake damage put me off going (sad) 20.9 44
Doing other things in Akaroa/Banks Peninsula/Canterbury 17.1 36
Resting/relaxing in Akaroa 8.5 18
Didn’t know about tours to Christchurch 7.1 15
Too difficult (disabilities/large groups/elderly) 5.2 11
Organised tours to Christchurch too expensive 4.7 10
Too late off the ship to catch the bus/shuttle 3.8 8
No reason 3.8 8
Other 5.7 12
‘Other’ includes: didn’t want to go, no rental cars available
(Multiple response question)
2.2.4 Most enjoyed aspects of destinations visited
Respondents were then asked what they enjoyed most about the destinations they visited during
their port visit. This question was asked in order to gain a clearer understanding about the range of
factors which are likely to impact positively on the destination experience of cruise ship passengers.
The findings for this section are categorised according to the two main destinations visited by
respondents: Akaroa and Christchurch.
13Akaroa
A range of items were identified by respondents regarding what they most enjoyed about their visit
to Akaroa Township (see Table 12). The two most commonly identified items, by some considerable
margin, were the ‘scenery’ (42.2%, n=89) and Akaroa being a ‘pretty town to visit’ (34.6%, n=73).
These two items were further complemented by the third most commonly identified item: the
relaxed village atmosphere of Akaroa (19.9%, n=42). Taken together, these three items suggest that
the scenic location of Akaroa, combined with the attractive townscape and relaxed pace of the
village, provide cruise ship tourists with an agreeable destination setting from which to embark upon
any number of activities. Additional items of significance identified included: ‘friendly people’
(15.6%, n=33), the ‘weather’ (15.1%, n=32), and ‘a good range of activities and attractions’ (14.7%,
n=31).
Table 12: Most enjoyed aspects of Akaroa Township visit (n=211)
Item Percentage Frequency
Scenery 42.2 89
A pretty town 33.6 73
Relaxed village atmosphere 19.9 42
Friendly people 15.6 33
Weather (good) 15.2 32
Activities/attractions 14.7 31
Shopping/restaurants/cafes 11.0 23
Sightseeing/wandering around the town 7.1 15
Everything 3.3 7
Other 7.6 16
‘Other’ includes: French ‘flavour’, ‘nothing’.
(Multiple response question)
Christchurch
As was the case for Akaroa, respondents also identified a range of items they most enjoyed about
their visit to Christchurch (see Table 13). When compared with the items identified for Akaroa, there
appears to be a more even spread of responses over a broader range of items. The most commonly
identified item by respondents regarding Christchurch was ‘visiting earthquake sites/recovery’
(26.5%, n=56). This was followed by ‘scenery’ (18.4%, n=39), although it must be noted that many
respondents whom identified this item spoke of the scenery in reference to the journey from Akaroa
to Christchurch (and return). As such, respondents appear to consider the scenery observed during
their journey to and from Christchurch as being a prominent, rather than incidental, component of
their city visit.
Another item which was identified commonly by respondents as being most enjoyable about their
Christchurch visit was ‘having a good tour experience’ (18.0%, n=38). These tour experiences
included interactive farm tours, as well as more general sightseeing coach tours around the city and
its hinterlands, including Lyttelton Harbour. As a corollary to this item, a number of respondents
(5.2%, n=11) also identified ‘having a high quality commentary’ during such tours as being an
enjoyable part of their visitor experience in Christchurch. When taken together, this finding suggests
that organised tours, and the associated components of that particular tourism product (e.g.,
14interpretation/information/commentary), form an important factor in the evaluation process of
cruise ship tourists. In addition to these items, other items commonly identified by respondents
included: ‘Christchurch is a pretty city’ (11.8%, n=25), visiting the Botanic Gardens (11.8%, n=25) and
the ‘weather’ (10.0%, n=21).
Table 13: Most enjoyed aspects of Christchurch visit (n=211)
Item Percentage Frequency
Visiting earthquake sites/seeing the ‘recovery’ 26.5 56
Scenery (including the journey from Akaroa) 18.4 39
A good tour experience 18.0 38
A pretty city 11.8 25
Botanic Gardens 11.8 25
Weather (good) 10.0 21
Canterbury Museum 9.0 19
Friendly people 7.1 15
Visiting the Re: Start Container Mall 5.7 12
Commentary during tour/activity 5.2 11
Everything 5.2 11
Sightseeing/wandering around the city 4.7 10
Other 5.7 12
‘Other’ includes: Visiting friends and family, reminiscing (returning ‘home’), city heritage
(Multiple response question)
2.2.5 Least enjoyed aspects of destinations visited
The survey asked respondents to identify the things they liked least about the destinations they
visited during their port visit. This question was asked in order to gain an understanding of the things
which were likely to have detracted from the overall destination experience of these visitors. In
doing so, it may be possible to identify areas of potential ‘weakness’ or visitor dissatisfaction. As was
the case with the previous section, the findings for this section are categorised according to the two
main destinations visited by respondents: Akaroa and Christchurch.
Akaroa
In response to this survey item, an overwhelming majority of respondents (74.4%, n=157) stated
that there was ‘nothing’ they enjoyed least about their Akaroa Township visit (see Table 14). This is
an important finding for destination managers in Akaroa, as it suggests that most respondents were
unable to identify any specific aspect of their visit which was displeasing to them. Of the other items
identified by respondents as being least enjoyable, the [bad/windy] weather appeared to be the
most prominent (10.0%, n=21). This item is clearly outside of the control of destination managers in
Akaroa. However it does suggest that visitor experiences in Akaroa might be vulnerable, at least to
some degree, to the vagaries of inclement weather. This is especially so, given the characteristics of
many Akaroa-based visitor activities and attractions (e.g., harbour/wildlife cruises, walking around
the town, general sightseeing). It is interesting to note that ‘[good] weather’ was identified above as
being something a number of respondents enjoyed most about their visit to Akaroa. A number of
other items were also identified by respondents, albeit at a very low level of response.
15You can also read