Cytotoxicity, Anti-Obesity and Anti-Diabetic Activities of Heteromorpha arborescens (Spreng.) Cham Leaves - MDPI
←
→
Page content transcription
If your browser does not render page correctly, please read the page content below
processes
Article
Cytotoxicity, Anti-Obesity and Anti-Diabetic Activities of
Heteromorpha arborescens (Spreng.) Cham Leaves
Taiwo Oluwafunmilola Abifarin, Gloria Aderonke Otunola *                               and Anthony Jide Afolayan

                                          Medicinal Plants and Economic Development (MPED) Research Centre, Department of Botany,
                                          University of Fort Hare, Alice 5700, South Africa; 201716181@ufh.ac.za (T.O.A.); aafolayan@ufh.ac.za (A.J.A.)
                                          * Correspondence: gotunola@ufh.ac.za

                                          Abstract: This study investigated the cytotoxicity, anti-obesity and anti-diabetic potentials of blanched,
                                          aqueous and ethanol extracts of Heteromorpha arborescens (Spreng.) Cham leaves. The results revealed
                                          that both ethanol and aqueous extracts exhibited considerable inhibition against α-glucosidase
                                          (IC50 of 627.29 ± 4.62 µg/mL and 576.46 ± 3.21 µg/mL respectively), while the blanched ex-
                                          tract showed weak α-glucosidase inhibition (IC50 ; 855.38 ± 4.29 µg/mL) and the aqueous extract
                                          showed the best α-amylase inhibition (IC50 ; 583.74 ± 5.87 µg/mL). However, weak α-amylase
                                          inhibition was observed in the ethanol (IC50 ; 724.60 ± 4.33 µg/mL) and blanched extracts (IC50 ;
                                          791.63 ± 3.76 µg/mL). The toxicity of the extracts is indicated by LC50 values as 154.75 µg/mL,
                                          125 µg/mL and 90.58 µg/mL for ethanol, aqueous and blanched extracts respectively, indicating
                                          the blanched extract to be the most toxic. Moderate glucose utilization in both C3A and L6 cells
                                          was also observed for the aqueous and ethanol extracts which may be attributed to the relatively
                                          lower toxicity levels present. However, glucose utilization was very weak for the blanched extract,
                                which may be due to higher level of cytotoxicity it possessed. Relatively weaker lipase inhibition

                                          was observed for the ethanol (IC50 ; 699.3 ± 1.33 µg/mL), aqueous (IC50 ; 811.52 ± 3.52 µg/mL) and
Citation: Abifarin, T.O.; Otunola,
                                          blanched extracts (IC50; 1152.7 ± 4.61 µg/mL) compared to orlistat (IC50; 56.88 ± 0.11 µg/mL). How-
G.A.; Afolayan, A.J. Cytotoxicity,
                                          ever, there was no reasonable reduction in lipid accumulation observed in all the extract treated cells.
Anti-Obesity and Anti-Diabetic
                                          These observations suggest that ethanol and aqueous extracts of H. arborescens leaf are promising as
Activities of Heteromorpha arborescens
(Spreng.) Cham Leaves. Processes
                                          new agents for the treatment of diabetes and its acclaimed anti-obesity potentials are likely due to its
2021, 9, 1671. https://doi.org/           lipase, α-amylase and α-glucosidase inhibition.
10.3390/pr9091671
                                          Keywords: diabetes mellitus; α-glucosidase; α-amylase; lipase; Heteromorpha arborescens; cytotoxicity;
Academic Editor: Irena Žižović           glucose utilization

Received: 9 August 2021
Accepted: 14 September 2021
Published: 16 September 2021              1. Introduction
                                               Diabetes mellitus is a chronic condition of carbohydrate, fat and protein metabolism
Publisher’s Note: MDPI stays neutral
                                          impairment, characterized by hyperglycemia and glucose intolerance which is associated
with regard to jurisdictional claims in
                                          with insulin deficiency and/or insulin inefficiency [1,2]. This disease is a primary fac-
published maps and institutional affil-
                                          tor for global mortality, and it is well associated with long term complications such as
iations.
                                          cardiovascular diseases, retinopathy, neuropathy and oxidative stress [3,4]. α-amylase
                                          and α-glucosidase are carbohydrate digestive enzymes which catalyze the degradation of
                                          large insoluble starch molecules into digestible oligosaccharide molecules and the final
                                          breakdown of the oligosaccharides, respectively. One of the therapeutic approaches for
Copyright: © 2021 by the authors.         reducing postprandial hyperglycemia is the inhibition of these enzymes to slow down
Licensee MDPI, Basel, Switzerland.
                                          absorption of carbohydrates in the small intestine [5–9]. Diabetes mellitus is also linked to
This article is an open access article
                                          obesity [10] and pancreatic lipase inhibitory activities as well as lipid accumulation have
distributed under the terms and
                                          been widely used to determine the potential efficacy of natural products as anti-obesity
conditions of the Creative Commons
                                          agents [11]. Even though there is presently no cure for diabetes, there are several groups
Attribution (CC BY) license (https://
                                          of artificial drugs which are commonly used for the management of diabetes: including
creativecommons.org/licenses/by/
                                          sulfonylureas, thiazolidinediones, non-sulfonylurea insulin secretagogues, biguanides and
4.0/).

Processes 2021, 9, 1671. https://doi.org/10.3390/pr9091671                                                   https://www.mdpi.com/journal/processes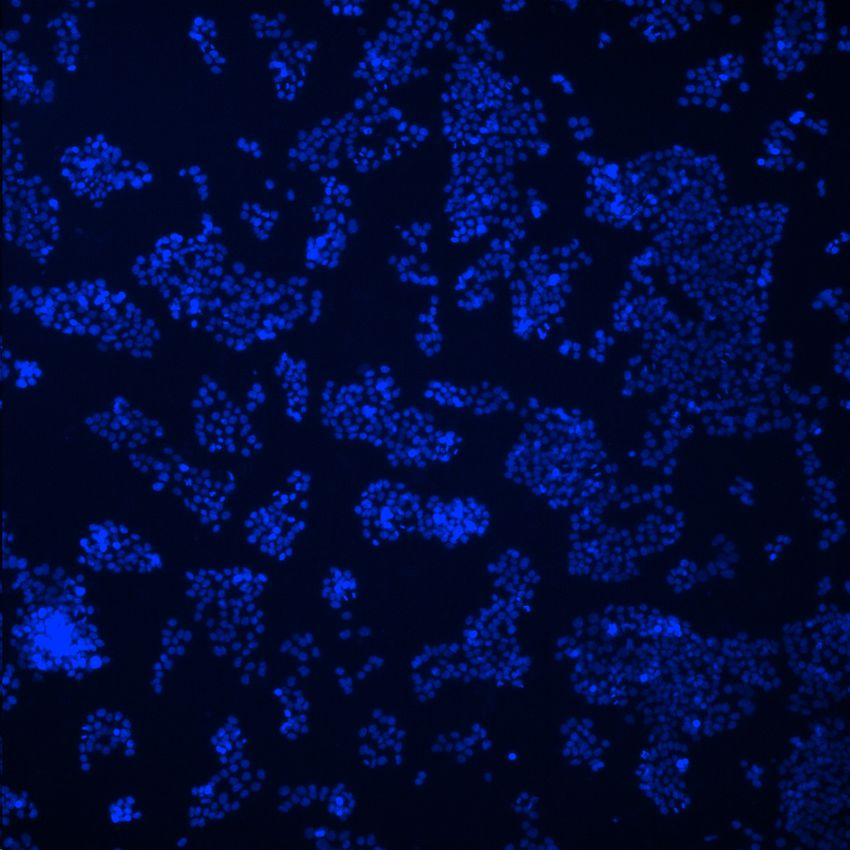
Processes 2021, 9, 1671                                                                                               2 of 17

                          α-glucosidase inhibitors [12]. However, the use of these drugs is limited in that they are
                          expensive; inaccessible for majority of the rural populations and some may have some
                          undesirable aftermath such as excessive weight, diarrhea, nausea and gastrointestinal
                          disorders [12–14]. On the other hand, medicinal plants are readily more available, with
                          lower side effects compared to the conventional drugs and are a safer alternative for the
                          management of diabetes and obesity [15,16]. Previous reports have indicated that some
                          plant extracts possess bioactivity; however, the potency of these extracts may be altered by
                          the cytotoxicity of the plants [17]. Hence the need to ascertain the safety and potency of
                          plants before use.
                                A frequently used plant for the management of diabetes mellitus in South Africa
                          is Heteromorpha arborescens [18–20]. This plant is highly reputed in the South African
                          traditional medicine for the treatment of a wide range of diseases such as rheumatism,
                          cancer, gonorrhea, heart problems, rabies and diabetes [21]. Several biological activities
                          have also been reported for H. arborescens such as anticancer and antimalarial [22–25],
                          antibacterial [26], aphrodisiac, antiulcer, anthelminthic, antinociceptive and analgesic [27]
                          and anti-rabies activities [21]. Presumably, only very limited scientific information is
                          available on the efficiency and safety of H. arborescens leaves in the treatment of diabetes and
                          its related complications. Therefore, to validate this claim, the cytotoxic, inhibitory activities
                          against α-amylase, α-glucosidase and lipase in addition to lipid accumulation potentials of
                          the aqueous, blanched and ethanol extracts of H. arborescens leaves were determined.

                          2. Materials and Methods
                          2.1. Chemicals, Reagents, Cell Lines
                               Melphalan, Dimethyl Sulfoxide (DMSO), Hoechst 33342, Propidium iodide (PI),
                          p-nitrophenol palmitate (pNPP), dinitrosalicylic acid (DNSA), Triton X-100, Tris-HCl
                          buffer, monosodium and disodium phosphate, acarbose, -nitrophenyl-d-glucopyranoside
                          p-nitrophenyl-α-D-glucopyranoside (pNPG), sodium carbonate, α-glucosidase, α-amylase,
                          isopropanol, Triton X-100, Metformin, Dulbecco’s Modified Eagle Medium (DMEM) and
                          Tris-HCl buffer were purchased from Sigma-Aldrich through Capital Lab Supplies, South
                          Africa. Bovine Serum Albumin (BSA), starch and insulin were purchased from Sigma
                          (St. Louis, MO, USA). Fetal Calf Serum (FCS), Roswell Park Memorial Institute (RPMI)
                          1640 Medium and 3-(4, 5-Dimethylthiazol-2-yl)-2, 5-diphenyltetrazolium bromide (MTT)
                          were purchased from GE Healthcare Life Sciences (Logan, UT, USA). The C3A/HepG2 cells
                          and L6 cell lines were obtained from Professor Maryna van de Venter, of the Department of
                          Biochemistry and Microbiology, Nelson Mandela University (NMU), South Africa, where
                          the assays were performed.

                          2.2. Plant Collection
                                Fresh H. arborescens leaves were collected from Alice, Eastern Cape, South Africa
                          (32◦ 470 50.400 S, 26◦ 520 41.800 E). The plant was validated by Prof. Cupido, a Taxonomist,
                          and a voucher specimen (Abif2019/03) was stored in the Giffen Herbarium, University of
                          Fort Hare.

                          2.3. Preparation of Extracts
                               Oven dried powdered H. arborescens leaves (100 g) were extracted separately in 500 mL
                          of ethanol and water for 24 h on an orbital shaker. For the blanched sample, the same
                          weight of the fresh leaves was extracted in 500 mL of hot water (80 ◦ C) for 5 min to simulate
                          home cooking, and then ground with a blender. All the extracts were filtered using a
                          Buchner funnel and Whatman filter paper (150 mm) under a vacuum. The ethanol extract
                          was concentrated to dryness using a rotary evaporator while the aqueous extract and
                          blanched samples were subjected to freeze drying.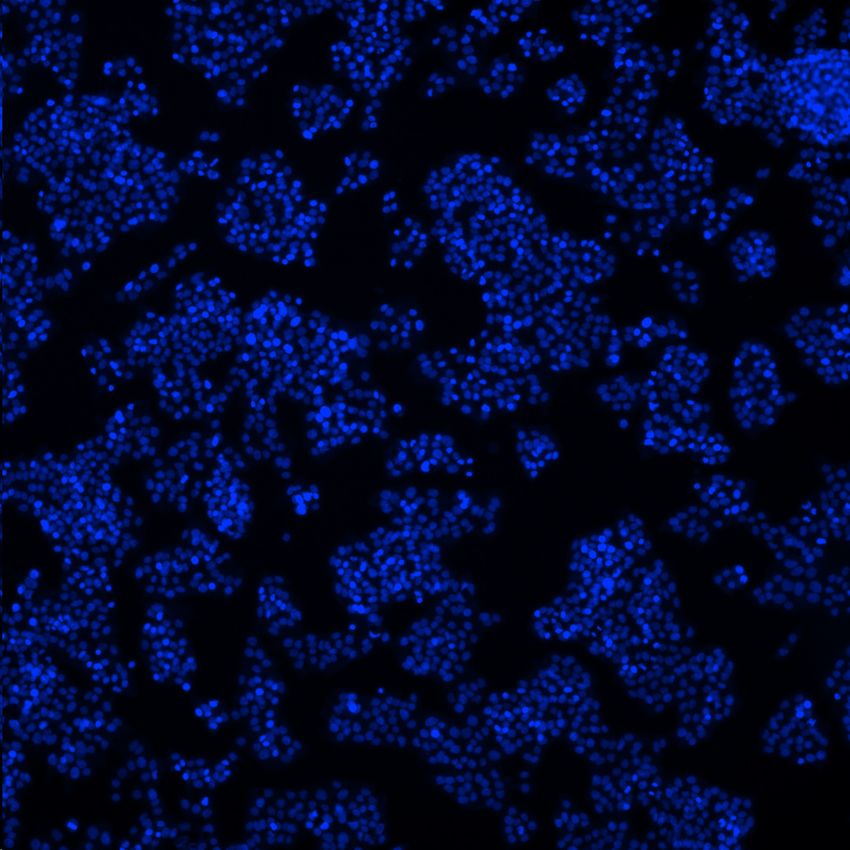
Processes 2021, 9, 1671                                                                                         3 of 17

                          2.4. Maintenance of Cell Culture
                                The cell cultures were incubated in a moistened environment with 5% CO2 at 37 ◦ C.
                          Growth medium (RPMI 1640 medium plus 10% fetal calf serum) was supplied to the C3A
                          cells once in 3 days, and the L6 myoblast cells were cultivated in media containing the
                          growth medium with no antibiotic. The cell lines were sub-cultured after 80% confluence.

                          2.5. Cytotoxicity Assay
                               Cytotoxicity of the extracts was determined using Hoechst/PI staining technique.
                          The C3A cells were seeded in 96-well plates at a density of 6000 cells per well in DMEM
                          containing 10% Fetal Bovine serum and allowed to attach overnight. The cells were there-
                          after treated by replacing the medium with fresh ones at different extract concentrations
                          (12.5–200 µg/mL) and the treated cells were incubated for 48 h. After incubation, the
                          spent media were carefully removed and 50 µL staining solution (5 mL PBS containing
                          2 µL Hoechst solution (10 mg/mL in DMSO) was added to each well. The samples were
                          incubated again at 37 ◦ C for 15 min. Thereafter, 50 µL PI staining solution was added
                          to each well at a concentration of 2 µg/mL and image was acquired using DAPI (40 ,6-
                          diamidino-2-phenylindole) and Texas Red filters. Melphalan, a well-known cytotoxic drug
                          was used as the positive control. Cytotoxic activity was calculated as:

                                                                  A570 nm of treated cells
                                              % Cell density =                              × 100                  (1)
                                                                 A570 nm of untreated cells

                          2.6. Alpha-Amylase Inhibition
                               The α-amylase inhibition assay was performed using the 3,5-dinitrosalicylic acid
                          (DNSA) method. The plant extract was dissolved in very little quantity of 10% DMSO
                          and was further diluted with buffer solution (pH 6.9) in a 96-wells microtiter plate, to
                          obtain varying concentrations between 50–200 µg/mL. 5 µL of α-amylase solution was
                          added separately to 15 µL of the extracts, phosphate buffer (negative control) and acarbose,
                          after which the mixture was pre-incubated for 30 min at 37 ◦ C. The reaction was initiated
                          by adding 20 µL of the starch solution to each well and the resulting mixture incubated
                          for another 30 min at 37 ◦ C. The reaction was thereafter terminated by the addition of
                          20 µL DNSA reagent and was heated for 10 min in a water bath at 90 ◦ C. The mixture was
                          cooled to room temperature and the absorbance was measured at 540 nm. The α-amylase
                          inhibitory activity expressed as percentage inhibition was calculated as:

                                                                     Abs control − AbsSample
                                                    % Inhibition =                           × 100                 (2)
                                                                           Abs control

                          2.7. Alpha-Glucosidase Inhibition
                               The α-glucosidase inhibition assay was determined as described [28]. Briefly, 5 µL of
                          the extracts (30 60, 120, 240 and 480 µg/mL), 20 µL of 50 µg/mL α-glucosidase solution
                          and 60 µL of 67 mM potassium phosphate buffer (pH 6.8) were reacted together in a 96-well
                          plate. After 5 min of incubation, 10 µL of 10 mM p-nitro phenyl-α-D-glucoside solution
                          (PNPGLUC) was added and then further incubated at 37 ◦ C for 20 min. Thereafter, 25 µL
                          of 100 mM Na2 CO3 solution was added to the mixture and the absorbance was measured
                          at 405 nm. Acarbose (10 µg/mL) was prepared in separate wells and used as the positive
                          control. The % inhibition was calculated as:
                                                                     Abs control − AbsSample
                                                    % Inhibition =                           × 100                 (3)
                                                                          Abs control

                          2.8. Pancreatic Lipase Inhibition
                              In vitro pancreatic lipase inhibitory assay was performed as described [29,30] with
                          some modifications. Briefly, 20 µL of extracts and orlistat (1 mg/mL stock solution in 10%
                          DMSO) at varying concentrations (30, 60, 120, 240 and 480 µg/mL) was reacted with 100 µL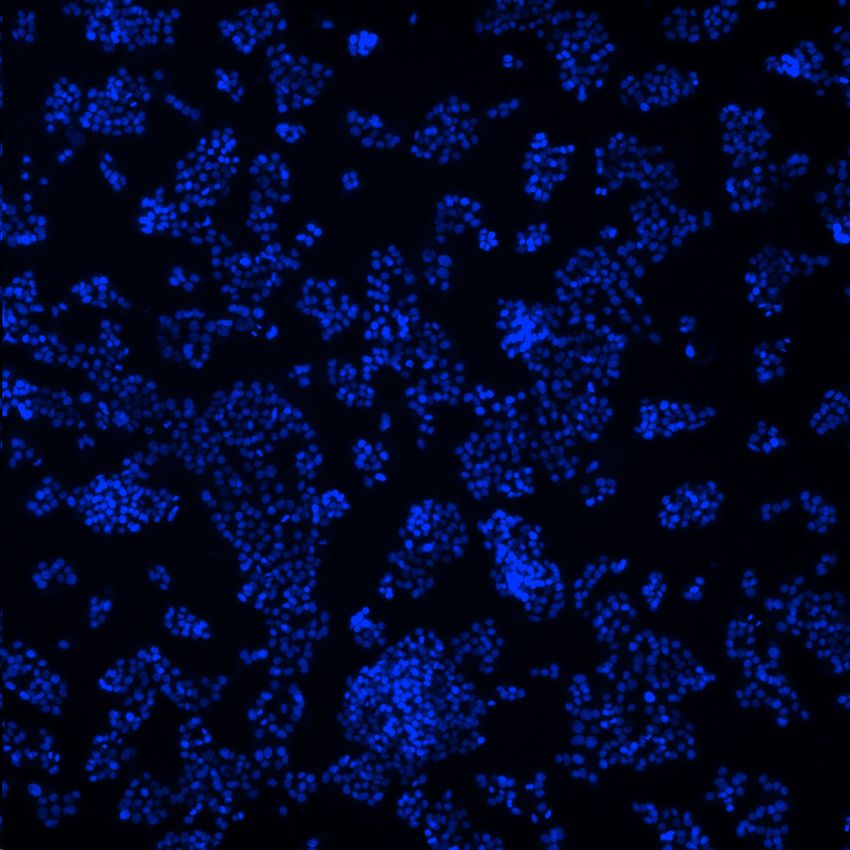
Processes 2021, 9, 1671                                                                                             4 of 17

                          of freshly prepared lipase enzyme solution (1 mg/mL). The resulting mixtures were made
                          up to 1 mL by adding Tri-HCl solution (pH 7.4) and then incubated at 25 ◦ C for 15 min.
                          After incubation, 100 µL of the substrate solution (20.9 mg of PNPB in 2 mL of acetonitrile)
                          was added. The mixture was incubated again for 30 min at 37 ◦ C and the absorbance was
                          measured at 405 nm. Orlistat was used as the positive control and controls without orlistat
                          and without the substrate (PNPB) were separately prepared. The percentage inhibition
                          was calculated as:
                                                                   Abs control − AbsSample
                                                  % Inhibition =                           × 100                       (4)
                                                                         Abs control

                          2.9. Lipid Accumulation Assay
                                Lipid accumulation in C3A cells was determined as previously described by [31].
                          The C3A cells were seeded in 96-well plates at a density of 6000 cells per well in DMEM
                          containing 10% Fetal Bovine serum and allowed to attach overnight. The cells were
                          afterwards treated with different extract concentrations (12.5, 25, 50, 100 and 200 µg/mL)
                          or positive control (Chloroquine) and 1000X LipidTox Green phospholipidosis detection
                          reagent (diluted 1:500 in 5 mL complete growth medium), filtered using a 0.2 µm syringe
                          filter before addition to wells, containing treatment. The treated cells were thereafter
                          incubated for two days. The spent media was removed, washed with 200 µL PBS per well
                          and fixed overnight in 4% formaldehyde. Fifty microliters of staining solution (prepared as
                          10 mL of PBS plus 10 µL LipidTox Red and 2 µL Hoechst) was added to each well and the
                          mixture was incubated at room temperature for 30min. Image acquisition was then done
                          using DAPI and Texas Red filters.

                          2.10. Glucose Utilization
                               Glucose utilization on L6 myoblasts cells was determined as previously described [32],
                          with slight modifications. The cells were grown in DMEM supplemented with 10% FCS
                          and sub-cultured by trypsinization. The L6 cells were further seeded into 96-well culture
                          plates at a density of 5000 cells per well and allowed until 80% confluence of the medium
                          was attained and at least one row was left empty without cells (blanks). The cells were
                          incubated for 5 days to allow sufficient time for full differentiation and thereafter, the spent
                          medium was removed from the differentiated cells and replaced with 200 µL per well of
                          fresh medium at varying concentrations (12.5, 25, 50, 100 and 200 µg/mL). A row of the
                          wells was treated with insulin (12 µM) which served as the positive control. Treatment
                          was continued for two days and the cells were washed once with 50 µL of incubation
                          buffer solution containing RPMI medium diluted with PBS and supplemented with BSA
                          and 8 mM glucose to a final concentration of 0.1%. The plates were thereafter incubated
                          for 2 h at 37 ◦ C. After incubation, 5 µL of the culture medium was transferred to a new
                          96-well plate and to the wells; 200 µL glucose assay reagent (glucose oxidase/peroxidase
                          colorimetric reagent) was added and incubated a 37 ◦ C for 10–20 min and absorbance
                          was measured at 510 nm. Glucose utilization was calculated as the difference between the
                          wells with no cells and the wells containing cells and the amount of glucose utilized was
                          expressed as a percentage of the untreated controls. Cell viability was then determined as
                          100 µL MTT solution (0.5 mg/mL in DMEM) was added to each well and further incubated
                          at 37 ◦ C for 1 h. Thereafter, the MTT solution was removed, 200 µL DMSO added, and
                          the wells were again incubated at room temperature for 20 min. Absorbance was then
                          measured at 540 nm and the cytotoxicity expressed as a percentage of the untreated control.

                          2.11. Data Analysis
                               The experiments were performed in triplicates and data were expressed as
                          mean ± standard deviation (SD) values using one way analysis of variance (ANOVA)
                          and Fischer’s Least Significant Difference in MINITAB 17 statistical package. Values were
                          regarded as significantly different when p < 0.05.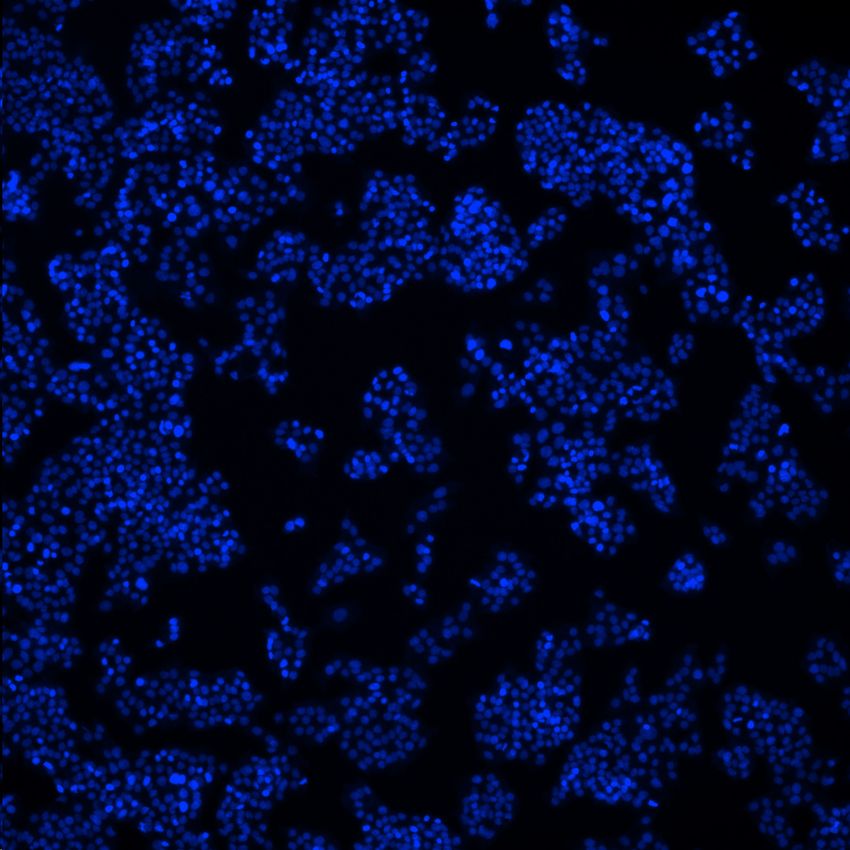
2.11. Data Analysis
The experiments were performed in triplicates and data were expressed as mean ±
Processes 2021, 9, 1671
standard deviation (SD) values using one way analysis of variance (ANOVA) 5and of 17
Fischer’s Least Significant Difference in MINITAB 17 statistical package. Values were
regarded as significantly different when p < 0.05.
3. Results
3. Results
3.1.
3.1. Cytotoxicity
Cytotoxicity
The
The cytotoxic
cytotoxic effect
effectofofeach
eachsample
sampleand andstandard,
standard, asaswell
wellas as
thethe
well-known
well-known cytotoxic
cyto-
drug (melphalan), is presented in Figures 1 and 2. The effect of the extracts
toxic drug (melphalan), is presented in Figures 1 and 2. The effect of the extracts on C3A on C3A cells sug-
gests increased toxicity with increased concentration. The three extracts
cells suggests increased toxicity with increased concentration. The three extracts showed showed a decline
in cell density
a decline at higher
in cell densityconcentrations with the aqueous
at higher concentrations with the and ethanoland
aqueous extracts indicating
ethanol extractsa
very sharp drop
indicating a veryin sharp
cell density
drop atin the
cellmaximum
density atconcentration
the maximum tested (200 µg/mL)
concentration whereas,
tested (200
the blanched
µg/mL) extracts
whereas, theshowed
blanched a sharp decline
extracts in cell
showed densitydecline
a sharp from asinlowcellasdensity
100 µg/mL
from andas
melphalan
low as 100 on the other
µg/mL and hand showed
melphalan on normal
the otherdose
handdependent
showed simultaneous increase in
normal dose dependent
dead cells and increase
simultaneous at the maximum concentration
in dead cells and at the(200 all the extracts
µg/mL),concentration
maximum exhibited
(200 µg/mL),moreall
than 50% cell death. The Lethal Concentration
the extracts exhibited more than 50% cell death. The Lethal 50 (LC 50 ) were 154.75 µg/mL, 125 µg/mL
Concentration 50 (LC50) were
and 90.58
154.75 µg/mL
µg/mL, 125for ethanol,
µg/mL andaqueous
90.58 µg/mLand blanched extracts
for ethanol, aqueousrespectively, indicating
and blanched the
extracts
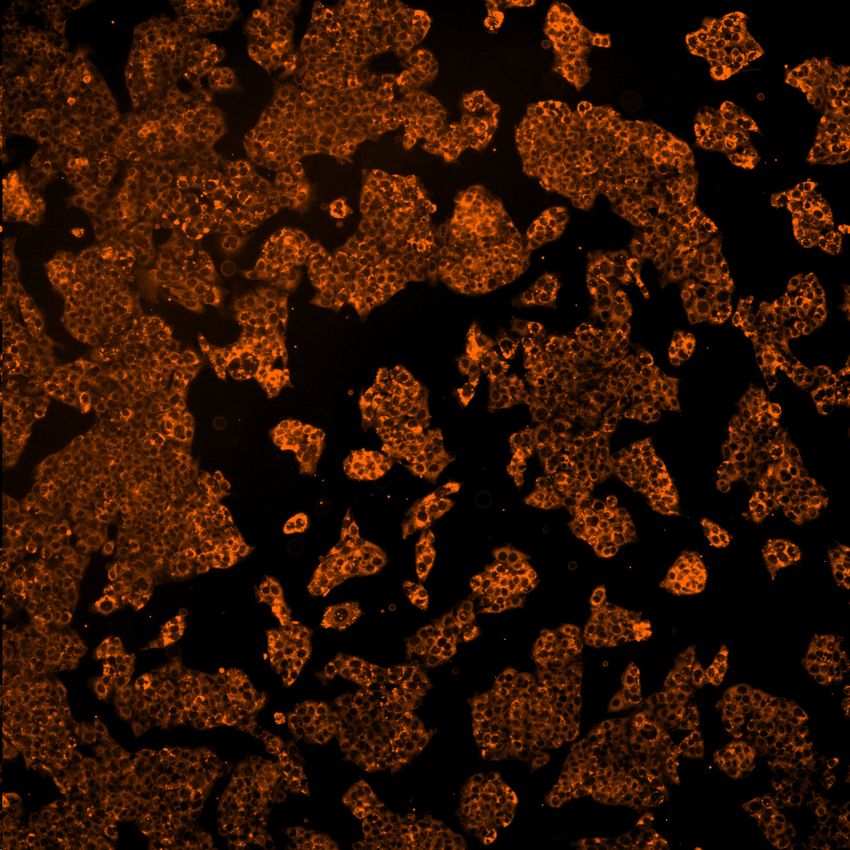
blanched extract to be the most toxic. The corresponding images of
respectively, indicating the blanched extract to be the most toxic. The correspondingthe cells obtained from
Hoechst
images of 33,342 staining
the cells are presented
obtained from Hoechst in Figure
33,3423.staining are presented in Figure 3.
120
Cell density (% of control)
120 a a
a a a a b c 100 a a
100
b
80
80
Total cells (%)
60 60
40 40
20
20 c
0
0
-20 0 12.5 25 50 100 200
Live cells (%)
Dead cells (%) Aqueous extract (μg/mL)
(a) (b)
120 120
a b d
Cell density (% of control)
100 b c d a
100 a a
80 b
Total cells (%)
80
60
60
40
40
20
0 20 c
-20 0
0 12.5 25 50 100 200
Live cells (%) Blanched extract (μg/mL)
Dead cells (%)
(c) (d)
Figure 1. Cytotoxicity screening of aqueous and blanched extracts of H. arborescens leaves. (a) Total number of C3A cells
after treatment with aqueous extract. (b) Cell density after treatment with aqueous extract. (c) Total number of C3A cells
after treatment with blanched extract. (d) Cell density after treatment with blanched extract. Dead cells were represented as
cells with compromised membrane integrity and subsequent propidium iodide (PI) staining and Live cells obtained from
Hoechst 33,342 staining. Values are expressed as mean ± SD (n = 2). Mean separation by SD (p < 0.05). Set of bars with
different alphabets are significantly different.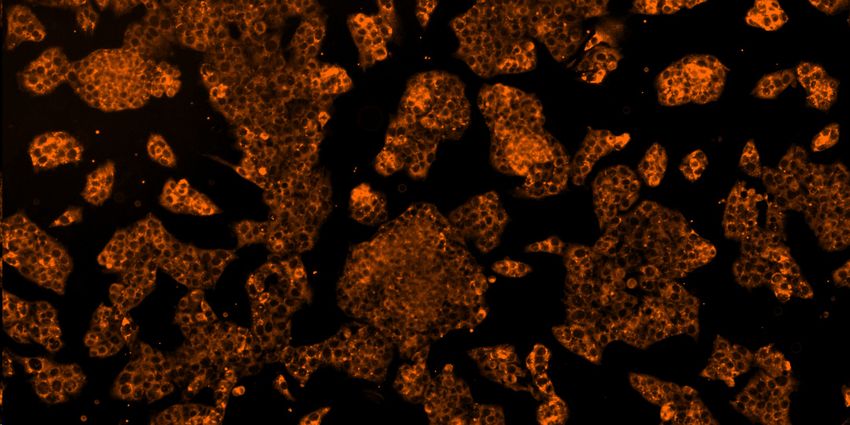
Figure 1. Cytotoxicity screening of aqueous and blanched extracts of H. arborescens leaves. (a) Total number of C3A cells
after treatment with aqueous extract. (b) Cell density after treatment with aqueous extract. (c) Total number of C3A cells
after treatment with blanched extract. (d) Cell density after treatment with blanched extract. Dead cells were represented
as 2021,
Processes cells 9,with
1671compromised membrane integrity and subsequent propidium iodide (PI) staining and Live cells obtained6 of 17
from Hoechst 33,342 staining. Values are expressed as mean ± SD (n = 2). Mean separation by SD (p < 0.05). Set of bars
with different alphabets are significantly different.
120 120
a a b b c d a
Cell density (% of control)
100 a b b
100
c
Total cells (%)
80
80
60
60
40
20 40
0 20
c
0
0 12.5 25 50 100 200
Live cells (%)
Dead cells (%) Ethanol (μg/mL)
(a) (b)
120 a 120
b b c Cell density (% of a
100 100
Total cells (%)
80 80
control)
60 60
b b
40 40
c
20 20
0 0
0 6.25 12.5 25
[Melphalan] (μM)
Live cells (%)
Dead cells (%)
(c) (d)
Figure 2.
Figure 2. Cytotoxicity
Cytotoxicity screening
screening ofof ethanol
ethanol extract
extract of
of H.
H. arborescens
arborescens leaves
leaves and
and melphalan
melphalan (positive
(positive control).
control). (a).
(a). Total
Total
number of C3A cells after treatment with ethanol extract. (b) Cell density after treatment with ethanol extract.
number of C3A cells after treatment with ethanol extract. (b) Cell density after treatment with ethanol extract. (c) Total (c) Total
number of C3A cells after treatment with Melphalan. (d) Cell density after treatment with Melphalan. Dead cells were
number of C3A cells after treatment with Melphalan. (d) Cell density after treatment with Melphalan. Dead cells were
represented as cells with compromised membrane integrity and subsequent propidium iodide (PI) staining and Live cells
represented as cells with compromised membrane integrity and subsequent propidium iodide (PI) staining and Live cells
obtained from Hoechst 33,342 staining. Values are expressed as mean ± SD (n = 2). Mean separation by SD (p < 0.05). Set of
obtained
bars withfrom Hoechst
different 33,342 are
alphabets staining. Values are
significantly expressed as mean ± SD (n = 2). Mean separation by SD (p < 0.05). Set of
different.
bars with different alphabets are significantly different.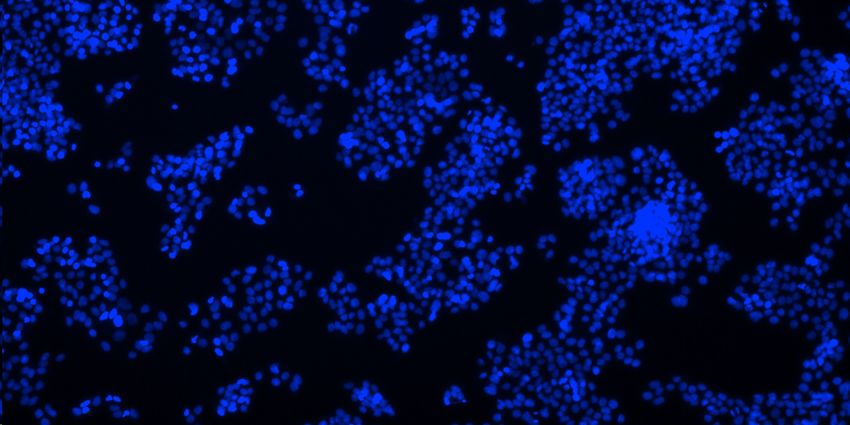
Processes 2021, 9, 1671                                                                                                              7 of 17
es 2021, 9, x FOR PEER REVIEW                                                                                                  7 of 17

                                                                     A                                          B

                                       Control

                                      Melphalan

                                       Ethanol

                                      Blanched

                                      Aqueous

                               Figureof3.C3A
                  Figure 3. Images         Images
                                              cellsof C3A
                                                    after 48cells after 48 with
                                                             h treatment   h treatment with each
                                                                                100 µg/mL   100 µg/mL    eachblanched
                                                                                                 of ethanol,  of ethanol, blanched
                                                                                                                        and aqueousand
                                                                                                                                    extracts of H.
                               aqueous
                  arborescens leaves      extracts
                                     obtained      of H.
                                                from      arborescens
                                                      Hoechst   33,342leaves  obtained
                                                                        staining.      from
                                                                                  Column     Hoechst
                                                                                          (A)—all      33,342
                                                                                                  nuclei,     staining.
                                                                                                          Column         ColumnofA—all
                                                                                                                   (B)—nuclei    dead cells.
                               nuclei, Column B—nuclei of dead cells.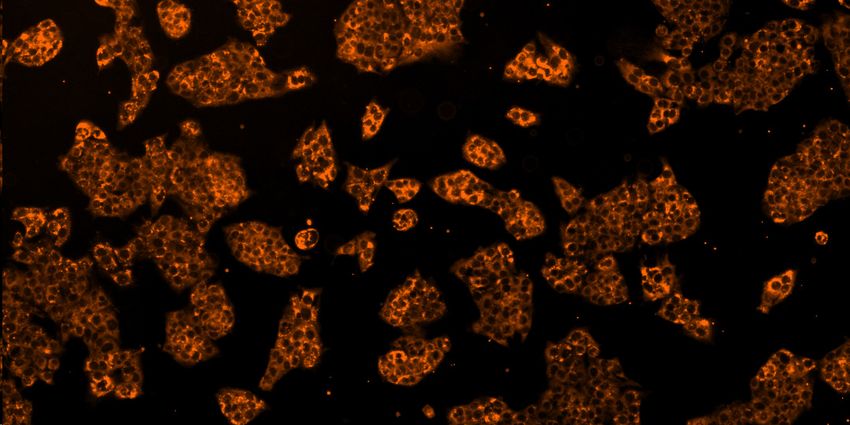
Processes 2021, 9, 1671 8 of 17
Processes 2021, 9, x FOR PEER REVIEW 8 of 17
3.2. Alpha-Amylase
3.2. Alpha-Amylase Inhibition
Inhibition
The α-amylase
The inhibitionofofH.
α-amylase inhibition H.arborescens
arborescensleaf
leafextracts and
extracts acarbose
and (positive
acarbose control)
(positive con-
is presented in Figure 4. The extracts displayed a concentration dependent inhibition
trol) is presented in Figure 4. The extracts displayed a concentration dependent inhibition of
the enzyme, but very weak inhibitory potential at the tested concentrations
of the enzyme, but very weak inhibitory potential at the tested concentrations when when com-
pared to acarbose.
compared Percentage
to acarbose. inhibition
Percentage of α-amylase
inhibition enzyme
of α-amylase rangedranged
enzyme from±40.77
from 40.77 1.26%±
to 85.35 ± 2.18% for acarbose, 2.32 ± 0.45% to 32.46 ± 0.49% for ethanol, 3.04 ± 0.37%
1.26% to 85.35 ± 2.18% for acarbose, 2.32 ± 0.45% to 32.46 ± 0.49% for ethanol, 3.04 ± 0.37%
to 29.46 ± 1.06% for blanched and 7.48 ± 0.27% to 40.33 ± 3.49% for the aqueous ex-
to 29.46 ± 1.06% for blanched and 7.48 ± 0.27% to 40.33 ± 3.49% for the aqueous extract.
tract. The IC50 values (Table 1) were 51.06 ± 1.78, 583.74 ± 5.87, 724.66 ± 4.33 and
The IC50 values (Table 1) were 51.06 ± 1.78, 583.74 ± 5.87, 724.66 ± 4.33 and 791.63 ± 3.76
791.63 ± 3.76 µg/mL for acarbose, aqueous, ethanol and blanched extracts respectively.
µg/mL for acarbose, aqueous, ethanol and blanched extracts respectively.
100
90
Alpha-amylase inhibition (%)
80
c
70 d
60
c Ethanol
50
c b Blanched
40
c b aa Aqueous
30 b a a
Acarbose
20 b
a a a
10 a b
a
0
30 60 120 240 480
-10
Concentration (µg/mL)
Figure 4.
Figure 4. Alpha-amylase
Alpha-amylaseinhibitory
inhibitoryactivity
activityofof
H.H. arborescens
arborescens leafleaf extracts
extracts andand positive
positive control
control (acarbose).
(acarbose). Values
Values are mean
are mean ± SD
± SD (n = 3). Mean separation by SD (p < 0.05). Set of bars (the same concentration) with different alphabets are
(n = 3). Mean separation by SD (p < 0.05). Set of bars (the same concentration) with different alphabets are different.
different.
3.3. Alpha-Glucosidase Inhibitory Assay
Table 1. IC50 values for α-amylase and α-glucosidase inhibition by H. arborescens leaf extracts and
The (µg/mL).
standards α-glucosidase inhibitory potential of H. arborescens leaf extracts and acarbose
(positive control) is indicated in Figure 5. The extracts showed considerable dose de-
pendentExtracts α-Amylase
α-glucosidase inhibition, α-Glucosidase
although weaker Lipase
when compared to acarbose. Per-
centage Ethanol
inhibition of α-glucosidase enzyme ranged
724.66 ± 4.33 from
627.29 44.11 ± 0.19% 699.3
± 4.62 to 82.47 ± 3.26%
± 1.33
for acarbose, 18.43
Blanched ± 0.89% to 40.69 ±
791.63 ± 3.76 1.03% for ethanol extract,
855.38 ± 4.29 9.32 ± 0.06% to 31.72 ±
1152.7 ± 4.61
1.13% for blanched extract and 22.63 ± 1.38% to 43.97 ± 0.38% for the aqueous extract. The
Aqueous 583.74 ± 5.87 576.46 ± 3.21 811.52 ± 3.52
IC50 values (Table 1) were 45.43 ± 2.31, 576.46 ± 3.21, 627.29 ± 4.33 and 855.38 ± 4.29 µg/mL
Acarbose
for acarbose, 51.06
aqueous, ethanol and± 1.78
blanched extracts45.43 ± 2.31
respectively. *
Orlistat * * 56.88 ± 0.11
* Not determined.
3.3. Alpha-Glucosidase Inhibitory Assay
The α-glucosidase inhibitory potential of H. arborescens leaf extracts and acarbose
(positive control) is indicated in Figure 5. The extracts showed considerable dose depen-
dent α-glucosidase inhibition, although weaker when compared to acarbose. Percentage
inhibition of α-glucosidase enzyme ranged from 44.11 ± 0.19% to 82.47 ± 3.26% for acar-
bose, 18.43 ± 0.89% to 40.69 ± 1.03% for ethanol extract, 9.32 ± 0.06% to 31.72 ± 1.13%
for blanched extract and 22.63 ± 1.38% to 43.97 ± 0.38% for the aqueous extract. The IC50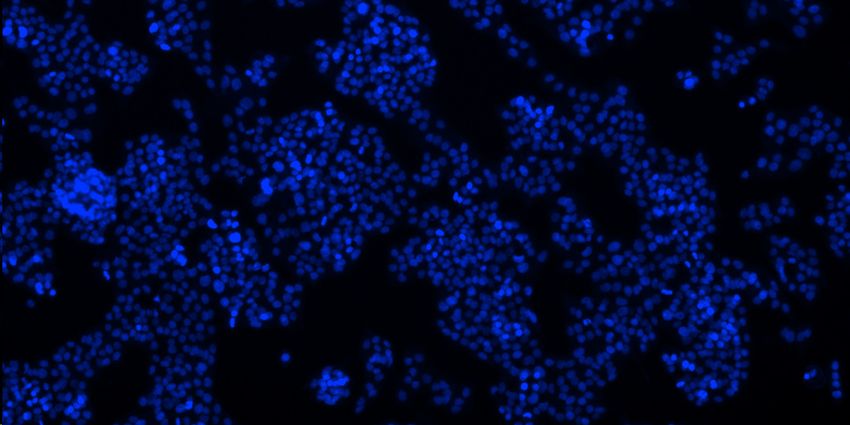
Processes 2021, 9, 1671 9 of 17
values
Processes 2021, 9, x FOR PEER REVIEW (Table 1) were 45.43 ± 2.31, 576.46 ± 3.21, 627.29 ± 4.33 and 855.38 ± 4.29 µg/mL
9 of 17
for acarbose, aqueous, ethanol and blanched extracts respectively.
90 c
Alpha -glucosidase inhibition (%)
80
70 c
d
60
d Ethanol
50 a
d Blanched
a
40 a a
a c b Aqueous
c
30 a b Acarbose
c b
20 a
b
b
10
0
30 60 120 240 480
Concentration (µg/mL)
Figure 5. Alpha-glucosidase
Figure 5. Alpha-glucosidase inhibitory
inhibitory activity
activity of
of H.
H. arborescens
arborescens leaf
leaf extracts
extracts and
and positive
positive control
control (acarbose).
(acarbose). Values
Values are
are
expressed as mean ± SD (n = 3). Mean separation by SD (p < 0.05). Bars at the same concentration with different alphabets
expressed as mean ± SD (n = 3). Mean separation by SD (p < 0.05). Bars at the same concentration with different alphabets
are significantly different.
are significantly different.
3.4. Porcine Pancreatic Lipase
3.4. Porcine Pancreatic Lipase
The inhibitoryeffects
The inhibitory effectsofofthe
the
H. H. arborescens
arborescens leafleaf extracts
extracts againstagainst porcine
porcine pancreatic
pancreatic lipase
lipase
were evaluated in comparison with orlistat (Positive control) and presented in Figurein
were evaluated in comparison with orlistat (Positive control) and presented 6.
Figure
Although 6. Although
percentagepercentage
inhibitioninhibition
ranged fromranged from
46.33 46.33 to
± 0.76% ± 0.76%
82.07 ±to 1.41%
82.07 ±for
1.41% for
orlistat,
orlistat, 12.30 ±to0.85%
12.30 ± 0.85% 35.87 to 35.87 ±for1.39%
± 1.39% for 3.88
ethanol, ethanol, 3.88 to
± 1.37% ± 1.37%
25.65 ±to2.33%
25.65for
± 2.33%
blanchedfor
blanched and 9.57 ± 0.66% to 31.21 ± 1.34% for aqueous extract. Among
and 9.57 ± 0.66% to 31.21 ± 1.34% for aqueous extract. Among the extracts assessed, the extracts as-
sessed,
ethanolethanol
extractextract
showed showed
the mostthe most
activeactive
lipaselipase inhibitory
inhibitory activities
activities withwith
IC50ICvalues
50 values
of
of 699.3 ± 1.33 µg/mL, followed by aqueous extract (811.52 ± 3.52 µg/mL)
699.3 ± 1.33 µg/mL, followed by aqueous extract (811.52 ± 3.52 µg/mL) and blanched and blanched
extract
extract (1152.7
(1152.7 ±± 4.61
4.61 µg/mL).
µg/mL).However,
However, orlistat
orlistat indicated
indicated ICIC50
50 value of 56.8 ± 0.11 µg/mL.
value of 56.8 ± 0.11 µg/mL.
90 3.5. Glucose Utilization in C3A Hepatocytes
Pancreatic lipase inhibition (%)
Glucose utilization and corresponding cytotoxicity in C3Ad hepatocytes are presented
80
in Figure 7. All the samples showed weak glucosed utilization in C3A hepatocytes compared
70 with metformin treated cells which
d showed the highest glucose uptake. At 50 µg/mL, only
the blanched extract showed a very sharp drop in glucose uptake. Whereas, at the highest
60 concentration tested
d (100 µg/mL), very weak or no glucose utilization was observed for all
50 the three extracts. The results have also shown that higher concentrations
Ethanol of the extracts
c
drastically reduced the viability of the cells, with the greatest reduction observed in the
40 blanched extract. a Blanched
a c
a c Aqueous
30 c b Orlistat
a c
20 b
a a b
b
10
b
0
30 60 120 240 480
Concentration (µg/mL)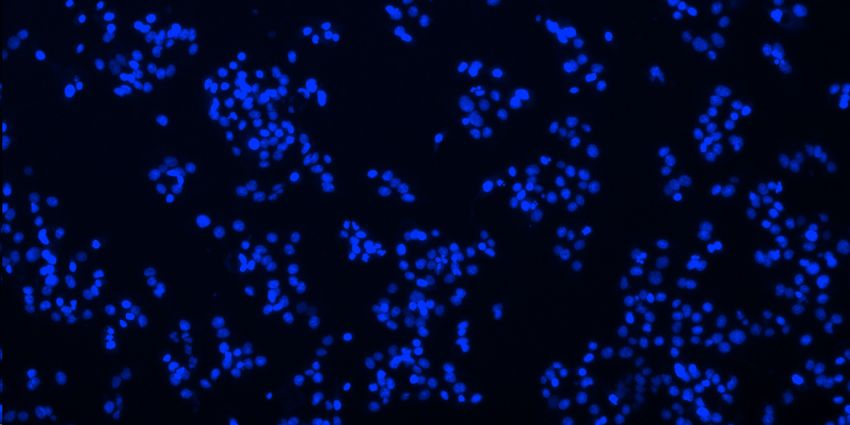
lipase were evaluated in comparison with orlistat (Positive control) and presented in
Figure 6. Although percentage inhibition ranged from 46.33 ± 0.76% to 82.07 ± 1.41% for
orlistat, 12.30 ± 0.85% to 35.87 ± 1.39% for ethanol, 3.88 ± 1.37% to 25.65 ± 2.33% for
blanched and 9.57 ± 0.66% to 31.21 ± 1.34% for aqueous extract. Among the extracts as-
Processes 2021, 9, 1671 sessed, ethanol extract showed the most active lipase inhibitory activities with IC50 values
10 of 17
Processes 2021, 9, x FOR PEER REVIEW 10 of 17
of 699.3 ± 1.33 µg/mL, followed by aqueous extract (811.52 ± 3.52 µg/mL) and blanched
extract (1152.7 ± 4.61 µg/mL). However, orlistat indicated IC50 value of 56.8 ± 0.11 µg/mL.
Figure 6. Pancreatic lipase inhibitory activity of H. arborescens leaf extracts and positive control (orlistat). Values are ex-
90 ± SD (n = 3). Mean separation by SD (p < 0.05). Set of bars (the same concentration) with different al-
pressed as mean Pancreatic lipase inhibition (%)
phabets are different. d
80
d
Table 1. IC50 values for α-amylase and α-glucosidase inhibition by H. arborescens leaf extracts and
70 d
standards (µg/mL).
60 Extracts d α-Amylase α-Glucosidase Lipase
50 c Ethanol 724.66 ± 4.33 627.29 ± 4.62 699.3 ± 1.33
Ethanol
Blanched 791.63 ± 3.76 855.38 ± 4.29 1152.7 ± 4.61
40 a Blanched
Aqueous 583.74 ± 5.87a 576.46 ± 3.21
c 811.52 ± 3.52
Acarbose a 51.06 ± 1.78
c 45.43 ± 2.31 Aqueous *
30 c
Orlistat
a * *b 56.88 ± 0.11
Orlistat
20 c b
* Not determined.
a a b
b
10
b 3.5. Glucose Utilization in C3A Hepatocytes
0 Glucose utilization and corresponding cytotoxicity in C3A hepatocytes are pre-
30sented in Figure
60 7. All the 120
samples showed
240weak glucose
480utilization in C3A hepatocytes
compared with metformin treated cells which showed the highest glucose uptake. At 50
µg/mL, only Concentration
the blanched extract(µg/mL)
showed a very sharp drop in glucose uptake. Whereas,
at the highest concentration tested (100 µg/mL), very weak or no glucose utilization was
Figure 6. Pancreatic lipase inhibitory
observed activity
for all the H. arborescens
of three extracts. leaf
The extracts and also
results have positive
showncontrol (orlistat).
that higher Values are
concentrations
expressed as mean ± SD (n =of 3).the
Mean separation
extracts by SDreduced
drastically (p < 0.05).
theSet of barsof(the
viability thesame
cells,concentration) with reduction
with the greatest different
alphabets are different. observed in the blanched extract.
250 250
e 250 d
Glucose utilisation
d
200
Glucose utilisation
200
(% of control)
Glucose utilisation
200
(% of control)
b
(% of control)
150 b 150 a
a a b
c 150
100 a
a 100
100
50 d
50
0 50 c
0 25 50 100 Met c
0
1mM 0
0 25 50
100 Met
0 25 50 100 Met 1mM
[HB1] (μg/mL) [HE1] (μg/mL) 1mM [HD1] (μg/mL)
a a
a a a a a a a a
a 100
100 100
(% of control)
(% of control)
(% of control)
Cell viability
Cell viability
Cell viability
75
75 75
b 50 b
50 c 50 b
25
25 25
0
0 0
0 25 50 100 Met 0 25 50 100 Met
1mM 1mM
[HB1] (μg/mL) [HE1] (μg/mL) [HD1] (μg/mL)
Figure 7. Effects
Figure of H.
7. Effects of arborescens leaf
H. arborescens leafextracts
extractson
onglucose
glucose utilization inC3A
utilization in C3Acells
cellsand
andtheir
their corresponding
corresponding effects
effects on the
on the
C3AC3A
cell cell viability
viability (MTT(MTT cytotoxicity)compared
cytotoxicity) comparedto tothe
the untreated
untreated cells.
cells. (Data
(Dataare
areexpressed
expressedas as
%% of of
control ± SD,
± SD,
control n = 3).
n = 3).
HB—Blanched; HE—Ethanol and HD—Aqueous extracts; Met—Metformin. Mean separation by SD (p < 0.05). Set of bars
with different alphabets are significantly different.Processes 2021, 9, x FOR PEER REVIEW 11 of 17
Processes 2021, 9, 1671 11 of 17
HB—Blanched; HE—Ethanol and HD—Aqueous extracts; Met—Metformin. Mean separation by SD (p < 0.05). Set of bars
with different alphabets are significantly different.
3.6. Lipid Accumulation
3.6. Lipid Accumulation
Lipid accumulation effect of H. arborescens leaf extracts on C3A cells compared with
Lipid accumulation effect of H. arborescens leaf extracts on C3A cells compared with
the control is depicted in Figure 8. A great increase in the levels of neutral lipids and
the control is depicted in Figure 8. A great increase in the levels of neutral lipids and
phospholipids was obvious for the blanched extract (75.95% at 50 µg/mL and 45.45% at
phospholipids was obvious for the blanched extract (75.95% at 50 µg/mL and 45.45% at
100
100 µg/mL respectively). However,
µg/mL respectively). However, for
for the
the ethanol
ethanol extract,
extract, aa great
great increase
increase inin neutral
neutral li-
lipid
accumulation
pid accumulation (63.11%) was only observed at the highest concentration (100 µg/mL).On
(63.11%) was only observed at the highest concentration (100 µg/mL).
the
Onother hand,hand,
the other a relatively weaker,
a relatively but statistically
weaker, significant
but statistically (p > 0.05),
significant increase
(p > 0.05), in neutral
increase in
lipids
neutral(18.07%) and phospholipids
lipids (18.07%) (22.02%)(22.02%)
and phospholipids at 50 µg/mL was observed
at 50 µg/mL in the in
was observed aqueous
the
extract.
aqueous The corresponding
extract. images ofimages
The corresponding the C3A cells
of the treated
C3A cells with leaf
treated extracts
with are indicated
leaf extracts are
inindicated
Figure 9.in Figure 9.
100 100 100
% Lipid Tox Red positive cells
% Lipid Tox Red positive cells
% Lipid Tox Red positive cells
90 c 90 90
80 d 80 c 80
e 70 b d
70 70
60 60
60
50
50 50
40 c
40 30 40
30 b
20 a 30
b a a b
20 10 20
a a
10 0 10
0 0
0 25 50 100 Chl
12µM
[HB1] (μg/mL) [HE1] (μg/mL)
[HD1] (μg/mL)
100 100
100
% Lipid Tox Green positive
% Lipid Tox Green positive
90
% Lipid Tox Green positive
90
80 80 80
70 d 70
60 60
60 b
50 40
cells
cells
b
cells
40 50 b
c a
30 b b 40 20 a
20 a 30 0
10 20 b b
0 a a
10
0 25 50 100 Chl
0
12µM
0 25 50 100 Chl
[HB1] (μg/mL) [HD1] (μg/mL)
[HE1] (μg/mL 12µM
Figure
Figure 8. 8.Neutral
Neutrallipid
lipid (LipidTox
(LipidTox Red)
Red)andandphospholipid
phospholipid (LipidTox Green)
(LipidTox accumulation
Green) in C3A
accumulation incells
C3Atreated with indi-
cells treated with
cated extracts and chloroquine (positive control) for 48 h. HB—Blanched; HE—Ethanol and HD—Aqueous
indicated extracts and chloroquine (positive control) for 48 h. HB—Blanched; HE—Ethanol and HD—Aqueous extracts; extracts; Chl.–
Chloroquine; Data is expressed as a percentage of cells staining positive for each treatment. Mean separation by SD (p <
Chl.–Chloroquine; Data is expressed as a percentage of cells staining positive for each treatment. Mean separation by SD
0.05). Set of bars with different alphabets are significantly different. The corresponding images of the C3A cells treated
(pProcesses 2021, 9, 1671 12 of 17
Processes 2021, 9, x FOR PEER REVIEW 12 of 17
A B C
Control
Chl.
Blanched
Ethanol
Aqueous
Figure
Figure9.9.Images
ImagesofofC3A
C3Acells
cellsafter
after4848h h
treatment
treatmentwith 100
with µg/mL
100 each
µg/mL of ethanol,
each blanched
of ethanol, andand
blanched aqueous extracts
aqueous of H.
extracts of
arborescens leaves obtained from Hoechst 33,342 staining. Column A—All nuclei, Column B—LipidTox Red (neutral
H. arborescens leaves obtained from Hoechst 33,342 staining. Column (A)—All nuclei, Column (B)—LipidTox Red (neutral li-
pids), Column C—LipidTox Green (phospholipids).
lipids), Column (C)—LipidTox Green (phospholipids).
3.7.
3.7.Glucose
GlucoseUtilization
UtilizationininL6
L6Myocytes
Myocytes
The
The effect of H. arborescensleaf
effect of H. arborescens leafextracts
extractsononglucose
glucoseutilization
utilizationin inL6
L6myocytes,
myocytes,andanditsits
resultant
resultant cytotoxicity are revealed in Figure 10. Data was expressed as a percentageof
cytotoxicity are revealed in Figure 10. Data was expressed as a percentage ofthe
the
untreated
untreatedcontrol,
control,and
andinsulin
insulinwas
wasused
usedasasthe
thepositive
positivecontrol.
control.While
Whilethe theinsulin
insulintreated
treated
cells
cellsshowed
showed significantly higherglucose
significantly higher glucoseutilization
utilizationthan
thanthethe extracts,
extracts, a slight
a slight increase
increase was
was observed only at 50 and 100 µg/mL for aqueous and ethanol extracts,
observed only at 50 and 100 µg/mL for aqueous and ethanol extracts, with no significant with no sig-
nificant
increaseincrease
for the for the blanched
blanched extract.extract.
However,However,
for the for the aqueous
aqueous extract extract there
there was was a
a decline
decline in glucose utilization from 154.89% at 50 µg/mL to 124.39% at
in glucose utilization from 154.89% at 50 µg/mL to 124.39% at 100 µg/mL; while for100 µg/mL; while
theProcesses 2021, 9, 1671 13 of 17
Processes 2021, 9, x FOR PEER REVIEW 13 of 17
ethanol extract treated
for the ethanol extract cells, glucose
treated cells, utilization only increased
glucose utilization from 95.11%
only increased fromat95.11%
25 µg/mL
at 25to
107.82% at 50 µg/mL with no further increase at 100 µg/mL. Furthermore,
µg/mL to 107.82% at 50 µg/mL with no further increase at 100 µg/mL. Furthermore, thethe cytotoxicity
of the extractsofon
cytotoxicity L6extracts
the cells measured andmeasured
on L6 cells expressedand
in comparison with
expressed in the control,
comparison showed
with the
significant levels of toxicity at high concentrations.
control, showed significant levels of toxicity at high concentrations.
350 350 d
c 300 300
350
Glucose utilisation
Glucose utilisation
300 250 250
(% of control)
(% of control)
Glucose utilisation
(% of control)
250 200 a 200
a b
200 150
a
150 c
150 a a a
a a a b 100 100
100
50 50
50
0 0
0
0 25 50 100 Ins 0 25 50 100 Ins
0 25 50 100 Ins
[HB] (μg/mL) [HE] (μg/mL) [HD] (μg/mL)
a a a a a
100 100 b 100
b
(% of control)
c
Cell viability
c
(% of control)
(% of control)
b
Cell viability
Cell viability
d
75 75 75 c
d
50 d 50 50
25 25 25
0 0 0
0 25 50 100 Ins 0 25 50 100 Ins 0 25 50 100 Ins
[HB] (μg/mL) [HE] (μg/mL) [HD] (μg/mL)
Figure10.
Figure 10.Effects
Effects of
of H.
H. arborescens
arborescens leaf
leaf extracts
extractson
onglucose
glucoseutilization
utilization inin
L6L6
cells and
cells their
and corresponding
their corresponding effects on the
effects on L6
the
cell
L6 viability
cell (MTT
viability (MTT cytotoxicity) compared
cytotoxicity) compared to to
the
theuntreated
untreatedcells.
cells.(Data areare
(Data expressed
expressed asas%%ofofcontrol
control± ±SD,SD,n n= =3).3).
HB—Blanched;HE—Ethanol
HB—Blanched; HE—Ethanoland andHD—Aqueous
HD—Aqueous extracts;
extracts; Met—Metformin.
Met—Metformin. Mean Mean separation
separation byby SD
SD (p
(pProcesses 2021, 9, 1671 14 of 17
proliferation and hence the absence of meaningful PI staining at lower concentrations. The
cytotoxicity of the extracts also further explains the reason for the low glucose utilization
observed for the extracts.
A-glucosidase and α-amylase are key enzymes for intestinal carbohydrate digestion
and the inhibition of these enzymes have been recognized as one of the therapeutic ap-
proaches for the regulation of postprandial hyperglycemia; an initial metabolic defect that
occurs in the onset of diabetes mellitus [35–38]. Our previous studies by GC-MS analysis
have documented the presence of α-pinene, β-pinene, β-ocimene and D-limonene in H.
arborescens leaves [39] and these components have been established to show some hypo-
glycemic activities [40,41]. Phenolic compounds such as phenols, terpenoids and flavonoids
are possible natural sources of α-glucosidase inhibitors which have been reported to repress
glucose release from the liver as well as enhance hepatic glucose uptake [30,42]. Our previ-
ous work has established the phenolic constituents of H. arborescens leaves [43] and based
on previous reports, the α-glucosidase inhibitory activity of the three extracts observed in
the present study could be attributed to the presence of polyphenolic compounds [44,45].
The high inhibition of α-amylase enzyme by acarbose is linked to several unpleasant side
effects such as abdominal disturbances, flatulence and diarrhea [46]. Therefore, the weak
α-amylase activity with corresponding stronger inhibition against α-glucosidase observed
for the H. arborescens leaf extracts is advantageous [47–49] and agrees with previous reports
which proposed that phytochemicals are stronger inhibitors of α-glucosidase compared
to α-amylase [44,50]. Moderate α-glucosidase inhibitory potential obtained in the present
study is comparable with previous results on hexane, ethyl acetate and methanol extracts
of H. arborescens leaf and bark [51] as well as in some other members of the Apiaceae family
such as C. Asiatica [52], A. graveolens [53], P. Anisum [48,54,55] and C. cyminum [56,57].
One mechanism through which phenolic compounds control glucose metabolism is
to stimulate the muscle and fat cells to enhance their glucose utilization activities [58].
However, this study did not indicate a direct relationship between phenolic compounds
and glucose utilization in L6 cells, as this was relatively weak for all the extracts especially
the blanched extract, even though the extracts showed high phenolic compounds, with
ethanol having the highest phenolic compounds. Arguably, the slight increase observed for
ethanol extract at a concentration of 50 µg/mL might be attributed to the presence of higher
hypoglycemic phenolic compounds [59] compared to the aqueous and blanched extract.
Similarly, in C3A cells, glucose utilization declined at higher concentrations especially for
the blanched extract and this could be because it proved to be the most toxic among the
extracts assessed.
Excessive weight gain is a major risk factor for diabetes mellitus and lipid accumula-
tion is used as a tool to check the level of adipogenesis in 3T3-L1 cells [60]. A reduction in
lipid accumulation and inhibition of pancreatic lipase; an enzyme responsible for digestion
of dietary fat, delaying fat deposition into adipose tissue, play a crucial role in reducing
weight gain and obesity [61]. In this study, although lipase inhibition was quite low com-
pared with orlistat (positive control), the lipase inhibitory activity obtained suggests that
H. arborescens leaves may be a promising tool in managing excess weight and obesity. On
the other hand, the results obtained for lipid accumulation in C3A cells with the use of
Hoechst 33342/PI staining has shown that the three extracts do not significantly reduce
lipid accumulation in C3A cells. These results suggest that the mechanism of action of H.
arborescens leaves extracts may not be through reducing lipid accumulation.
5. Conclusions
This study presented new findings and established the pharmacological potential of
H. arborescens leaves in controlling of diabetes and obesity. The cytotoxic activities as well
as glucose utilization in L6 cell lines were evaluated. The results suggest a reasonable
toxicity profile for the aqueous and ethanol extracts with limited risk for hepatotoxicity at
physiologically relevant concentrations. Although relatively weak glucose utilization was
obtained for the plant extracts, when compared to metformin, significant inhibition againstProcesses 2021, 9, 1671 15 of 17
α-amylase and α-glucosidase enzymes was observed for the ethanol and aqueous extracts.
Our results have shown that both extracts may possibly exert their anti-diabetic properties
by stimulating the inhibition of the carbohydrate digestive enzymes may therefore be
promising for the management of diabetes mellitus. In addition, the extracts indicated
considerable lipase inhibitory potential but no reasonable reduction in lipid accumulation
in C3A cell lines.
Presumably, there is little or no study to justify the traditional use of H. arborescens
leaves in the management of diabetes and obesity. Very importantly, precautions should be
taken in the use of H. arborescens leaves at high concentrations to ensure safety and efficacy.
Author Contributions: T.O.A. and G.A.O. designed the experiments, performed the experiments,
analyzed data, and wrote the draft. G.A.O. and A.J.A. supervised the study, coordinated, and revised
the manuscript. All authors have read and agreed to the published version of the manuscript.
Funding: This research was funded by the Govan Mbeki Research Development Centre (GMRDC),
University of Fort Hare, South Africa (grant number C127) and supported by the South Africa
National Research Foundation: Research and Innovation Support and Advancement (NRF: RISA)
CSURG: Grant No: 121264.
Institutional Review Board Statement: The study was conducted according to the guidelines of the
Declaration of Helsinki, and approved by the Ethics Committee, University of Fort Hare Animal and
Plant Use Research Ethics Committee, South Africa with protocol number OTA011SABI01/19/E.
Data Availability Statement: The data that support the findings of this study are available in this article.
Acknowledgments: Govan Mbeki Research Development Centre (GMRDC), University of Fort Hare,
South Africa and National Research Foundation: Research and Innovation Support and Advancement
(NRF: RISA) CSURG.
Conflicts of Interest: The authors declared no conflict of interest with respect to the research,
authorship, and/or publication of this article.
References
1. Qaisar, M.N.; Chaudhary, B.A.; Sajid, M.U.; Hussain, N. Evaluation of α-glucosidase inhibitory activity of dichloromethane and
methanol extracts of Croton bonplandianum Baill. Trop. J. Pharm. Res. 2014, 10, 1833–1836. [CrossRef]
2. Unuofin, J.O.; Lebelo, S.L. Antioxidant effects and mechanisms of medicinal plants and their bioactive compounds for the
prevention and treatment of Type 2 Diabetes: An Updated Review. Oxid. Med. Cell. Longev. 2020, 2020, 36. [CrossRef] [PubMed]
3. Keerthana, G.; Kalaivani, M.K.; Sumathy, A. In-vitro alpha amylase inhibitory and antioxidant activities of ethanolic leaf extract
of Croton bonplandianum. Asian J. Pharm. Clin. Res. 2013, 6, 32–36.
4. Chawla, A.; Chawla, R.; Jaggi, S. Microvasular and macrovascular complications in diabetes mellitus: Distinct or continuum?
Indian J. Endocrinol. Metab. 2016, 20, 546. [CrossRef] [PubMed]
5. Franco, O.L.; Rigden, D.J.; Melo, F.R.; Grossi-de-sa, M.F. Plant α-amylase inhibitors and their interaction with insect α-amylases
structure, function, and potential for crop protection. Eur. J. Biochem. 2002, 269, 397–412. [CrossRef]
6. Notkins, A.L. Immunologic and genetic factors in Type1 Ficus deltoidea diabetes. J. Biol. Chem. 2002, 277, 43545–43548. [CrossRef]
7. Zheng, C.D.; Duan, Y.Q.; Gao, J.M.; Ruan, Z.G. Screening for anti-lipase properties of 37 traditional Chinese medicinal herbs. J.
Chin. Med. Assoc. 2010, 1, 319–324. [CrossRef]
8. Sangeetha, R.; Vedasree, N. In vitro α-amylase Inhibitory activity of the leaves of Thespesia populnea. ISRN Pharmacol. 2012, 2012,
1–4. [CrossRef]
9. Balan, K.; Ratha, P.; Prakash, G.; Viswanathamurthi, P.; Adisakwattana, S.; Palvannan, T. Evaluation of in vitro α-amylase and
α-glucosidase inhibitory potential of N2 O2 Schiff base Zn complex. Arab. J. Chem. 2017, 10, 732–738. [CrossRef]
10. Barnes, A.S. The epidemic of obesity and diabetes: Trends and treatments. Tex. Heart Inst. J. 2011, 38, 142.
11. Seyedan, A.; Alshawsh, M.A.; Alshagga, M.A.; Koosha, S.; Mohamed, Z. Medicinal plants, and their inhibitory activities against
pancreatic lipase: A review. Evid. Based Complement. Alternat. Med. 2015, 10, 2015. [CrossRef]
12. Pontarolo, R.; Sanches, A.C.C.; Wiens, A.; Perlin, C.M.; Tonin, F.S.; Borba, H.H.L.; Lenzi, L.; da Silva Penteado, S.T. Pharmacological
Treatments for Type 2 Diabetes. Treat. Type 2 Diabetes. 2015, 147–184. [CrossRef]
13. Eddouks, M.; Chattopadhyay, D.; De Feo, V.; Cho, W.C.S. Medicinal plants in the prevention and treatment of chronic diseases
2013. Evid. Based Complement. Alternat. Med. 2014, 2014, 180981. [CrossRef] [PubMed]
14. Jamila, F.; Mostafa, E. Ethnobotanical survey of medicinal plants used by people in Oriental Morocco to manage various ailments.
J. Ethnopharmacol. 2014, 154, 76–87. [CrossRef]Processes 2021, 9, 1671 16 of 17
15. Patel, D.K.; Kumar, R.; Laloo, D.; Hemalatha, S. Diabetes mellitus: An overview on its pharmacological aspects and reported
medicinal plants having antidiabetic activity. Asian Pac. J. Trop. Biomed. 2012, 2, 411–420. [CrossRef]
16. Khan, M.F.; Rawat, A.K.; Khatoon, S.; Hussain, M.K.; Mishra, A.; Negi, D.S. In vitro and in vivo antidiabetic effect of extracts of
Melia azedarach, Zanthoxylum alatum, and Tanacetum nubigenum. Integr. Med. Res. 2018, 7, 176–183. [CrossRef] [PubMed]
17. Chipiti, T.; Ibrahim, M.A.; Singh, M.; Islam, M.S. In vitro α-amylase and α-glucosidase inhibitory effects and cytotoxic activity of
Albizia antunesiana extracts. Pharmacogn. Mag. 2015, 11, 231.
18. Erasto, P.; Adebola, P.; Grierson, D.; Afolayan, A.J. An ethnobotanical study of plants used for the treatment of diabetes in the
Eastern Cape Province, South Africa. Afr. J. Biotechnol. 2005, 4, 1458–1460.
19. Afolayan, A.J.; Sunmonu, T.O. In vivo Studies on Antidiabetic Plants used in South African Herbal Medicine. J. Clin. Biochem
Nutr. 2010, 47, 98–106. [CrossRef]
20. Odeyemi, S.; Bradley, G. Medicinal plants used for the traditional management of diabetes in the Eastern Cape, South Africa:
Pharmacology and toxicology. Molecules 2018, 23, 2759. [CrossRef]
21. Maroyi, A. Heteromorpha arborescens: A review of its botany, medicinal uses, and pharmacological properties. Asian J. Pharm. Clin.
Res. 2018, 11, 75–82. [CrossRef]
22. Schmidt, E.; Lotter, M.; McCleland, W. Trees and Shrubs of Mpumalanga and Kruger National Park; Jacana Media: Pretoria, South
Africa, 2002.
23. Van Wyk, B.E.; Gericke, N. People’s Plants: A Guide to Useful Plants of Southern Africa; Briza Publications: Pretoria, South
Africa, 2007.
24. Stangeland, T.; Alele, P.E.; Katuura, E.; Lye, K.A. Plants used to treat malaria in Nyakayojo sub-county, Western Uganda. J.
Ethnopharmacol. 2011, 137, 154–166. [CrossRef]
25. Van Wyk, B.E.; Van Oudtshoorn, B.; Gericke, N. Medicinal Plants of South Africa; Briza Publications: Pretoria, South Africa, 2013.
26. Nkomo, M.; Nkeh-Chungag, B.N.; Kambizi, L.; Ndebia, E.J.; Sewani-Rusike, C.; Iputo, J.E. Investigation of the antinociceptive
and anti-inflammatory properties of Heteromorpha arborescens (Apiaceae). Afr. J. Tradit. Complement. Altern. Med. 2011, 8, 412–419.
[CrossRef] [PubMed]
27. Nkomo, M.; Kambizi, L. Antimicrobial activity of Gunnera perpensa and Heteromorpha arborescens var. abyssinica. J. Med. Plant. Res.
2009, 3, 1051–1055.
28. Odeyemi, S.; Dewar, J. In vitro Antidiabetic activity affecting glucose uptake in HepG2 cells following their exposure to extracts
of Lauridia tetragona (Lf) RH Archer. Processes 2020, 8, 33. [CrossRef]
29. Bustanji, Y.; Issa, A.; Mohammad, M.; Hudaib, M.; Tawah, K.; Alkhatib, H.; Almasri, I.; Al-Khalid, B. Inhibition of hormone
sensitive lipase and pancreatic lipase by Rosmarinus officinalis extract and selected phenolic constituents. J. Med. Plant. Res. 2010,
4, 2235–2242.
30. Sagbo, I.J.; van de Venter, M.; Koekemoer, T.; Bradley, G. In vitro antidiabetic activity and mechanism of action of Brachylaena
elliptica (Thunb.) DC. Evid. Based Complementary Altern. Med. 2018, 2018, 4170372. [CrossRef]
31. Van de Venter, M.; Roux, S.; Bungu, L.C.; Louw, J.; Crouch, N.R.; Grace, O.M.; Maharaj, V.; Pillay, P.; Sewnarian, P.; Bhagwandin,
N. Antidiabetic screening and scoring of 11 plants traditionally. J. Ethnopharmacol. 2008, 119, 81–86. [CrossRef] [PubMed]
32. Fowler, M.J. Diabetes treatment, part 2: Oral agents for glycemic management. Clin. Diabetes. 2007, 25, 131–134. [CrossRef]
33. Unuofin, J.O.; Otunola, G.A.; Afolayan, A.J. In vitro α-amylase, α-glucosidase, lipase inhibitory and cytotoxic activities of tuber
extracts of Kedrostis africana (L.) Cogn. Heliyon. 2018, 4, 810. [CrossRef]
34. Abifarin, T.O.; Otunola, G.A.; Afolayan, A.J. Cytotoxicity evaluation and anti-inflammatory potentials of Cucumis africanus L.f.
leaves. Med. Plants Int. J. Phytomed. Relat. Ind. 2020, 12, 48–52. [CrossRef]
35. Kim, Y.M.; Jeong, Y.K.; Wang, M.H.; Lee, W.Y.; Rhee, H.I. Inhibitory effect of pine extract on α-glucosidase activity and
postprandial hyperglycemia. Nutrition 2005, 21, 756–761. [CrossRef]
36. Bhandari, M.R.; Anurakkun, N.J.; Hong, G.; Kawabata, J. α-glucosidase and α-amylase inhibitory activities of Nepalese medicinal
herb Pakhanbhed (Bergeniaciliata, Haw.). Food Chem. 2008, 106, 247–252. [CrossRef]
37. Deshpande, M.C.; Venkateswarlu, V.; Babu, R.K.; Trivedi, R.K. Design and evaluation of oral bio adhesive controlled release
formulations of miglitol, intended for prolonged inhibition of intestinal α-glucosidases and enhancement of plasma glucagon
like peptide-1 levels. Int. J. Pharm. 2009, 380, 16–24. [CrossRef]
38. Mohammed, E.A.H.; Siddiqui, M.J.A.; Ang, L.F.; Sadikun, A.; Chan, S.H.; Tan, S.C. Potent α-glucosidase, and α-amylase inhibitory
activities of standardized 50% ethanolic extracts and sinensetin from Orthosiphon stamineus Benth as anti-diabetic mechanism.
BMC Complement. Altern Med. 2012, 12, 176. [CrossRef] [PubMed]
39. Abifarin, T.O.; Otunola, G.A.; Afolayan, A.J. Chemical Composition of Essential Oils Obtained from Heteromorpha arborescens
(Spreng.) Cham. and Schltdl Leaves Using Two Extraction Methods. Sci. World J. 2020, 2020, 1–6. [CrossRef] [PubMed]
40. Sebai, H.; Selmi, S.; Rtibi, K.; Souli, A.; Gharbi, N.; Sakly, M. Lavender (Lavandula stoechas L.) essential oils attenuate hyperglycemia
and protect against oxidative stress in alloxan-induced diabetic rats. Lipids Health Dis. 2013, 12, 1–9. [CrossRef] [PubMed]
41. Ibrahim, F.A.; Usman, L.A.; Akolade, J.O.; Idowu, O.A.; Abdulazeez, A.T.; Amuzat, A.O. Antidiabetic potentials of Citrus
aurantifolia leaf essential oil. Drug Res. 2019, 69, 201–206. [CrossRef] [PubMed]
42. Maria, J.K.M.; Rajesh, J.; Mandal, A.K.A.; Sampath, N. Antioxidant and antimicrobial activity of individual catechin molecules: A
comparative study between gallated and epimerized catechin molecules. Eur. J. Exp. Biol. 2011, 3, 145–153.You can also read