D6.3 Heating and cooling strategies for pilot cities - City of Geneva - Hotmaps
←
→
Page content transcription
If your browser does not render page correctly, please read the page content below
D6.3 Heating and cooling strategies for pilot
cities – City of Geneva
Prepared by City of Geneva: Albane Ferraris & Etienne Favey
Proof reading by CREM: Thierry Bernhard, Amara Spano & Jakob Rager
Reviewed by PlanEnergi: Anders M. Odgaard
Reviewed by City of Frankfurt: Paul Fay

Date: June 2020
Project Information
 Project name                     Hotmaps – Heating and Cooling Open Source Tool
                                   for Mapping and Planning of Energy Systems
 Grant agreement number           723677
 Project duration                 2016-2020
 Project coordinator              Lukas Kranzl
                                  Technische Universität Wien (TU Wien), Institute of
                                   Energy Systems and Electrical Drives, Energy
                                   Economics Group (EEG)
                                  Gusshausstrasse 25-29/370-3
                                  A-1040 Wien / Vienna, Austria
                                  Phone: +43 1 58801 370351
                                  E-Mail: kranzl@eeg.tuwien.ac.at
                                  info@hotmaps-project.eu

                                  www.eeg.tuwien.ac.at
                                  www.hotmaps-project.eu

 Lead author of this report       [Ferraris Albane & Favey Etienne]
                                  [Genève]
                                  [00 41 22 418 60 46 – 0041 22 418 58 53]
                                  [albane.ferraris@ville-ge.ch]-[etienne.favey@ville-
                                  ge.ch]

Legal notice
The sole responsibility for the contents of this publication lies with the authors. It does not
necessarily reflect the opinion of the European Union. Neither the INEA nor the European
Commission is responsible for any use that may be made of the information contained therein.
All rights reserved; no part of this publication may be translated, reproduced, stored in a
retrieval system, or transmitted in any form or by any means, electronic, mechanical,
photocopying, recording or otherwise, without the written permission of the publisher. Many
of the designations used by manufacturers and sellers to distinguish their products are claimed
as trademarks. The quotation of those designations in whatever way does not imply the
conclusion that the use of those designations is legal without the consent of the owner of the
trademark.

                                                                                                  2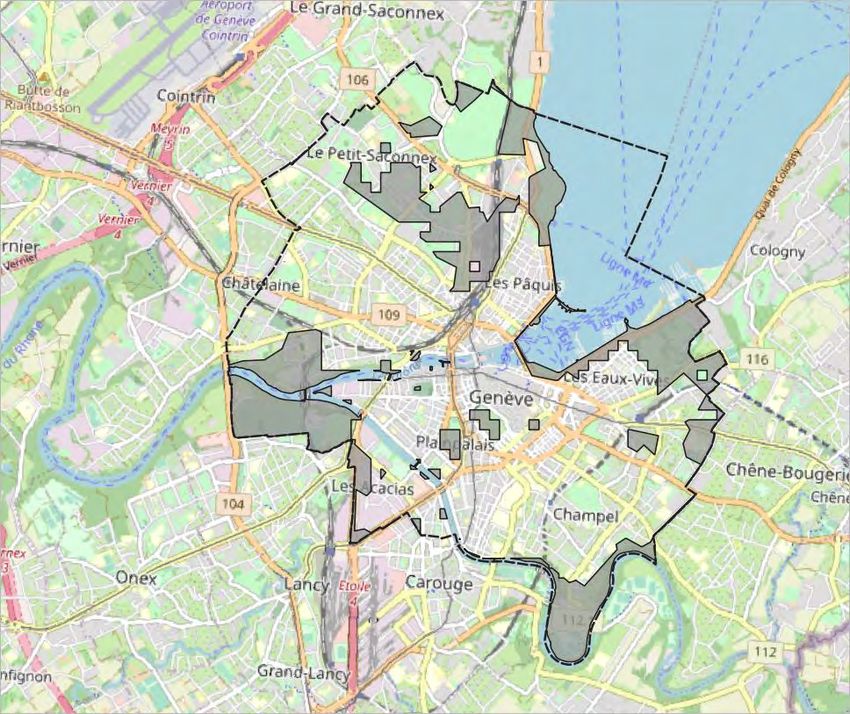
The Hotmaps project
The EU-funded project Hotmaps aims at designing a toolbox to support public authorities,
energy agencies and urban planners in strategic heating and cooling planning on local, regional
and national levels, and in line with EU policies.
In addition to guidelines and handbooks on how to carry out strategic heating and cooling
(H&C) planning, Hotmaps will provide the first H&C planning software that is
User-driven: developed in close collaboration with 7 European pilot areas
Open source: the developed tool and all related modules will run without requiring any other
commercial tool or software. Use of and access to Source Code is subject to Open Source
License.
EU-28 compatible: the tool will be applicable for cities in all 28 EU Member States and
Switzerland.

The consortium behind

                                                                                                  3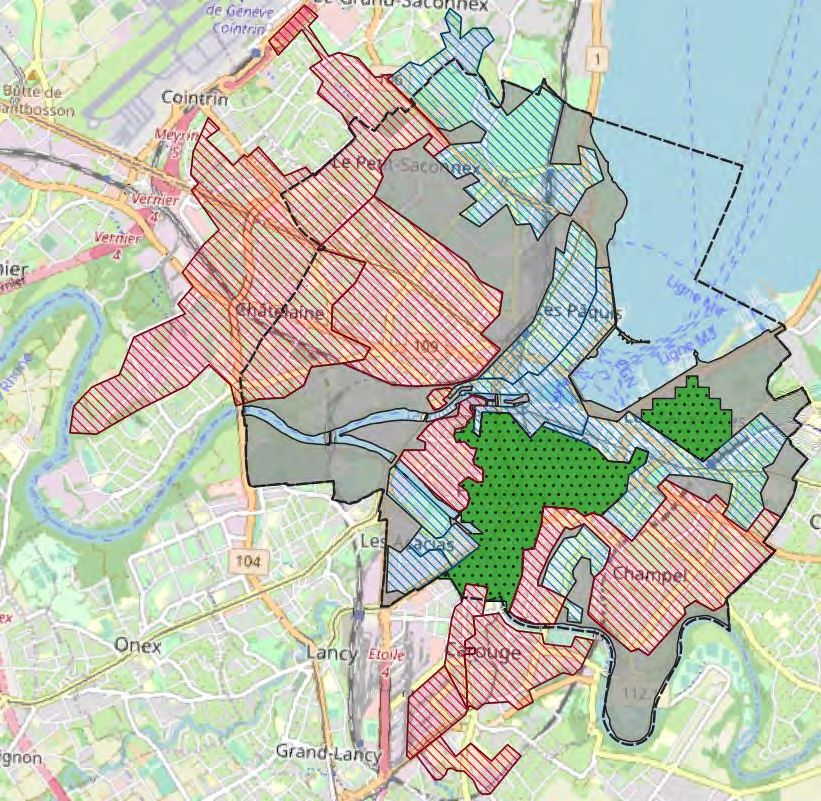
Table of contents
1.      Objectives and approach .......................................................................................................5
     1.1.      Context ...........................................................................................................................5
     1.2.      Main objectives ..............................................................................................................5
     1.3.      Urban scales ...................................................................................................................7
     1.4.      Hotmaps and the global approach.................................................................................8
2.      Targets and public policies .....................................................................................................9
     2.1.      Targets ...........................................................................................................................9
     2.2.      Policy instruments....................................................................................................... 13
     2.3.      Stakeholders ............................................................................................................... 14
3.      Description of energy demand and supply ......................................................................... 15
     3.1.      Data and mapping of demand, potential resources and existing production ............ 15
4.      Risks and opportunities....................................................................................................... 18
     4.1.      Use and deployment of Hotmaps ............................................................................... 18
5.      Strategy for heat and cold .................................................................................................. 26
     5.1.      Elements for scenarios construction .......................................................................... 26
     5.2.      Definition of three scenarios ...................................................................................... 34
     5.3.      Geneva planning roadmaps ........................................................................................ 37
6.      Methodology for using the Hotmaps Toolkit ...................................................................... 38
     6.1.      Definition of heat supply areas ................................................................................... 38
     6.2.      Determining a Representative Building Type by Zone................................................ 42
     6.3.      Reference Baseline in 2015 ......................................................................................... 43
     6.4.      Example of Scenario 1: Business as usual ................................................................... 45
7.      Conclusion and continuation of the energy planning process ........................................... 51
References .................................................................................................................................. 52
Annexes ....................................................................................................................................... 53
     Interpretation of Toolbox results, section 4.1.6. .................................................................... 53
     Summary table of results – § 6.3.2. and § 6.4.2. .................................................................... 55

                                                                                                                                                      4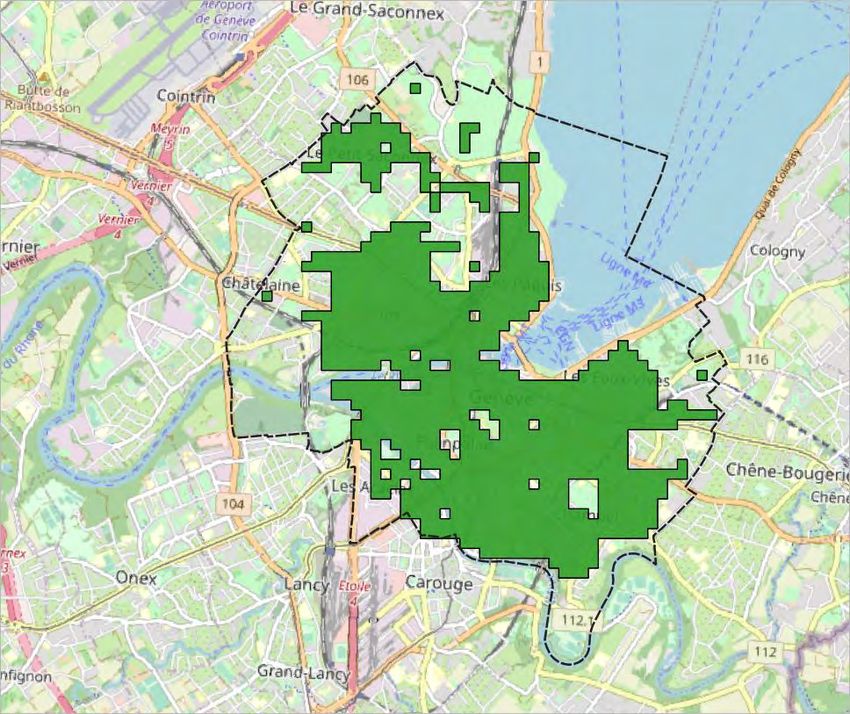
1. Objectives and approach
 1.1. Context
With 201,000 inhabitants, the city of Geneva is the most populated city in the Canton of
Geneva, with one of the highest population densities in Europe.
Located in the heart of an urban area of more than one million inhabitants, it must structure
its urban and political action as the central city, which offers infrastructures and services
available to the inhabitants of the entire urban area.
In 2005, the City of Geneva adopted a vision entitled "100% renewable in 2050" to guide its
action in the field of energy policy. The objective is to gradually make a transition from fossil
fuels to renewable energies throughout the municipality. At the same time, the City of Geneva
has also become involved at the European level and the definition of its medium-term
objectives is part of the European Commission's Covenant of Mayors. It has endorsed the 3x20
targets for 2020, namely: a 20% reduction in greenhouse gas emissions, a 20% reduction in
energy savings and a 20% reduction in renewable energy in total energy consumption.
To implement this vision, the City has developed an energy policy that focuses first and
foremost on its own real estate assets.
To meet its commitments, the City must now develop a planning in line with its vision for 2050,
on the scale of its entire territory, focusing its action on the existing urban fabric and large
consumers. Indeed, while new buildings in development areas meet high energy performance
standards, the existing building fabric, which today concentrates the majority of the
population and energy consumption, is still highly dependent on fossil fuels.

 1.2. Main objectives
The main challenge for the City of Geneva is to define the socio-economically appropriate
energy supply strategy to achieve the energy objectives set (see Chapter 2).
While there are many technical solutions to exploit the available local energy resources, the
overall strategy to achieve the objectives throughout the city is not defined. The main
challenge of the future strategy will be to develop various technical solutions at a reasonable
cost for society.
Part of these solutions now involves the development of new district heating and cooling
networks under the responsibility of the Canton of Geneva and the Services Industriels de
Genève (hereinafter referred to as SIG).
More generally, the Canton is responsible for drawing up a "master plan for energy networks"
for the entire cantonal territory. The main objective of the master plan is to define the location
of the major cantonal networks, known as "structuring networks", which will distribute energy
in certain strategic areas.

                                                                                                     5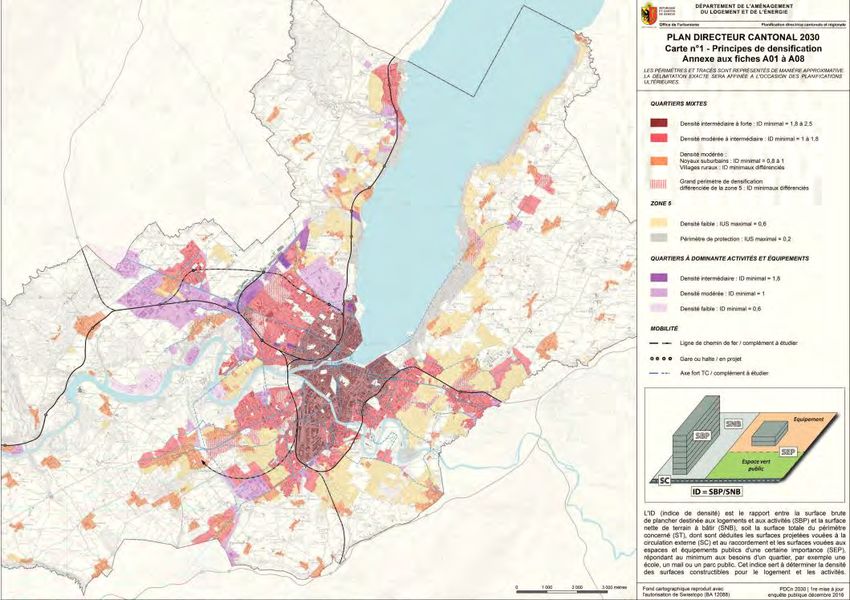
The City of Geneva represents half of the canton's heat consumption, with very high urban and
energy densities. The development of the master plan for energy networks must consider
socio-economic conditions, heating and cooling needs, the use of renewable resources and
excess heat, the extension of existing networks and the possibilities for creating new ones.
Today, the City of Geneva is ready to participate more actively in this planning work managed
by SIG and supervised by the cantonal administration. The City must also develop its own
energy planning to meet all the needs of the municipal territory, including areas that cannot be
served by cantonal heating networks (structural networks). Currently, Geneva has the largest
heat demand in the canton, but very few energy networks on its territory. In this context, the
main objectives resulting from this can be expressed as follows:
    1. Contribute with its territorial expertise during the development of the master plan for
       energy networks, in collaboration with SIG and the Canton, in order to confirm or
       challenge the planning of structural networks.
    2. Define an energy supply strategy for areas not covered by renewable district heating
       and cooling networks (based on the inventory of available local resources).
    3. Confirm the cost of the strategy and socio-economic feasibility. To ensure that
       renewable energies are made available and accessible to as many end users as
       possible.

                                                                                                   6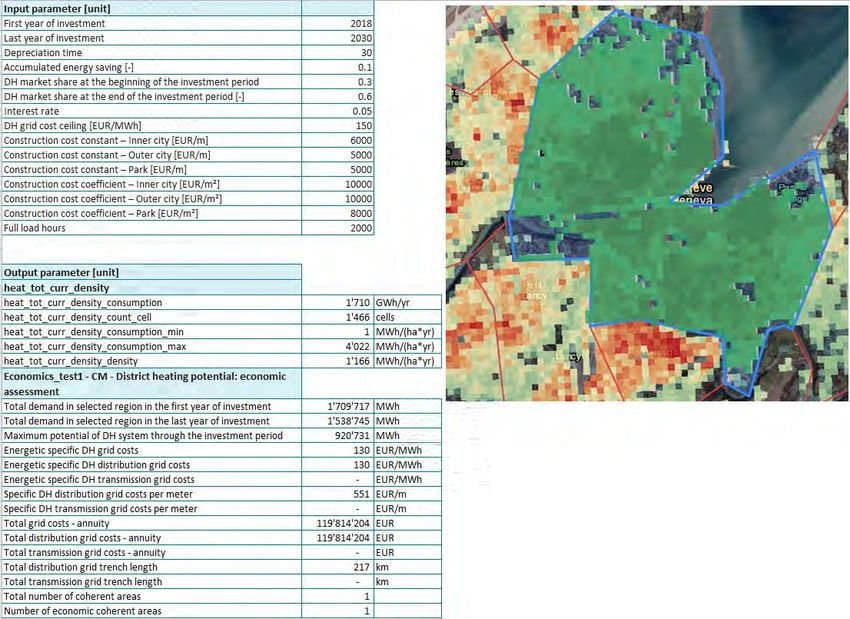
1.3. Urban scales
Building scale:
Public buildings:
The City of Geneva is a major property owner. In addition to the public and administrative
buildings, the City also owns and manages a stock of 5,400 social housing units.
Historically, the City of Geneva's energy policy has focused on the renovation and replacement
of old heating and cooling systems in its own buildings.
The municipal territory also hosts many cantonal public buildings, such as secondary schools,
universities and the Cantonal Hospital. Dialogue with the cantonal administration managing
these buildings is established and regular.
To this list of buildings must also be added all buildings linked to the international
organizations and to the public authorities, either through their pension funds or by public law
foundations, which are large property owners in the territory, and which are subject to the
same regulatory obligations as public authorities.

Private and corporate buildings:
Geneva's real estate network is essentially made up of multi-unit rental buildings,
condominiums and housing cooperatives. The companies present on the municipal territory
are essentially service companies, whose real estate stock is, in the vast majority, made up of
office buildings.
Owners or their managers are bound by cantonal energy laws and regulations concerning
building construction standards and energy supply and consumption.

District scale:
District-level thinking involves different parties. At this level, the canton encourages planning,
through the establishment of territorial energy concepts (TECs), with a strong emphasis on the
coherent development of networks and the promotion of renewable energies. The energy
concept must also take into account the surrounding neighbourhoods, in order to balance the
use of resources and share them, where appropriate.

Municipal territory:
Entitled "Geneva 2020, sustainable renewal of a city centre", the Municipal Master Plan
(PDCom) serves as a reference for all development projects in the territory. It sets out a
coherent set of medium- and long-term guidelines for spatial planning. It is also a contractual
instrument between municipal and cantonal authorities that makes it possible to establish a
shared reference base for current and future legislatures. This document was adopted on 16
September 2009 by the Municipal Council (municipal legislative body) and on 14 October 2009
by the State Council (cantonal legislative body).

                                                                                                     7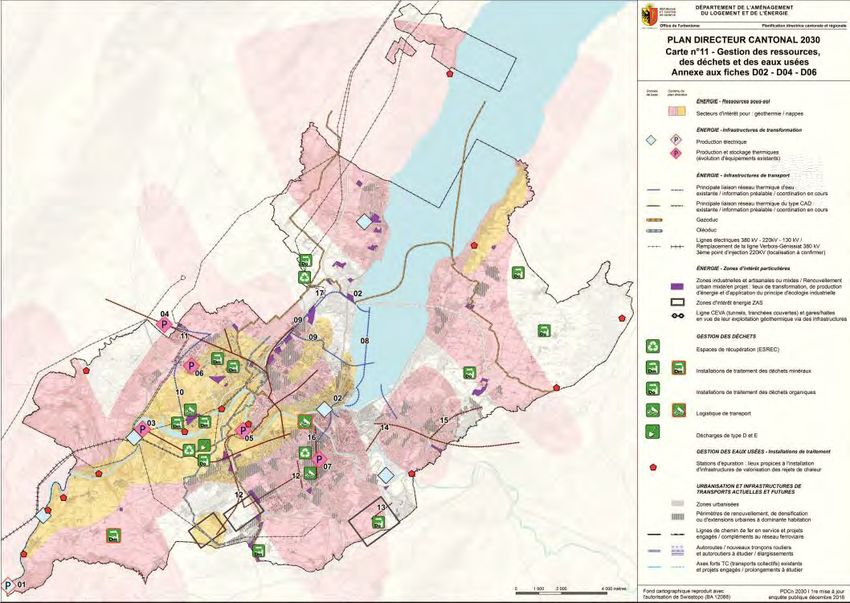
Today, it is obvious that there is a lack of a planning tool to identify the potential for local
energy supply in relation to urban development throughout the municipal territory in
accordance with the objectives previously defined by municipal energy and spatial planning
policies and to plan the necessary networks.
Therefore, the City, as early as 2016, committed itself to the European Hotmaps project,
alongside European academic partners and seven pilot cities. This tool will contribute to the
elaboration of the territorial energy diagnosis and to the testing of the different scenarios
selected.

 1.4. Hotmaps and the global approach
The Hotmaps toolbox plays a central role in the development of a coherent territorial energy
strategy for the City of Geneva. Hotmaps allows the various actors of the territory to spatialize,
visualize and scenario the energy issues of the territory in the medium (2035) and long term
(2050) time horizon and to identify the portions of territories with the highest stakes. The
Hotmaps tool is integrated with other mapped resources so that the Municipal Energy Master
Plan can anticipate and guide future energy infrastructure developments in the region by
encouraging the deployment of local renewable energies.
It must also form the basis for a dynamic exchange with the main stakeholders in the territory,
such as SIG and the Canton of Geneva.
The Hotmaps toolbox should support the planning process, including:
    ‒ Consolidating know-how in terms of existing infrastructure, energy and urban
      planning, energy demand and local resources;
    ‒ Building energy scenarios and facilitating discussions between all stakeholders;
    ‒ Helping to define a long-term energy strategy that achieves the objectives and
      is affordable and integrated with other urban planning themes;
    ‒ Helping to define an evolutionary decision-making process (able to integrate
      changes and re-evaluate results);
    ‒ Helping to define the economic issues and financial planning elements for
      network deployment, as well as to evaluate the different scenarios according to
      the desired cost of final energy.

                                                                                                     8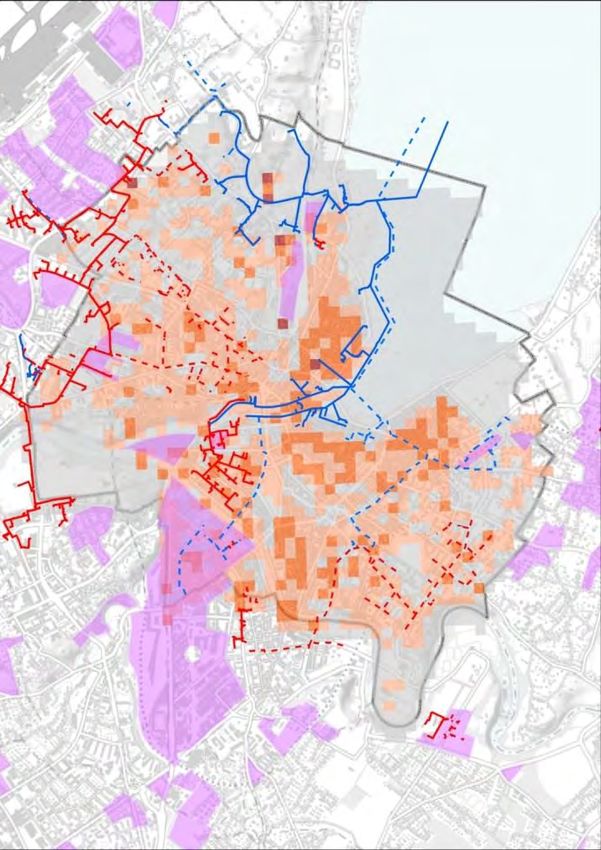
2. Targets and public policiesTargets
    2.1.1.       Local, regional and national targets
The objectives of the City of Geneva's energy policy are developed in close coordination with
the qualitative objectives set at the level of the Swiss Confederation and the Canton of
Geneva. At the same time, the City of Geneva has also been involved at the European level and
in defining its medium-term objectives related to the European Commission's Covenant of
Mayors.
The territorial approach to energy and climate policy has the following specific objectives:
             -   Reduction of heat demand
                    ▪ 50% in 2050, baseline 2005

             -   Use of renewable energies
                    ▪ 100% in 2050

             -   Reduction of CO2 emissions
                    ▪ 21% in 2020 (Covenant of Mayors), baseline 2005
                    ▪ 60% in 2030 (Cantonal Climate Plan) baseline 1990
                    ▪ 100% in 2050 (energy policy of the City of Geneva)

             -   Reduction in the end-use of heating oil for heating (for municipal buildings
                 only)
                     ▪ 0% in 2022 (73% in 2006)

The objectives set by the City of Geneva will be modified as from 2020. After the declaration of
the Municipal Council for Climate Emergency, reports were requested from the municipal
administration, with a view to establishing a new climate action plan in 2021.
The Cantonal Climate Plan sets specific targets for CO2 emissions at the cantonal level. It will be
updated in 2020-2021 and the trajectories will probably be accelerated, with the aim of
achieving carbon neutrality by 2050 and a 60% reduction in greenhouse gas emissions in 2030
(compared to 1990).
The objective of carbon neutrality means reducing GHG emissions to a value that corresponds
to the natural absorption capacity of the territory. This capacity will be determined when the
Cantonal Climate Plan is updated in 2020-2021.
Similarly, the national policy supported by the CO2 Act is currently being reviewed by the
Federal Chambers for its third review. The debates in October 2019 set a carbon neutrality
target for 2050. The medium-term trajectory is still under discussion, as well as the share of
offsetting emissions abroad. Parliamentary work will resume in 2020, with the hope of
implementation in 2021.

                                                                                                      9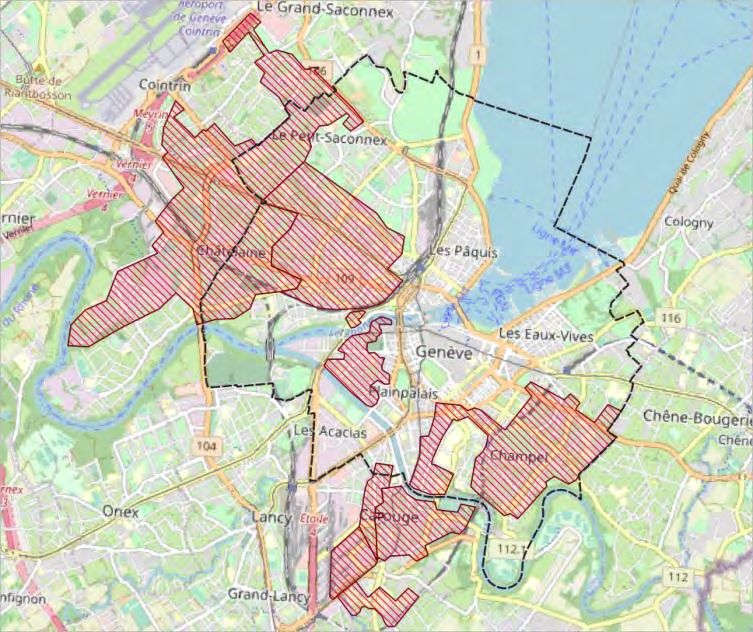
2.1.2.      Develop renewable energy infrastructure at the local level
Experience has shown that several energy resources are potentially usable in the territory. To
move to an exploitation phase, the resource must be considered at its right territorial scale, in
order to optimize implementation costs and make them competitive with fossil fuels. The rapid
and massive deployment of renewable energy solutions requires the pooling of local resources
and the establishment of collective infrastructures to distribute them, as well as the
implementation of a multi-actor financing and investment strategy.
The City of Geneva must play its role as a planning authority on its own public domain, as well
as its role as a facilitator in the development of projects, through coordination between local
actors, but also through the energy transition of its own building stock.

    2.1.3.      Develop local electricity production
The City of Geneva's vision is in line with the Confederation's Energy Strategy 2050. The
decision to disengage Switzerland from nuclear energy invites all local stakeholders to consider
a more sober energy future and to develop solutions for electricity production.
Using heat pump technology, the "100% renewable in 2050" strategy leads to an increase in
electricity consumption. In order to ensure consistency between the thermal strategy and the
need to secure electricity supply, the City of Geneva must invest in the development of local
power generation solutions and consider exploiting the potential available locally. A specific
strategy has been developed to compensate for new electricity consumption through savings
and new renewable energy sources (solar and possibly wind).
SIG is also involved in the development of photovoltaic solar energy and offers various
"products" to individuals and companies to realize the cantonal solar potential, which has
been quantified and geolocated by the Cantonal Energy Office. The data are available on the
Geneva Territorial Information System (SITG).

                                                                                                    10
2.1.4. Municipal buildings
The "100% renewable in 2050" Strategy sets out the paths for the energy transition of the City
of Geneva's buildings. In this process, gas acts as a transitional energy to replace heating oil,
when renewable energies are not immediately available. This is particularly true in the case of
planning the construction and connection to future heating networks that will be powered by
renewable energies. Territorial planning is an integral part of the Strategy at the district level.
100%
90%
80%
70%
60%
En. Renouvelable
50%
Gaz
40% Mazout
30%
20%
10%
0%
2005 2006 2007 2008 2009 2010 2011 2012 2013 2014 2015 2016 2017
En. Renouvelable= Renewable Energies; Gaz= Natural Gas ; Mazout= Fuel Oil
For the moment, the target for renewable energies has not been reached. In 2017, the share
of renewable energies for heating municipal buildings was only 4%.
This proportion is expected to increase rapidly in the coming years, thanks to the construction
of district heating networks and their connection to some of the largest consumers (e. g. large
housing estates, municipal swimming pools or ice rinks).
Increase in the share of
18% renewable energy in the
Couverture Réelle % supply of municipal real
16%
estate stock
14% Objectif 100% renouvelable
12%
Objectif partiel
10%
8%
6%
4%
4%
2%
0%
2005 2006 2007 2008 2009 2010 2011 2012 2013 2014 2015 2016 2017
As well, the objective of reducing energy consumption for heating municipal buildings has not
yet been achieved. The main reason is to be found in renovation interventions that have rather
11concerned small objects in recent years (renovation requirements linked to the age of
buildings).
Projects concerning large consumers are currently being implemented and/or planned. These
operations require very strong coordination, as investments are very large and must be spread
over time. A strategy for the energetic and constructive remediation of large consumers is
being developed, and the results will be visible in a few years' time. This process involves a
long and complex process of reflection on the prioritization of investments and the timing of
interventions, which can take several years.
Reduction in energy
14% consumption for heating
Diminution réelle in the municipal building
12% stock
Objectif 100% renouvelable 9.44%
10%
Objectif partiel
8%
6%
4%
2%
0%
2005 2006 2007 2008 2009 2010 2011 2012 2013 2014 2015 2016 2017
The implementation of the "100% renewable" strategy and specific energy transition actions
have made it possible to meet the objectives of reducing CO2 emissions from the City of
Geneva's real estate portfolio.
Reduction of CO2
30% emissions from the
Diminution émissions CO2 municipal building stock
24.9%
25%
Objectif 2020
20%
15%
10%
5%
0%
2005 2006 2007 2008 2009 2010 2011 2012 2013 2014 2015 2016 2017 2018 2019 2020
122.2. Policy instruments
2.2.1. National level
The objectives of the Swiss energy strategy 2050 are:
‒ Increase energy efficiency,
‒ Develop renewable energies,
‒ Gradually replace nuclear energy.
This strategy is implemented in the following legislative rules:
‒ Energy laws and strategies (Confederation and Canton of Geneva)
‒ Climate strategy with national CO2 law (the new version is currently being
consulted - implementation expected in early 2021)
2.2.2. Cantonal level
‒ Climate plan
‒ General energy concept
‒ Energy Master Plan
‒ Networks energies master plan (district heating and cooling, electricity, gas
and water)
2.2.3. Municipal level
- European Energy Award Gold
- Municipal energy and climate policy with Action Plan 2011-2014 and 2014-
2018
- Strategy "100% renewable in 2050 for heating municipal buildings" (2006)
- Municipal electricity strategy: "Consuming less and producing better" (2011)
132.3. Stakeholders
Although it is necessary to consider the many stakeholders (see figure below), the main ones
are undoubtedly the cantonal authority (Canton of Geneva) and the Services industriels de
Genève (SIG), supplier of network energies (public utility company). As a public company, SIG's
capital is held by the State of Geneva (55%), the City of Geneva (30%) and other municipalities
(15%). The City of Geneva has one member who attends the Board of Directors.
The tables below summarize the roles and objectives of the various stakeholders identified:
143. Description of energy demand and
supply
3.1. Data and mapping of demand, potential resources
and existing production
3.1.1. Characterization of energy demand
The following table presents the various data available, concerning the characterization of the
building stock and its energy consumption.
Available data (Building stock) Yes/No Unit / Data format (excel, tab, GIS etc.)
1. Georeferenced (geographic YES Building Cadastre with ID number for each
coordinates) building (EGID)
2. Gross floor area YES - Heat surface available at 1 ha grid
- Number of floors and footprint area
3. Construction year YES - Construction period always available
- Construction year not fully available
4. Refurbished year YES Transformation year available
5. Building type / use YES As per Geneva’s classification
6. Heat demand (MWh and/or YES - Installed power by heating system at building
MW) level
- Heat demand, consumption, heat power at 1 ha
grid
7. Existing heat supply: natural YES Type of heating system available at building level
gas, district heating, individual
oil boiler etc.
A lot of data is available on this website: https://www.etat.ge.ch/geoportail/pro/
The heat demand is available at the building level. The historical data are saved so that at the
building level, it is possible to know the average consumption of the building over 2 or 3 years.
An infrared thermography of the entire Canton of Geneva is also available on the site.
153.1.2. Balance of energy deliveries to final consumers in the
canton of Geneva [MWh]
3.1.3. Production and supply of electricity to the Geneva cantonal
grid [MWh]
Verbois (hydro)
Chancy-Pougny (hydro)
471.992 Cheneviers (Waste)
Seujet (hydro)
CCF SIG (Sun,Geoth)
260.862 Other
Imports
67.611
18.123
1.956.741 1.121
36.542
Total electricity network consumption (without CERN) : 2’812’992 [MWh]
CERN: 759 [MWh]
163.1.4. Heat distribution in municipal buildings
Heat supply to municipal buildings, 2017
CAD = District heating ; PAC = heat pumps
The district heating part has a renewable part, which varies according to the networks. By
default, we can consider a share of 20% renewable and 80% gas.
174. Risks and opportunities
The current legal framework does not ensure a clear division of roles and responsibilities: The
Canton of Geneva requires the municipalities to develop their energy plans; on the other hand,
the canton has designated SIG to develop the Network Energy Master Plan.
The resulting lack of coordination requires the involvement of more stakeholders, such as the
City of Geneva, in the various planning processes. In this respect, the Hotmaps toolbox can
play an important role in providing a common understanding of situations and opportunities.
4.1. Use and deployment of Hotmaps
4.1.1. Risks regarding data availability in Switzerland
The Hotmaps project has created data, based on available data from European organisations
or previous European research projects. As Switzerland is not part of the European Union,
some Swiss territorial data may not be included in these different data sources. Particularly in
terms of energy resources (agricultural and forest residues).
Currently, the default database therefore has two incomplete datasets for the Swiss territory,
including Geneva. In fact, the calculation modules, who need those two specific data sources,
may not work if the required data is missing. Users have the possibility to fill these gaps
personally. It should be noted that the verification process carried out during the Hotmaps
project, particularly for Swiss cities, allowed a calibration of the default dataset.
In addition, many territories, such as the City of Geneva, have more precise data (based on real
data) than those offered by default on the Hotmaps platform (obtained by modelling the
territory). Therefore the local data is often preferred– also for the calculations.
One of the main challenges for the deployment of Hotmaps in Swiss cities will therefore be
related to the ease of importing their own data.
184.1.2. Analysis of the potential of grid energy developments
The following figure represents an overview of the methodology used in the framework of the
municipal grid energy strategy. The main steps are as follows:
‒ Integration of OCEN data into the Hotmaps platform.
‒ Use of Hotmaps calculation modules (CM - District heating potential: economic
assessment and CM - District heating potential areas: user-defined thresholds) to
identify areas with very high development potential.
‒ Overlay of results obtained with SITG maps, such as planning of structural networks.
‒ Analysis of the adequacy of network planning and territorial demand.
194.1.3. Data processing
The Canton of Geneva benefits from a very rich geographical information system (GIS), which
includes a great deal of energy or energy-related data (as descripted in chapter 3).
Integration of the heat demand of the Canton of Geneva
The Office de l'énergie du Canton de Genève (OCEN) has vector data on current and future
heat demand (2030) - in the form of a heat density map.
In order to refine the results of the calculation modules, we have created two "raster" layers
(Geneva current and Geneva 2030), compatible with the Hotmaps platform and its calculation
modules, based on OCEN data.
In order to guarantee a perfect superposition of data on the Hotmaps platform, the OCEN data
were rasterized on a Hotmaps data extraction, on the territory of the City of Geneva.
Process of rasterization of vector data
Personal Layer « Geneva current » Heat density Default data set
204.1.4. “District heating potential area” Calculation module
By importing these layers into Hotmaps, we can begin to develop a planning vision of the
territory. For example, by integrating the results of the CM-District heating potential areas:
user-defined thresholds. This vision can also be enhanced by reimporting these results into
dedicated mapping software and superimposing existing and planned heating and cooling
networks, as well as areas of the territory in transition (development projects).
21These results can be transposed to a 2030
vision, using the "Geneva 2030" map and
applying the same treatment.
From this basis, specific scenarios can
be developed for areas that are
outside the influence areas of the
structural networks, but which
represent a strong potential for the
development of heating networks
(example in red on the map).
224.1.5. Extraction of Toolbox results and contextual linking
The results obtained by processing one calculation module must be usable and reprocessed in
another calculation module.
For example, if the CM - District heating potential areas: user-defined thresholds gives a
result identifying two areas with high potential for developing a heating network, the data
from these two areas should be used to apply the CM - District heating potential: economic
assessment.
This successive analysis of the same result contributes to the construction of different
scenarios, if the data can be saved and reused in the tool.
Similarly, the user must be able to enter "exclusion" fields in the calculation modules. For
example, if in an area of the city there is already a heating network, which provides all its heat
potential, then the user must be able to exclude this area from future calculations, in order not
to distort his scenario with false results.
234.1.6. Interpretation of the Toolbox results
In the case of Geneva, which has a very high density (heat and buildings) and very high
construction costs, the results with the values proposed in the various default scenarios are
not sufficiently contrasted to allow a remarkable variation to be distinguished. With the CREM,
we tested values closer to the Geneva reality. The Toolbox allow you to enter custom values
that are more in line with the reality of each city.
Similarly, the results of the various calculation modules must be able to be interpreted
unambiguously. The inputs must therefore be clear and based on a local reality.
Example 1: CM - District heating potential: economic assessment
This CM is one of the most important in Hotmaps. It must be very easy for the user to
understand and the results obtained must also be very clear and easily interpretable. Because
these results will constitute the main elements of the development of scenarios and strategies
of user cities.
The explanations of this CM are not very clear and can create confusion for the user. The WIKI
chapter does not clarify this situation. We suggest including examples and clarifying user
support, especially in the titles and definitions of inputs and outputs.
Examples have been constructed to show the different results obtained by varying key
parameters (see annex).
24Example 2: CM - District heating potential areas: user-defined thresholds
This calculation module is particularly useful for quickly identifying areas of potential for the
development of heating networks based on the energy demand characteristics of the territory.
As the energy densities of the Geneva area are particularly high, the default values do not
provide sufficiently detailed information. A sensitivity matrix was therefore developed, based
on OCEN data, to identify the city's consumption hotspots.
The following table gives the values of the inputs of the calculation module, and the results
obtained in terms of coverage of needs by the heating networks and the number of associated
zones.
Min. heat demand in hectare
Geneva current
500 1000 2000 3000 4000
25 97.96% | 1 94.59% | 2 65.84% | 4 15.51% | 4 2.48% | 1
Min. heat demand
50 97.96% | 1 92.02% | 1 59.26% | 1 9.98% | 2 --
100 97.96% | 1 92.02% | 1 59.26% | 1 -- --
in a DH area
200 97.96% | 1 92.02% | 1 59.26% | 1 -- --
400 97.96% | 1 92.02% | 1 59.26% | 1 -- --
800 97.96% | 1 92.02% | 1 59.26% | 1 -- --
3000 | 25 3000 | 50 4000 | 25
500 1000 2000
The variation of the results according to the evolution of the input variables clearly
shows that the potential for the development of thermal networks in Geneva is high.
However, it is still difficult to assess the risk or "conservatism" of some scenarios. To
do this, documentation and user support must reflect the different scenarios that
would better "qualify" the results.
255. Strategy for heat and cold
5.1. Elements for scenarios construction
5.1.1. Current trends (source: Cantonal EDP project)
A quick overview of energy deliveries to end consumers in the canton of Geneva since 2000
expressed in GWh (see graph below) reveals various trends: the reduction of fuel oil in the
cantonal energy mix in favour of an increase in natural gas deliveries, a drop in fuel deliveries,
and a slight change in electricity deliveries.
In 2017, a view of the development of fossil thermal energy consumption per capita in Geneva
compared to the year 2000 shows a downward trend that must be continued, as shown in the
graph below. The indicator is, however, strongly influenced by the canton's constant
population growth.
In view of the comparative development between Geneva and Switzerland in terms of per
capita electricity consumption compared to the year 2000, it is once again possible to observe
a downward trend, as shown in the graph below.
26Just over 60% of electricity is consumed by economic activities. Private households and
collective uses (general building services and public lighting) account for 23% and 13%
respectively.
The canton's goal of a nuclear-free 2000-watt society confirms its determination not to rely on
nuclear power plants in Switzerland or abroad.
275.1.2. GéniLac
The canton and SIG are currently building a scenario based on the use of the lake for heating
and cooling buildings. This network is called "GeniLac". It was developed in the UN and
international organisations sector almost 10 years ago. It is primarily used to meet cooling
needs. It will provide the connected buildings with a water flow at a temperature of 10 to
12°C. This water can also be used as a cold source for decentralised heat pumps (as shown in
the diagram below). The development of heat networks based on a central heat pump is also
possible with this type of infrastructure.
The canton and SIG are planning to expand the network in various parts of the city, after the
pumping and distribution systems for Lake Geneva water have been extended. A roadmap has
been established for the development of GeniLac. The main challenge is to create networks on
the City's territory where heat demand is highest, but implementation is more difficult than in
less dense areas. The city centre is close to the lake and the Rhône, so GeniLac seems to be an
interesting solution.
28Roadmap - GeniLac
2017 2019
2021 2023
2025 2027
295.1.3. Planned developments
In addition, the canton and the SIG encourage other scenarios:
‒ Interconnection and connection of existing district heating networks;
‒ the use of excess heat and biogas from wastewater treatment plants;
‒ explore the geothermal potential at different depths.
These strategies are being developed and discussed with stakeholders as part of the Energy
Master Plan and the Network Energy Master Plan. The new versions will come into application
in 2020.
On the other hand, other stakeholders are developing their own heating and cooling networks
based on the excess heat from large companies close to them. For example, CERN's excess
heat will provide heating and cooling for a new area near Geneva that will include 2,500 new
homes.
5.1.4. Geothermal energy
The potential of geothermal energy is currently under
study. After two years of exploration of the Geneva subsoil
as part of the 2020 geothermal programme, SIG and the
Canton of Geneva are unveiling their first results.
Five areas of the canton meet the geological requirements for medium-depth geothermal
energy and some shallow groundwater. The City of Geneva is not concerned for many reasons
at the moment: the "Geneva groundwater" is partly located on the territory of the City,
explorations are complex in urban areas due to traffic, noise, etc.
The five zones have the ideal geological characteristics for geothermal energy exploitation:
limestone, porous and permeable rock, rocks with faults in which water flows easily (high
permeability). These resources are located at depths between 500m and 3,000 m, for
temperatures in the range of 25 to 120 °C.
The program begins the detailed exploration phase in 2019. Drilling of a deep well is expected
to begin in 2020.
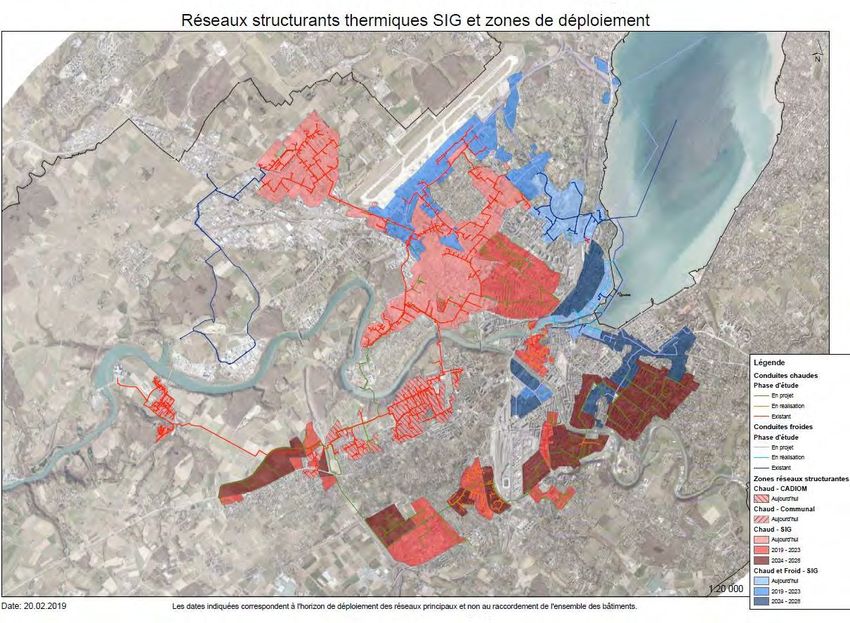
305.1.5. Development of heating and cooling networks - Planning
elements
The Network Energy Master Plan is currently being validated. It provides a guiding image of
future network deployments or interconnections in the canton of Geneva (time scale 2030).
This image is not definitive, but it allows the development of different scenarios on the scale of
the City of Geneva.
The guiding principles of this image are that the zones delimited around each network route
are established on the assumption that 100% of the buildings will be connected (available
capacity and verified economic efficiency). The areas in shades of red are heating networks,
the areas in shades of blue are the GeniLac network.
These zones are defined in the scenarios below as structuring network zones. The
development of these networks is ensured by SIG.
315.1.6. New regulatory elements
The draft Energy Master Plan (canton) also provides for regulatory changes. Among these, the
most important are the tightening of energy requirements for renovations and new buildings,
the obligation to connect to a grid if there is a structural network nearby, the ban on the use of
fossil fuels in new buildings, and the obligation to cover a certain proportion of heat and
electricity consumptions with rooftop solar energy.
These regulatory changes should be validated during 2020, for entry into force between 2021
and 2025.
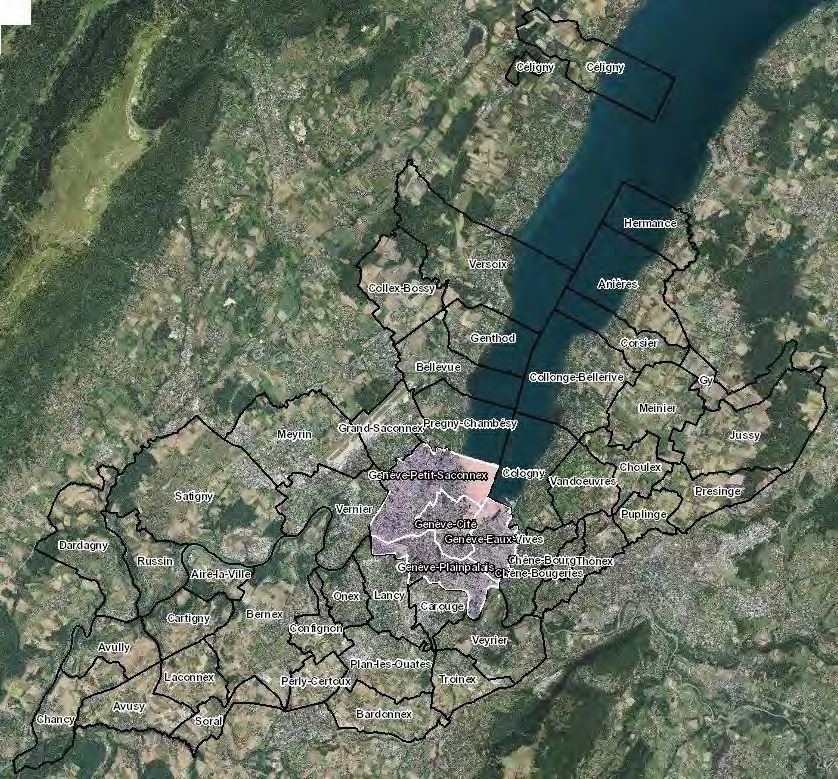
5.1.7. Urbanism – cantonal strategy 2030
The canton plans to accommodate an additional 100,000 inhabitants in 2030, including 25,000
in the City of Geneva. The current city is becoming more and more dense with taller buildings.
The city extends into industrial areas or the surrounding countryside, which host or plan many
construction projects.
In line with this development, the canton is reviewing the waste and wastewater treatment
network and some parts of the energy networks by 2030. As can be seen on the map, the City
of Geneva is not very concerned, with the exception of an area to the south called Praille-
Acacias-Vernets (PAV).
3233
5.2. Definition of three scenarios
    5.2.1.      Four types of heat supply
The calculation module CM - District heating potential: economic assessment is used to define
economically coherent areas for the development of heating networks. These areas overlap
with the areas defined in the Network Energy Master Plan, which defines the development
areas of the structuring networks, driven by SIG. Thus, three types of zones appear that are
likely to receive urban networks in Geneva: high-temperature structuring network zones, low-
temperature structuring network zones (GeniLac) and economically coherent zones, but not
included in the SIG planning.
Finally, areas that do not have sufficient heat demand density to allow the development of
heat networks, and where decentralised and renewable solutions will have to be found.
The methodology for defining the four zones is detailed in Section 6.1.

    5.2.2.      Three levels of intervention
Within these different planning areas, three types of public intervention are possible. Each
type of intervention determines a scenario:

    5.2.3.      Scenario 1: Business as usual - BAU
                Over the next 10 years the progression will continue based on the trends of
                today and the past few years.
                Regulatory requirements are the same as in 2019.
                Subsidies are available and linked to the revenues from the CO2 tax. In Geneva,
                a total of CHF 35 million is available for private individuals within the
                framework of the building programme and for energy renovation projects. This
                availability is assumed to remain constant until 2030.
                The rate of renovation is identical, i.e. 1% per year. (In terms of the number of
                renovated buildings - objects, out of the entire cantonal building stock).
                The standards for renovation and construction are identical.
                The final cost of energy is indexed to inflation.
                SIG structuring networks are built.
                By 2030, the connection rate will reach 70% for the structural networks.
                Air conditioners remain on sale
                The law for the cooling of industrial sites does not change.

                                                                                                    34
5.2.4. Scenario 2: Implementation of PDE + PDER projects
The cantonal Energy Master Plan (PDE) and Networks Energies Master Plan
(PDER) are implemented. The objectives set out in the PDE are well on the way
to being achieved by 2035.
Structured network developed at 100% with a 100% connection rate.
Regulatory requirements are adapted to the objectives of the PDE.
The renovation rate is 2.5% per year.
Renovation and construction standards are improved. The average IDC (heat
consumption index) after renovation is 250 MJ/m2. (Minergie-Rénovation
standard).
New buildings must comply with the Minergie-P standard (assumption to be
specified in the amendments to the legislation in 2021)
The tax on CO2 increases to CHF 210 per ton instead of CHF 120 which impacts
the cost of energy. Energy cost = inflation + CO2 tax
Subsidies increase in line with the revenue from the CO2 Act. According to the
terms of the CO2 Act 2021.
Obligation to cover 30% of domestic hot water requirements with solar
thermal energy for new construction projects or renovated buildings.
Obligation to supply 30 Wp per m2 of new or renovated SRE (energy reference
area) with solar photovoltaic energy.
Enhancing natural cooling in renovations and in the design of new buildings.
Promotion of air-water heat pumps in areas outside the structuring networks.
5.2.5. Scenario 3: Intervention +
Same as scenario 2 and more:
The municipality encourages the development of secondary DH networks
(outside the structuring network) with a 100% connection rate.
Outside the DH zone, a decentralised strategy based on the promotion of air-
water heat pumps or the use of local resources is set up.
355.2.6.
Scenarios 100% renewable - zero CO2 emissions in 2050
2030 Scenarios
Variables 1. Business as usual 2. PDE/R 3. City support
Structuring Structuring Structuring
Networks Areas City DH Areas Areas without DH Networks Areas City DH Areas Areas without DH Networks Areas City DH Areas Areas without DH
Regulatory Requirements No connection Renewable energy Renewable energy Requirement for Renewable energy Renewable energy Requirement for Requirement for Obligation renewable
requirements requirement for requirement for connection requirement for requirement for connection connection energy on new
building or
new buildings or new buildings or new buildings or new buildings or
refurbishment. Fuel
refurbishments as refurbishments as refurbishments refurbishments oil ban from 2023.
of 2023 of 2023 Obligatory biogas
share.
SIG structuring networks between 50 and 100% connection in 100% connection in 100% connection in
70% connection 2030 2030 2030
Refurbishment rate 1% 1% 1% 2% 2% 2% 2% 2% 2%
Refurbishment Energy standard 20% of Minergie 20% of Minergie 20% of Minergie Minergie Minergie Minergie Minergie Minergie Minergie
New Building Energy standard Minergie Minergie Minergie Minergie P Minergie P Minergie P Minergie P Minergie P Minergie P
Final Enery cost 15 ct/kWh 10 ct/kWh 10 ct/kWh 15 ct/kWh 10 ct/kWh 10 ct/kWh 15 ct/kWh 15 ct/kWh 15 ct/kWh
Grants CH Building CH Building CH Building CH Building CH Building CH Building CH Building CH Building CH Building
Program Program Program Program + cantonal Program + cantonal Program + cantonal Program + cantonal Program + cantonal Program + cantonal
program program program program program + program
municipal support
Cooling requirements according to Data according to Data according to Data according to Data according to Data according to Data Taking into account the needs related to adaptation to
Scenarios - basic values for comparison
set Hotmaps set Hotmaps set Hotmaps set Hotmaps set Hotmaps set Hotmaps climate change: cold on GéniLac, on heat pumps with subsoil
recharging
Fixed Variables
New Gross Floor Area
Construction costs
Interest rates
365.3. Geneva planning roadmaps
We want to use Hotmaps to develop and track the entire energy planning
process (including monitoring).
The data available at the municipal level will be adapted to make it compatible
with the processing of Hotmaps.
Scenarios will be developed based on the results of the CMs. They will be
compared with each other with the Hotmaps Toolbox.
The scenarios will be confronted with OCEN and SIG expertise in order to find
a consensus for planning and implementation.
Negotiations with the OCEN and SIG have already begun.
We need to share the tool with our partners. For this, it is imperative that the
descriptions of the inputs and results are clearly and quickly defined in the
WIKI.
376. Methodology for using the
Hotmaps Toolkit
6.1. Definition of heat supply areas
6.1.1. Use of the CM-Economic Assessment:
• Definition of an economically consistent area for district heating with the following
user data :
Ceiling cost for the construction of the DH network [EUR/MWh].
Average construction cost [EUR/m].
Construction cost index [EUR/m2].
Interest rate (%)
• With the result (shapefile) of the economically coherent zone, determine the 4 zones
with different heat supply:
1. High-temperature structuring networks : fixed input (in red in the illustrations)
2. Low-temperature structuring networks (GéniLac): fixed input (in blue in the
illustrations)
3. Other district heating (in green in the illustrations): obtained on QGis by
subtracting from the economically coherent zone (Resulting from the CM) the 2
fixed zones of structuring networks
4. Decentralized heating (in grey in the illustrations): obtained from QGis, areas not
covered by zones 1, 2 or 3.
6.1.2. Process implemented:
386.1.3. Supply Areas Mapping Results
DH Coherent area
Structuring Networks Areas
Low-temperature structuring networks GeniLac High-temperature structuring networks
39Decentral heating area
Manual simplification
40Final four working areas
416.2. Determining a Representative Building Type by
Zone
In order to quickly obtain results for the evaluation of the scenarios, a first data processing is
necessary.
We have chosen to determine a representative building type per zone, defined essentially by
the value of heat consumption per gross floor area (kWh/m2*year).
The process is as follows:
Thus, a unique building typology is used for each zone for further processing with the Hotmaps
toolbox.
426.3. Reference Baseline in 2015
In order to make the scenarios comparable, a baseline summary must be established. This will
allow the assessment of the advantages/disadvantages of each scenario.
The starting situation can be considered as a situation mainly covered by decentralised heating
systems. A first "run" of the CM-Decentral heating supply is carried out, by zone, in order to
determine the reference energy consumption and CO2 emissions.
6.3.1. Reference variables
Scénario 2015 Centre non
Mix technologies Réseau str chaud GéniLac Centre dense dense
Oil boiler 59% 59% 59% 59%
Natural gas 40% 40% 40% 40%
HP Brine-to-Water 0% 0% 0% 0%
Other 1% 1% 1% 1%
Total 100% 100% 100% 100%
The "Other" value can be considered as gas (small DH networks) or possibly firewood (marginal
share), whose CO2 impact is neutral.
436.3.2. 2015 baseline results
A summary table of results is presented in Annex.
Final Energy Demand (MWh/yr) per area
Emissions CO2 (tCO2/yr) by area
446.4. Example of Scenario 1: Business as usual
6.4.1. Main variables of the scenario
Below is a description of the methodology applied with the Hotmaps toolkit for a conservative
"BAU" scenario. This scenario still includes a large share of gas in the supply mix and a
connection ratio ("Réseau structurant chaud" zone - red zone) of 50% to the new heating
networks, themselves supplied by 50% renewable energy (CO2 neutral). The red zone’s
indicators are calculated with the CM-District heating supply dispatch for the heat demand
covered by the network. Indicators for the remaining demand are calculated with the CM-
Decentral heating supply.
The blue zone GeniLac is considered as an area where the "lake water" resource is delivered to
the foot of the buildings, but the building is equipped with an individual heat pump. In fact, the
zone is considered as a decentralized heating zone, with a preponderance of heat pump
technology. The scenario does not include the development of heat networks in the "Dense
Centre" zone (green zone) and the "Non-Dense Centre" zone (grey zone). These three zones
(blue, green and grey) are therefore studied with the CM-Decentral heating supply.
The variables used are summarised in the following tables:
Variables Hotmaps
Baseline (2015) Territorial Average
Gas 40%
Oil 59%
Firewood 1%
Scénario 2030 Réseau str chaud GéniLac Centre dense Centre non dense
Gas 40% 40% 60% 60%
Oil 10% 10% 20% 20%
Firewood 1%
DH mix (50% waste + 50% gas) 50%
HP 50% 20% 19%
CO2 emission factors kgCO2/kWh
Gas 0.1923
Oil 0.2652
Firewood 0
Electricity GE 0.012
Electricity mixCH 0.145
HP (cop=3) 0.004 kg/kWh heat
DH Gaz 0.1923
DH mix (50% waste + 50% gas) 0.1326
CH- CO2 Tax Period Gas Oil
CHF/tonne ct/kWh ct/kWh
96 2018-2020 1.85 2.55
120 2020-2022 2.31 3.18
210 2022-2030 4.04 5.57
45The implementation process is as follows:
466.4.2. Scenario 1 results by zone
A summary table of results is presented in Annex.
Economic results
LCOH : Levelized cost of heat 2015 2030
decentral Oil boiler dec EUR/MWh 80.8 148.8
Natural gas dec EUR/MWh 87.9 115.2
Biomass_Automatic dec EUR/MWh 49.2 43.8
HP Air-to-Air dec EUR/MWh 70.3 59.1
HP Brine-to-Water dec EUR/MWh 65.1 55.9
Electric heater dec EUR/MWh 207.1 214.3
central Heat Pump cen EUR/MWh 0.0 145.0
Waste Inceneration Plant cen EUR/MWh 0.0 225.8
Decentral EUR/MWh 83.7 116.6
Central EUR/MWh 0.0 187.5
Total EUR/MWh 83.7 141.2
In developing this scenario, the major challenge is to develop an accurate cost estimate for the
GeniLac zone and the network structuring zone, as it must be possible to incorporate the costs
of network construction. Currently, the toolbox does not propose a CM for the low
temperature district heating network.
We have tested the following method: We used the CM - Decentralised Heating Supply to
calculate the costs of decentralised heat pumps and used the CM - District Heating Potential
for the economic evaluation of the costs of building the cold water network.
The results presented are an aggregation of the two CMs. However, it seems that the main
difficulty of this methodology is the fine configuration of the inputs in order to reflect as
accurately as possible all the costs related to a low temperature network. We still need to
refine the inputs to best match the reality in the field. But these tests have made it possible to
establish a reproducible methodology.
47Energy and Climate Results
486.4.3. Comparison with the reference baseline
Réseau str chaud GéniLac Centre dense Centre non dense Total
CO2 2015 123 913 113 625 56 211 43 928 337 677
CO2 2030 119 682 47 756 39 477 31 160 238 075
Decrease in emissions 3.4% 58.0% 29.8% 29.1% 29.5%
Final Energy 2015 698 124 640 162 316 688 247 488 1 902 462
Final Energy 2030 866 156 401 624 268 832 211 421 1 748 032
Decrease in energy -24.1% 37.3% 15.1% 14.6% 8.1%
The overall reduction in CO2 emissions is less than 30%. The energy and climate
policy target is not being met.
49The greatest reduction in emissions is in the blue zone (GeniLac) with a value of 58%. It is
surprising to note that the "Réseau structurant chaud" zone (red zone) only benefits from a
3.4% reduction, less than the green and grey zones which see their emissions reduced by 30%.
This small reduction is explained by a very "pessimistic" CO2 emission coefficient, as the
network could be supplied via the heat from waste incineration and a transition share from
fossil fuels to renewable energies of only 25%. This means that waste incineration, while it
meets the requirement for the development of heating networks, does not meet climatic
requirements. In terms of energy planning, this means that an additional renewable heat
source must be found and integrated into the projections of the more interventionist
scenarios.
The reductions in the green and grey zones are mainly explained by a transfer of heat
production from oil to gas or to heat pump.
Useful energy consumption does not really decrease. The scenario does not include actions
related to the energy efficiency of buildings. This stability is therefore logical.
507. Conclusion and continuation of the
energy planning process
The elements presented in the City of Geneva's strategy are a first step in the territorial energy
planning process.
Given the time limits of the Hotmaps project, it seemed a priority to us to define and test a
methodology for optimum use of the toolbox.
The results obtained on the first scenario (BAU) do not meet the objectives of the City of
Geneva, but this was expected.
Within the framework of our strategy for using the toolbox, these results are not formally
important. Our priority was to develop and present a succession of reasoning and results
provided by the calculation modules, in order to evaluate the other scenarios and to know the
important variables in this way of proceeding.
The main result of this work is to understand how to determine the areas of influence of
certain projects and to identify the different technological solutions that will be implemented
in these different areas and to determine their economic and climatic impacts.
For the Hotmaps project, we carried out a rather simple segmentation of the territory. For the
rest of our territorial planning process, we will probably have to refine this territorial
segmentation in order to have a more complex model of the territory. In particular by taking
into account the concrete obstacles of the territory (subsoil congestion, mobility and traffic on
priority axes, trees, etc.), but also to integrate energy efficiency actions on buildings, in order
to obtain the most accurate picture possible.
These results and those that will be evaluated with the other scenarios will make it possible to
define a medium and long-term territorial strategy to meet the ambitious political objectives
that the City of Geneva has set itself. This will still require a lot of work.
Today we know how to carry it out and how to interpret the results provided by the toolbox
and we hope that this process can be replicated by other cities in Switzerland and Europe.
The examples presented are an illustration of the methodology that is being put in place in
order to achieve an exhaustive municipal planning at the beginning of 2021.
This strategy is only the first chapter of a long and beautiful adventure with Hotmaps.
51You can also read


