Daily Grain / Livestock Marketing Outlook 4/20/2021
←
→
Page content transcription
If your browser does not render page correctly, please read the page content below
Daily Grain / Livestock Marketing Outlook
                       Written by: Jim Gerlach
                              4/20/2021

Early Call 8:45am EDT: Corn up 5, soybeans up 24, wheat up 5. Early Tuesday, Dow
Jones futures are starting lower, in line with lower European markets, but are still near
its recent highs. June crude oil is trading higher after China reported higher import
volumes of oil in March, including an 8.8% increase from Saudi Arabia, reported
Reuters. The U.S. Dollar Index is slightly lower and most commodities are starting
higher. Grain prices are higher led by sharply higher soybeans and soybean oil
following sharp gains in Malaysian palm oil and continued poor weather in Brazil’s
safrinah crop areas.

Grains: Soybeans for May delivery rose 1.2% to $14.49 ¾ on the Chicago Board of
Trade Monday, with near-record highs in prices failing to derail strong demand for
exports. Corn for May delivery rose 1.1% to $5.92, while wheat for July delivery fell
0.2% to $6.53 ¾. Demand rationing isn't curbing consumption of U.S. soybeans,
meaning supply is expected to grow very thin as the year progresses. The tight supplies
in the U.S. continue and with the harvest winding down in Brazil, the demand for U.S.
soybeans is expected to remain strong which will continue to drain U.S. soybean
supplies. Product availability is setting up to be a real problem by mid-summer as the
U.S. runs low on beans to crush and strong commercial demand will ultimately keep
soybeans well supported and force soybean prices higher. South American weather was
a major source of support for both corn and soybean futures Monday. Monday’s biggest
weather concern is the 2021 Brazilian corn crop. The forecasts offer limited rain for the
next two weeks amid near to above-normal temperatures with highs holding in the 80's
to lower 90's. What happens to the Brazilian corn crop is of great importance to U.S.
farmers. Any loss of the 2021 Brazilian corn crop will be directed right to the U.S. with
nearly a 1:1 relationship in terms of what Brazil does not export from August into
January, the U.S. will. While Brazilian weather was a main factor for U.S. grains futures
Monday, U.S. weather also played a part. Dry conditions in the northern Plains have
helped Minneapolis wheat but there is a lot of corn planted up north too and that is
supportive for old and new crop. While problems exist with new crop, old crop will

                                                                                            1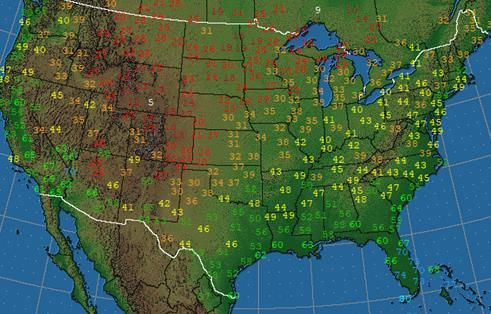
have to rally too as the market will need to price ration both crop years to make sure the
market has adequate stocks for the 2021-2022 marketing year. U.S. inspections of corn
set to be shipped to China was a main supporter for corn export inspection figures this
week. In its weekly report the USDA said export inspections of U.S. corn totaled
1.5mmt for the week ended April 15. China was again the leading destination for U.S.
corn for the week, with over 560,000mt of corn sent there.
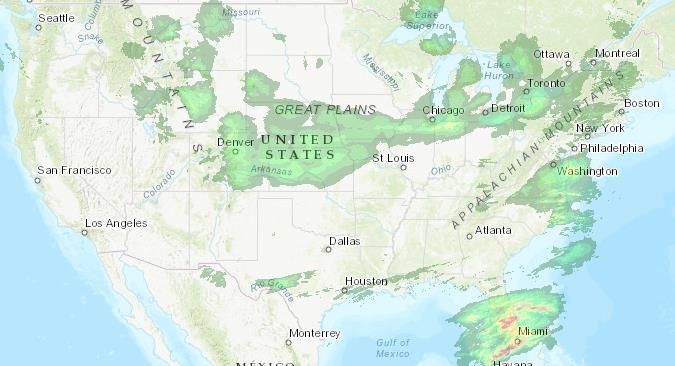
Rain/snow yesterday fell mostly in the central Plains and along the I-80 corridor (see
left map). Cold surged in the southern Plains overnight and again tonight, with an
estimated 10% of the crop in the southwest ¼ of the belt susceptible to damage. A
Midwest freeze the next 2 nights burns back SRW wheat growth, with localized losses
possible in the southern ¼ of the belt. Cold delays Midwest germination of
corn/soybeans, which likely limits freeze damage, with milder temps next week aiding
emergence in the southern 2/3rd of the belt. Rains become more active next week and
slow Midwest/Delta seedings, with the greatest delays expected in the southwest ¼ of
the Midwest (see 7-day NOAA forecast map upper right). Northern Plains showers
likely expand into ½ of the belt with a wetter risk in the 6-15 day period, aiding HRS
wheat germination. In Brazil, about ½ of the safrinah corn will remain in drought the
next 2 weeks (see map right), with drier
risk now in most model guidance with
patchy weekend showers. Isolated to
scattered 0.25” to 0.50” totals are forecast
for Paraná Sat-Sun with 0.25” to 1.00” in
Mato Grosso do Sul. The 00Z GEFS
model says 87% of safrinah corn in Brazil
will see under half normal rain the next
14 days, with 54% under one-fourth. 69%
and 36% of safrinha corn in Brazil had
under one-half and one-fourth its normal
rain 30 days. 45% and 5% were similarly
2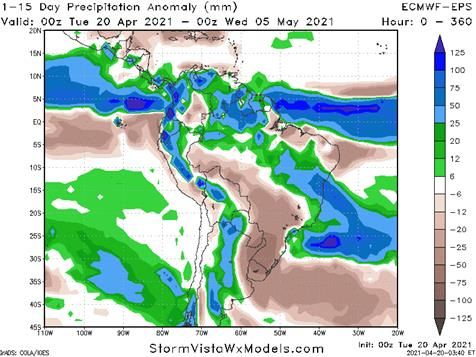
dry on the same growing day last year vs. 5% and 0% in 2019 and 12% and 0% 2018. In
Argentina, notable rains Wed-Fri stall harvest after the current, extended dry break
before turning dry again for over a week.

                                           Bitter cold damaged jointing wheat in
                                           western Kansas and jointing/booting
                                           wheat in western Texas and western
                                           Oklahoma overnight. Lows reached the
                                           lower 20’s in northwest Kansas, the mid
                                           20’s in the remainder of western Kansas,
                                           western Oklahoma, and northwest Texas.
                                           University studies show that jointing
                                           wheat can sustain severe damage when
                                           temps reach 24 degrees for more than 3
hours. The weekly NASS report showed that 17% of the northwest Kansas, 40% of
west-central Kansas and 71% of southwest Kansas wheat was jointing. 41% of the
Texas wheat crop was heading and extremely vulnerable. It is impossible to accurately
measure bushel losses until HRW wheat flowers so for now, the market will simply
speculate.

Despite the return of more winterlike weather across parts of the country, U.S. farmers
continued to plow ahead with corn and soybean planting last week, according to USDA
NASS' weekly Crop Progress report released Monday. As of Sunday, April 18, farmers
had planted an estimated 8% of intended corn acres. That was 2% ahead of last year's
6% and equal to the five-year average, according to NASS. Texas leads the way with
60% corn planted, Missouri is 14% planted, Illinois is at 12%, Indiana is at 7% and
Iowa is at 4% planted. Two percent of corn had emerged as of Sunday, above the five-
year average of 1% emerged for this time of year. In its first national soybean planting
report of the year, NASS estimated that 3% of the intended soybean crop had been

                                                                                           3
planted by week's end, slightly above 2% for both last year and the five-year average.
The three Southern states showing double-digit soybean planting progress were
Mississippi, Arkansas and Louisiana. Spring wheat planting was also running ahead of
normal, at 19% complete as of Sunday, well ahead of 7% at the same time last year and
12% for the five-year average. The state of Washington leads the way at 70% of spring
wheat planted, followed by Idaho and South Dakota, each at 46% planted. Development
of winter wheat, on the other hand, was running behind normal. Winter wheat heading
was estimated at 10% as of Sunday, behind 13% last year and 4% behind the five-year
average of 14%. For the third week in a row, winter wheat condition held steady at 53%
good to excellent, which is below last year's 57% good-to-excellent rating at the same
time. The week's highest good-to-excellent ratings for winter wheat were found in
California, Ohio and Michigan. Colorado, Texas and South Dakota had the lowest
ratings and are among the driest winter wheat states.

July corn is trading up early Tuesday as cash prices in the U.S. continue to find strong
demand throughout the country. The May contract is losing open interest as it
approaches delivery at the end of this month, but traded as high as $5.99 ¾ early
Tuesday, challenging the $6.00 mark again for the first time since 2013. Several cash
bids near $6.00 or higher are found in Iowa, Minnesota and South Dakota, areas not
normally known for strong basis this time of year. Late Monday, USDA said 8% of the
corn crop was planted and 2% of it has emerged, in line with the usual paces. Illinois is
12% planted and Iowa is at 4%. Obviously, even if weather cooperates, it is going to be
a while before new supplies come to the rescue of so many needing to buy corn now.
Tuesday morning's weather map showed precipitation falling from eastern Colorado to
northern Iowa. Temperatures are below freezing in eastern Colorado and western
Kansas, offering some threat to young crops of corn and wheat. The best rain chances
this week are in the southern Gulf states with light to moderate amounts expected in the
Eastern Corn Belt. The rest of the Corn Belt is mostly dry this week with better chances
for rain next week, especially on the eastern side. In Brazil, this week's rain forecast
remains light for southern Brazil and is a concern for the second corn crop. Technically,
the trends in July and December corn remain up with prices actively trading the high
ends of their ranges.

July soybeans are up sharply early Tuesday, punching into new high ground with cash
prices leading the way throughout the U.S. The May contract carries a roughly $.14
premium over the July with delivery coming the end of this month. It's not uncommon
to find cash prices bid above the futures board in Illinois and Indiana, but Tuesday's
morning bids are near or above even money as far west as western Iowa and
southwestern Minnesota, more signs of remarkable demand for soybeans. Late Monday,
USDA said 3% of the soybean crop was planted, slightly ahead of the five-year average

                                                                                        4
of 2% for this time of year. Illinois and Ohio are 5% planted and Indiana is at 4%. This
week's colder temperatures are not enticing for planting activity, but there is plenty of
time for conditions to improve. This year's concern is not so much about crops getting
planted, but finding enough moisture after they are planted, especially in the western
Midwest where conditions are expected to be drier. In Brazil, where China is currently
buying its soybeans, the FOB price for May is trading at $544/mt ($14.82/bu.), the
highest price since 2014. That is incredibly strong demand for soybeans at harvest time
and keeps expectations high that China will be back later this year for more U.S.
soybeans. Technically, the trends in both May and November soybeans are up with
prices actively pushing higher.
Apparently, USDA has some clairvoyant ability to know what the Chinese are thinking
after comments made last week. There’s a lot chatter about reluctance of USDA to hike
2020/21 U.S. corn exports by more than the 75mb increase given in the last WASDE
report. This was addressed to government officials at this past week's USDA data users
meeting, where a panel was asked about leaving its estimate of China's 2020/21 corn
imports at 24mmt despite export sales suggesting a higher figure. The fact remains that
some feel USDA is forecasting China to roll over about 6mmt or 240mb of corn bought
for this year for the 2021/22 marketing season. Given still very high corn prices in
China, the fact that they are consuming every other possible feed source including
wheat and rice and a deteriorating Brazilian corn crop outlook actually suggests greater
U.S. sales to the Chinese not only this year but for the 2021/22 season as well. Current
sales on the books are 2.629 billion bushels (bb), by far the highest amount ever by this
point in the season and a whopping 98.3% of the recently upwardly revised USDA
projection of 2.675 bb, also the highest ever exceeding the prior peak of 95.7% in the
2013/14 season and just looking the fact we are just 46mb from attaining the USDA
target with 20 weeks left in this marketing year one could argue for a far higher final
overseas sales figure. The problem is that current shipments to date are 1.487 bb which
appears to be the second highest figure ever as of mid-April next to the 1.575 bb seen in
the 2007/08 season. This however is only 55.6% of the current WASDE estimate, which
is actually below average. This means every week between now and the end of August
the U.S. will have to ship over 59mb to attain this target, which many see as difficult
given that so far this year we have only averaged 46.5mb per week. This may seem
high, but in 5 of the past 6 seasons this rate has been exceeded and with the U.S.
soybean export program ending, there should be plenty of fob capacity and vessel
availability to get all of this corn moved from our shores. I would also mention that the
last 8 weeks have seen weekly corn export shipments average near 75mb/week and with
Brazil’s safrinha crop in trouble and local prices over $7.35/bushel, I expect the Chinese
to buy more/ship more than what they currently have on the books from the U.S.
5On the demand front, palm oil prices rose 2.5% overnight following positive export
data. Data from two cargo surveyors showed that April 1-20 palm oil exports rose 10.2-
12.7% on month, easing concerns about lower demand from India amid a renewed wave
of Covid-19 infections in the country. On China's Dalian exchange, September corn was
down 0.2%, July soybeans were up 0.3%, September soybean meal was up 1.1% and
September soybean oil was down 0.1%. China’s weekly wheat reserve auction saw just
411,000mt sell vs. 4.02mmt offered, easily the lowest sale rate of 2021 so far. However,
China raised the minimum sale price this week in an effort to cool demand. They also
changed the rules by allowing only end users to buy wheat, banning various traders
from buying in the auction and reselling later on their own terms. Brazil will allow duty
free imports of corn, soy oil and soymeal without tax in a highly unusual effort to cool
domestic prices following their record large soybean harvest. The 0% tax from non-
Mercosur countries will last into the end of the year. Brazilian domestic corn values
reached record highs late Monday at $7.35 as the winter corn crop withers under a dire
drought. Inflationary feed price pressures are a threat to Brazil's livestock industry,
while soy oil imports are needed for biodiesel. Black Sea wheat export values ticked
higher last week, up $1-$3/mt in Russia and $5/mt in Ukraine. Ukrainian corn values
rose $3/mt last week as well. Big U.S. basis pushes have not secured cash
soybeans/corn, which makes the shorts nervous ahead of first notice day next week.
There were reports that some Midwest processors were bidding $.90 over July soybeans
for June and could not replace that day's crush. That type of cash bidding with limited
farm sales response has the shorts in May soybeans worried that end users may stand up
for deliverable supplies.
U.S. corn exports for the week ended 4/15/21 were 1.525mmt (60.0mb), down modestly
from the previous week's 1.728mmt (68.0mb), but still significantly larger than last
year's same-week exports of 731,000mt (28.8mb) and, most importantly, better than the
roughly 51.0mb/week we estimate is needed in order to reach the USDA's 2.675 billion
bushel export projection. While there have been ongoing talk/comments about the
slower than expected loading of corn to China, the fact remains U.S. corn exports have
averaged 74.5mb (1.9mmt)/week over the last eight weeks. This week's activity
included 560,000mt shipped to China, leaving their official unshipped purchases on the
books at roughly 13.1mmt and could be closer to 14.5mmt when taking into account
sales to unknown. Cumulative export inspections of 1.545 billion bushels are up 85%
from last year's 837mb with 19 full weeks remaining in the 2020/21 marketing year.
U.S. soybean exports last week of 184,000mt (6.8mb) were down from the previous
week's 337,000mt (12.4mb), were well below last year's 552,000mt (20.3mb) and were
easily a new marketing year low as soybean exports continue to seasonally decline.
However, last week's exports were the first to fall below the average needed pace of
roughly 8.3mb/week in order to reach the USDA's 2.280 billion bushel export
6projection. Cumulative export inspections of 2.021 billion bushels are up 68% from last
year's 1.207 billion.
Hogs: Cash hogs are called steady to somewhat higher. Packers weren't overly
aggressive in Monday's cash market but seeing that slaughter speeds are running
vigorously and that pork cutouts closed higher, packers may feel more confident about
this week's market as demand remains strong. USDA’s National Average Base Hog
price was $104.94 up by $.45. The CME Lean Hog Index was another $.21 higher on
4/15 to $103.24. Pork cutout futures ended the session $1.87 to $2.25 higher for the
front months. USDA’s National Pork Carcass Cutout Value was reported at $114.08, up
by $1.99 on good movement of 329 loads. CME’s Fresh Bacon Index was quoted at
246.25 for the week ending 4/16. That was down by $4.11 but remains at record highs
for the March/April time frame. Estimated packer margins were $7.80/head for non-
integrators and $100.48/head for integrators vs. $5.29 and $96.89 the previous day.
Monday’s kill was up 0.41% vs. last week, with no comparison to last year’s Covid
plant shutdown figure.
Hogs completely diverged from cattle Monday as triple-digit gains were seen in all
contracts through July 2022. The temporary liquidation phase ran its course with futures
regaining most of the losses of Friday. The market has a way to go to regain the losses
of last week, but the strength Tuesday certainly seems to indicate that this may take
place sooner rather than later. Higher cash and higher cutouts continue to unfold as
strong demand and tightening supply permeates the market. Lean hog futures will
maintain the use of expanded limits for the Tuesday session. Pork cutouts closed higher
and Monday's slaughter is estimated at a brisk pace, which are all positive, bullish signs
to the lean hog market. June lean hogs closed $2.62 higher at $104.32, July lean hogs
closed $2.27 higher at $101.97 and August lean hogs closed $2.40 higher at $98.55.
With last week's mixed trade, the lean hog contracts were able to rally boldly through
Monday's hours and not feel immediately pressured by longtime resistance levels. So
long as domestic consumer demand can continue to shine through the market, hog
prices stand a chance at continuing to trade steady. Pork cutouts total 328.56 loads with
299.19 loads of pork cuts and 29.36 loads of trim. Pork cutout values: up $1.99,
$114.08. Monday's hog slaughter is estimated at 490,000 head -- 2,000 head more than a
week ago and 125,000 head more than a year ago. The CME Lean Hog Index for April
15: up $0.21, $103.24.
Live cattle futures slowed their descent, but pressure from feeder cattle still pushed
them into negative territory for the eighth day. Futures washed out early but rebounded
substantially from the lows. This might signal that futures have fallen low enough to
catch the interest of traders to buy back into the market. After all, cash has remained
7strong with no indication of what this week may bring. Boxed beef prices have also
remained strong. Other than the downward attitude that filtrated its way through the live
cattle complex, there wasn't much else to note about Monday's trade. A lack of trader
interest sent the contracts trading lower, and the cash cattle market is yet to be tested as
it's too early in the week for interest to have developed. April live cattle closed $0.50
lower at $120.35, June live cattle closed $0.57 lower at $118.60 and August live cattle
closed $0.50 lower at $118.65. New show lists appear to be higher in Texas, and
Nebraska/Colorado and somewhat lower in Kansas. Monday's slaughter is estimated at
119,000 head, 7,000 head more than a week ago and 32,000 head more than a year ago.
Last week's negotiated cash cattle trade totaled 88,624 head. Of that 55% (48,568 head)
are committed for delivery in the next two weeks while the remaining 45% (40,056
head) are committed for delivery in the following 15 to 30 days. Boxed beef prices
closed higher, with choice up $0.12 ($276.17) and select up $0.03 ($269.13) with a
movement of 91 loads. Cash is called steady to $1.00 higher. Feedlots have their work
cut out for them this week, but higher trade isn't completely out of the question. As
feedlots step back and see corn prices rallying amid rallying boxed beef prices, feedlots
know there is more to be had than that packers are currently paying. The recent spike in
corn prices has really come as a hinderance to the feeder cattle contracts. With cost of
gains on everyone's mind, it's hard to stomach higher corn prices while fat cattle prices
continue to dance around $120.00 live. April feeders closed $1.90 lower at $137.72,
May feeders closed $1.25 lower at $142.47 and August feeders closed $1.77 lower at
$152.77.
When writing a rather large newsletter, I start on the next day’s information
immediately after posting the current day. I say that because I wrote the following
paragraph before yesterday’s sharp gains in hogs (as well as Joe Kerns article below) as
I made an argument for why the current peak in hogs in probably not a long-term top. A
report from the Chinese government that Q1 pork production was up 31.9% from last
year spooked traders last week. Combined with a marketing year low in weekly pork
sales, some traders are deducing this is the beginning of much less Chinese pork
imports. The market is still operating under the negative technical key reversal from
April 12th to boot. Managed money is also the longest they’ve been since Nov 2017.
While I agree that an interim top has been scored, I’m not sold on a major top being in
place because the market seems to be discounting the fact that 75% of total demand is
domestic and we’re likely to see a continued surge in demand as the U.S. economy
reopens with a lot of government stimulus and Covid-inspired savings/low credit card
debt in place. Over 40% of the U.S. population has at least one shot, with 25% fully
vaccinated and about 3% of the population being vaccinated every day now. Throw in
another 10% who’ve already had the disease and the fact that most of the shots given
have heavily weighted to the most vulnerable and it’s no wonder Sunday’s deaths have
8fallen to just 310 people. Regarding China, one week does not make a trend and the last
official month of March saw pork imports up 16.1% from last year. For the quarter,
China imported 1.16mmt or up 22% from last year’s first quarter. There are widespread
reports in the media of Chinese sow losses of 20% in northern/western areas (major
areas are in the south), but official Chinese ASF reports number just six over the last
year and pig prices are down 7.2% this month and 34.2% year to date. China also says
their sow herd grew 28% in 2020. I don’t pay a lot of attention to what China says, but
rather what they do and they’ve been buying global feed grains/soybeans like crazy,
suggesting their livestock herd is growing rapidly. Look for more back and fill action,
with new buying showing up on breaks.
Apparently, noted hog economist Joseph Kerns agrees with my thinking as well, as
noted in a report issued yesterday. Pork producers have enjoyed a wild ride from hog
futures trading in the mid-$70s during the throes of COVID to the recent peak of $110
in the June 2021 contract. This $35 move in futures represents a roughly $2 million
profitability swing for every 1,000 sows of production. Those are big economic impacts
and demonstrate the leveraged nature of pork economics and the role that changes in
the revenue side represents. Given this first wrinkle in an otherwise steadily firming
market, participants have got to be asking the question of whether this is the end of the
ride or just a temporary setback. It is my opinion that it is the latter, a reprieve in a bull
market that will ultimately look like a blip on the radar of a steadily up trending market.
Let’s unbundle this one a bit. First, we are not being overrun by supply. Our sub-2.5
million head per week harvest is not putting pressure on the cash or product market.
Our supply of market-ready animals will steadily move lower (perceived inventory
derived from the recent “Hogs and Pigs” report) from here, with available numbers
ebbing at under 2.4 million head per week by Memorial Day. We are at a time of the
year when the weekly harvest traditionally slows, which normally adds strength to the
cash market. This year is no different, and it may be even a bit more pronounced in the
decline if the number of open finishing barns and demand for wean/feeder pigs is any
indication. At any rate, this is not a bearish set up.
Second, packer interest for our commodity has not waned. Make no mistake – you are in
a commodity business and the nature of the live hog trade means that the tail (the
roughly 2% of the hogs that trade in the negotiated market) tend to wag the dog (the
other 98% of the volume). Cash prices have moved steadily higher throughout this
disruption period as the packing community continues to bid for the available supply.
This is good fundamental news that warrants noting. Third, there is no place to turn in
the event that the supply of the aforementioned supply of hogs comes in short. Cold
storage supplies of pork have been running roughly 25% lower than normal for almost
an entire year. There are limited frozen stocks to pull in the event of an online
9disruption. This lack of buffer stocks will keep the stimulus/response implications of any
uptick in demand in the pork market closely correlated to the hog market. More good
news. Domestic sales in the retail and food service sector have not only rebounded, they
are establishing new highs. Certainly, a portion of this is refilling the depleted pipeline,
but the majority is likely a combination of pent-up demand meeting new stimulus money.
Prior to the issuance of the most recent round of governmental distribution, a poll was
taken in an attempt to discern just how Americans planned on handling their new-found
pennies from heaven. The top category was savings, which seems rather like a rather
noble answer to me. The second category was food. I like that answer, too, as it fits our
interests and correlates with our other observational data that domestic demand for
pork remains robust. Make no mistake – the increase in prices we have experienced
recently are primarily driven by demand. I wrote extensively on this topic last month
and still firmly believe that our demand driven market is both more sustainable and has
stronger underpinnings than a temporary supply disruption. This is all good stuff.
A lot of us hold our breath each Thursday morning at 7:30 a.m. when the export sales
numbers are released. Exports kept us together last year and holding serve year-over-
year would feel like a win. I think we have a decent chance of doing just that. Our major
export destinations have jockeyed around compared to last year, with Mexico picking
up the slack from China and sales to the Philippines making up for weakness to other
Asian destinations. The net change in sales and commitments are not markedly different
than where we sat last year and that is an impressive accomplishment given today’s
substantially higher prices. I think the bottom line on price discovery is that numbers
and statistics need to be understood in context, not just as a headline-grabbing item.
For example, what if I told you that weekly harvest was going to be 50% higher this
year compared to the same week one year ago? That would sound pronounced and on
the edge of inflammatory until you considered the denominator in my example – the
reduced run rates of last year – was the true story line. We are on solid fundamental
ground in both the cash and the cutout market. Aberrations should be considered just
that until the current picture changes.
Weather: There is a trough moving down into the Eastern U.S. with a ridge in the
West. This ridge-west and trough-east pattern will continue through most of this week.
A cutoff low is escaping underneath the ridge in the West and will move across the
southern tier of the country late this week and weekend. Models suggest that the main
trough will retreat northward next week. This will maintain an active, but progressive
pattern for next week. The U.S. and European models are fairly similar. For the outlook
period, temperatures on Sunday will be above normal in the West and near to below
normal elsewhere. Temperatures will rise and fall through the end of the period as the
10pattern goes more progressive. A system will move into the West and then the Central
next week with widespread showers.
North American Weather Highlights: Temperatures below normal will continue through
the northern Plains next week. Though showers have started to move back into the
region, amounts have not been enough to reduce drought. A system next week shows
more potential for moderate showers, but it is a long way out. Scattered showers moved
through the central/southern Plains this weekend, bringing beneficial showers to the
entire region, but also well below normal temperatures. Hard freezes were recorded in
the western half of the Plains, which may have damaged wheat. Risks for hard freezes
continue through most of the week and may get into eastern areas as well, where corn
planting has been more advanced. A system will bring scattered rain and snow showers
through the Midwest early Wednesday, along with fairly chilly low temperatures for the
next several days. Some light frosts occurred in the northern half of the region this
weekend but will be more likely widespread this week behind the front. Hard freezes
may occur for much of the region, doing damage to winter wheat and emerged corn.
Scattered showers moved through the Delta this weekend but were light, allowing soils
to drain and producers to get into the fields. A front that moves through on Tuesday
night could produce frosts for northern areas Wednesday and Thursday, potentially
causing damage to wheat and emerged soybeans. Scattered showers moved through the
Southeast this weekend, but were more pronounced along the Gulf Coast, where more
flooding has been noted. The region will be relatively dry this week, allowing any wet
soils to drain and allow for more planting progress. A front brought scattered snow
showers to the Canadian Prairies region this weekend, being moderate in Alberta but
lighter elsewhere. The entire region continues to be in drought this spring. Another front
will move through Thursday and Friday with more moderate snow showers in Alberta
but less elsewhere. The cold continues through the week but could retreat northward
next week.
Global Weather Highlights: Scattered showers fell this weekend in Brazil as a front
moved slowly northward. This is very timely for safrinha corn, but amounts were
mostly less than one inch. The showers will dry up from south to north by the middle of
this week. Another front moves through this weekend, but showers do not look to be
very widespread or heavy. The end of the wet season appears to be starting for central
Brazil as fronts start to clear the majority of the country's growing regions. This will
overall stress safrinha corn that has been planted very late. Chances for showers may be
better for southern areas as fronts tend to linger a bit longer here. Mostly dry conditions
have been noted recently in Argentina, favorable for corn and soybean harvesting. A
front will move into the country on Wednesday and bring showers into the weekend
before moving northward. Widespread moderate to heavy showers are anticipated for
11most areas, bogging down harvest progress. Scattered showers moved through eastern
areas of Europe this weekend, continuing to produce mostly favorable conditions for
developing winter grains. Colder temperatures remained across the west and north, with
patchy frosts possibly causing some damage. Another cold front later this week could
produce more frosts and freezes for northern and eastern areas through the coming
weekend, as concern for damage continues for vulnerable plants. Across the south,
warmth and periods of showers should maintain favorable conditions for reproductive
winter grains. The cold across the north and east is likely to further delay spring
planting for corn and other crops. Scattered showers moved through the Black Sea
region this weekend and temperatures have been mild, allowing for more wheat to come
out of dormancy, but cool enough to keep growth slow. Soil moisture has been good in
the region due to above-normal winter and spring precipitation, but the region could use
some warmth for more progress. A cold shot may come this weekend into early next
week, mostly for Ukraine. Temperatures are not expected to be damaging right now, but
will need to be watched. Some scattered showers moved through northern New South
Wales and southern Queensland over the weekend, but most areas of Australia remained
dry, benefiting harvest activities for cotton and sorghum. Recent rainfall in the west and
east have filled soils ahead of winter wheat planting, which should be getting underway.
Very little shower activity this week will favor all fieldwork activities. Scattered
showers fell in northeastern China ahead of soybean and corn planting, which should be
starting up in the next couple of weeks. Conditions have been mostly favorable across
the country so far this spring, though it has been overly wet across the south for rice and
sugarcane. Periods of showers this week will maintain mostly favorable conditions.
Periods of showers have continued this spring have kept conditions favorable for much
of the winter crops in northwestern India as they move through reproduction. Scattered
showers have started to develop occasionally over the interior of India well in advance
of summer planting season for cotton and soybeans, which starts with the monsoon in
June.
Macros: The macro markets were mixed as of 8:30am EDT, with Dow futures down
0.5%, the U.S. dollar index is up 0.1%, crude oil is up 0.4% and gold is unchanged. The
S&P 500 on Monday closed 0.53% lower, the DJIA lost 0.36% while the Nasdaq 100
lost 0.96%. Bearish factors included concern that the resurgence of the pandemic will
slow the pace of the economic recovery after new global Covid infections for the week
ended April 19 rose the most for a week since the pandemic began, and higher T-note
yields after the 10-year T-note yield rose 1.9 bp to 1.599%. There are 79 of the S&P 500
companies that report earnings this week. Next week will see the peak with 180 of the
S&P 500 companies reporting. The following week will see reports from 136 of the
S&P 500 companies. Q2 earnings season is off to a good start so far. Of the 44 reporting
SPX companies, 84.1% have beaten the consensus, which is much better than the long-
12term average of 65.3% and the 4-quarter average of 75.5%, according to Refinitiv. SPX
earnings growth is expected to be very strong in Q1 at 30.9% and improve to 56.2% in
Q2, before easing to 20.9% in Q3 and 14.7% in Q4. On a calendar year basis, the
consensus is for strong 27.9% earnings growth in 2021, overcoming the 12.2% decline
seen in 2020. The U.S. stock market on Monday was undercut by weakness in tech
stocks as the Nasdaq 100 index fell 0.96%. The tech sector was dragged lower by a 7%
plunge in Peloton Interactive (PTON) after U.S. regulators on Saturday warned
consumers to stop using Peloton’s Tread+ exercise machine if there are young children
or pets at home due to injuries from the machine. Also, Tesla (TSLA) closed down more
than 3% Monday after a crash Saturday of a Tesla Model S in Texas killed two people,
with conflicting information about whether the auto-pilot was on. Stocks were also
undercut by a small 2 bp rise in the 10- year T-note yield to 1.60%.
The pandemic remains on a slow boil in the U.S. and is getting worse in some areas of
the world. While the outlook is better in the U.S. due to the fast vaccination pace, the
outlook in many other parts of the world is only getting worse. The world economy will
not be able to fully recover until all countries in the world are able to get the pandemic
under control. Globally, new global Covid infections for the week ended April 19 rose
12% to 5.2 million, the most for a week since the pandemic began, according to
reporting by Bloomberg. Globally, cumulative Covid infections have risen above
142.116 million, while cumulative deaths have exceeded 3.035 million. The situation is
currently the worst in India, where the 7-day average of new Covid cases has spiked
higher from only about 10,000 in late March to the current level of about 246,810,
according to Johns Hopkins. That means that nearly a quarter of a million people are
getting the virus every day in India. That is just below the record high of 251,057 posted
in the U.S. in January. There is a new "Indian variant" called B.1.617 that is associated
with higher infection rates and lower antibody resistance. That variant is showing up in
as many as half the samples taken in India, according to Bloomberg. The Indian variant
could be a factor behind the surge.
Other countries that are seeing a sharp upward trend in new Covid infections include
Germany, Poland, Ukraine, Turkey, Iraq, Pakistan, Brazil, Argentina, Colombia, and the
Philippines. The renewed spread of the virus in recent weeks is being attributed to less-
cautious behavior, reduced government restrictions, and the spread of more-
transmissible variants. Most countries do not yet have enough vaccinated people to slow
the new-infection rate. The pandemic in the U.S. is continuing at a high level, but at
least is not getting worse. The 7-day average of new U.S. Covid infections reached a 2-
month high of 71,343 last Tuesday before tailing off to 67,680 by Sunday. The ability of
the U.S. to dampen the pandemic is due in large part to a fast average daily vaccination
rate of 3.13 million doses over the past week, according to Bloomberg's Vaccine
13Tracker. The CDC reports that 25.7% of the U.S. population has been fully vaccinated
and that 39.9% of the population has received at least one dose. The CDC this week will
continue its review of the blood clot data and whether it will allow the Johnson &
Johnson vaccinations to resume. The resumption of the one-shot J&J vaccination would
go a long way to helping more people get vaccinated quickly and dampening the
infection rate.
Major global stock markets were mostly lower Tuesday after Wall Street retreated from
record highs. London and Frankfurt opened lower, while Shanghai and Tokyo also
declined. Hong Kong and Seoul advanced. Wall Street futures gained a day after the
benchmark S&P 500 index lost 0.5% on declines for tech, bank and energy stocks.
Investor optimism has been boosted by higher corporate profits, U.S. hiring and
consumer confidence. Still, traders are uneasy about a rise in inflation and interest rates
and renewed coronavirus infections that prompted some governments to reimpose anti-
disease controls. In early trading, the FTSE 100 in London declined 0.3% to 6,982.77
and the DAX in Frankfurt lost 0.2% to 15,335.68. The CAC 40 in Paris shed 0.6% to
6,256.90. On Wall Street, futures for the S&P 500 and the Dow Jones Industrial
Average were up less than 0.1%. On Monday, the Dow lost 0.4%. Both the S&P 500
and the Dow hit highs on Friday. In Asia, the Shanghai Composite Index lost 0.1% to
3,472.94 while the Nikkei 225 in Tokyo tumbled 2% to 29,100.38. The Hang Seng in
Hong Kong gained 0.1% to 29,135.73. The Kospi in Seoul rose 0.7% to 3,220.70 while
the S&P-ASX 200 in Sydney sank 0.7% to 7,017.80. India's Sensex was up less than
0.1% at 47,978.05. New Zealand, Singapore and Jakarta declined while Bangkok
advanced. In energy markets, benchmark U.S. crude rose 82 cents to $64.25 per barrel
in electronic trading on the New York Mercantile Exchange. Brent crude, used to price
international oils, gained 90 cents to $67.95 per barrel in London. The dollar advanced
to 108.40 yen from Monday's 108.11 yen. The euro gained to $1.2070 from $1.2039.
Summary: July corn finished up $.06 ¾ at a new closing high of $5.80 ½ Monday, near
its highest spot prices in seven years with support from a combination of weather
concerns and strong U.S. demand. Monday's weather map showed snow moving across
the central Midwest, changing to rain as it reaches northern Illinois. Colder temperatures
will expand into the Corn Belt this week and dampen enthusiasm for early planting.
Heavy rain amounts across the southern Gulf states will also likely hinder planting
efforts, while the Eastern Corn Belt expects to receive moderate precipitation amounts.
Otherwise, the forecast remains mostly dry for the northern and Western Corn Belt the
next ten days. Further south, central Brazil received beneficial rain over the weekend,
but the corn crop in southern Brazil remains in need of moisture and only light amounts
are in this week's forecast. In Argentina, the corn harvest will likely be interrupted this
week by heavy rain. Earlier Monday, USDA said 60.0mb of corn were inspected for
14export last week, ahead of the pace needed for the USDA's export estimate. China
accounted for 38% of the week's total. Fundamentally, corn prices and their strong basis
continue to suggest corn supplies are tighter than USDA estimates. From a technical
view, the trends remain up for July and December corn.
July soybeans were up $.14 at a new closing high of $14.36 ½ Monday, supported by a
$4.90 gain in July soybean meal, while July bean oil was down 0.37 cent. Bull
spreading in soybeans suggested domestic demand remains active for U.S. soybeans and
the national cash basis continues to trade at its strongest level in eight years. Earlier
Monday, USDA said 6.8mb of soybeans were inspected for export, a small amount that
is no threat to the bullish export total U.S. soybeans have already amassed. It is already
well understood that export business has shifted to Brazil, where the Wall Street Journal
and the private firm AgRural report 91% of the soybean crop has been harvested. It
remains an impressive sign of demand that July soybeans on China's Dalian exchange
were up 0.4% Monday and appear well supported at the equivalent of $17.51 a bushel,
even while making large purchases from Brazil. With U.S. soybean supplies historically
tight, there is no sign yet of any significant dent in world demand for soybeans. From a
technical view, the trends for July and November soybeans remain up. November
soybeans posted a new high close of $12.84.
July KC wheat ended up $.02 ½ at $6.18 ¾, receiving light bullish influence from corn
and soybeans, but also finding support from concerns of dry weather and a return of
cold temperatures. Snow is falling across Nebraska and western South Dakota Monday
with sub-freezing temperatures expected to reach the Texas Panhandle early Tuesday
morning. Winter wheat crops have seen worse this time of year, but there's always a
chance actual conditions could be harsher than forecast. Temperatures are expected to
turn more moderate by Friday. Meanwhile, the eastern edge of the southwestern Plains
is expecting moderate precipitation this week but crops on the western edge will stay
drier and that also goes for spring wheat in the northwestern Plains and western
Canadian Prairie. September Minneapolis wheat ended unchanged at $6.76 ½. Cold
temperatures remain a slight concern in northern Europe where patchy frosts have been
reported. Crop weather conditions are mostly favorable for winter wheat in Ukraine and
southern Russia, but a massive buildup of Russian troops on Ukraine's border raises
potential for trouble in the region. According to AP and the European Union's Foreign
Policy Chief Josep Borrell, Russia has 150,000 troops near the border, the largest
deployment on Ukraine's border to date. Technically, the trends are sideways for July
KC wheat, up for July Chicago wheat and up for September Minneapolis wheat.
A/C Trading Co. does not accept orders to buy or sell by e-mail, text or any other form of social media. This material has been
prepared by a sales or trading employee or agent of A/C Trading Co. and is, or is in the nature of, a solicitation. By accepting this
communication, you agree that you are an experienced user of the futures markets, capable of making independent trading decisions, and
agree that you are not, and will not, rely solely on this communication in making trading decisions. DISTRIBUTION IN SOME
15JURISDICTIONS MAY BE PROHIBITED OR RESTRICTED BY LAW. PERSONS IN POSSESSION OF THIS COMMUNICATION
INDIRECTLY SHOULD INFORM THEMSELVES ABOUT AND OBSERVE ANY SUCH PROHIBITION OR RESTRICTIONS. TO
THE EXTENT THAT YOU HAVE RECEIVED THIS COMMUNICATION INDIRECTLY AND SOLICITATIONS ARE
PROHIBITED IN YOUR JURISDICTION WITHOUT REGISTRATION, THE MARKET COMMENTARY IN THIS
COMMUNICATION SHOULD NOT BE CONSIDERED A SOLICITATION. The risk of loss in trading futures and/or options is
substantial and each investor and/or trader must consider whether this is a suitable investment. Past performance, whether actual or
indicated by simulated historical tests of strategies, is not indicative of future results. Trading advice is based on information taken from
trades and statistical services and other sources that A/C Trading Co. believes are reliable. We do not guarantee that such information is
accurate or complete and it should not be relied upon as such. Trading advice reflects our good faith judgment at a specific time and is
subject to change without notice. There is no guarantee that the advice we give will result in profitable trades.
16You can also read