Daily Precipitation Threshold for Rainstorm and Flood Disaster in the Mainland of China: An Economic Loss Perspective - MDPI
←
→
Page content transcription
If your browser does not render page correctly, please read the page content below
sustainability

Article
Daily Precipitation Threshold for Rainstorm and
Flood Disaster in the Mainland of China: An
Economic Loss Perspective
Wenhui Liu 1,2 , Jidong Wu 1,2, * , Rumei Tang 1,2 , Mengqi Ye 1,2 and Jing Yang 1,2
 1    Key Laboratory of Environmental Change and Natural Disaster, Ministry of Education, Beijing Normal
      University, Beijing 100875, China; lwhtay1996@163.com (W.L.); trm1022@163.com (R.T.);
      ye_ymq@163.com (M.Y.); yangjing@bnu.edu.cn (J.Y.)
 2    Faculty of Geographical Science, Beijing Normal University, Beijing 100875, China
 *    Correspondence: wujidong@bnu.edu.cn; Tel.: +86-10-5880-4647

 Received: 11 October 2019; Accepted: 1 January 2020; Published: 4 January 2020

 Abstract: Exploring precipitation threshold from an economic loss perspective is critical for rainstorm
 and flood disaster risk assessment under climate change. Based on the daily gridded precipitation
 dataset and direct economic losses (DELs) of rainstorm and flood disasters in the mainland of China,
 this paper first filtered a relatively reasonable disaster-triggering daily precipitation threshold (DDPT)
 combination according to the relationship between extreme precipitation days and direct economic
 loss (DEL) rates at province level and then comprehensively analyzed the spatial landscape of DDPT
 across China. The results show that (1) the daily precipitation determined by the combination of a
 10 mm fixed threshold and 99.3th percentile is recognized as the optimal DDPT of rainstorm and
 flood disasters, and the correlation coefficient between annual extreme precipitation days and DEL
 rates reached 0.45 (p < 0.01). (2) The optimal DDPT decreases from southeast (up to 87 mm) to
 northwest (10 mm) across China, and the DDPTs of 7 out of 31 provinces are lower than 25 mm,
 while 5 provinces are higher than 50 mm on average. These results suggest that DDPTs exist with
 large spatial heterogeneity across China, and adopting regional differentiated DDPT is helpful for
 conducting effective disaster risk analysis.

 Keywords: rainstorm and flood disasters; disaster-triggering daily precipitation threshold; extreme
 precipitation; direct economic losses; China

1. Introduction
     To effectively predict future flood risk, more and more research has explored the impacts of
hydro-climatic extremes on human and economy [1–4], especially in combination with asset exposure
and vulnerability [5–7]. In China, many researches have reported that the change trend of total
precipitation is not obvious, but the intensity and frequency of extreme precipitation have increased
significantly with climate changes [8–11]. Because of obvious regional differences in precipitation and
economy, China is particularly vulnerable to the impact of extreme precipitation [3,12,13]. For example,
according to statistics from the international disaster database (https://www.emdat.be/), the hydrological
disaster losses of China reached $18.9 billion in 2010, which was two-fifths of the global total. Therefore,
reasonable assessment of the intensity and frequency of extreme precipitation is critical for improving
our ability to predict rainstorm and flood disaster risk in the future.
     Extreme precipitation events are defined as events that exceed the threshold of extreme precipitation
and have a significant impact on human society [14]. The basis and key to assess the intensity and
frequency of extreme precipitation is to determine the disaster-triggering daily precipitation threshold

Sustainability 2020, 12, 407; doi:10.3390/su12010407                       www.mdpi.com/journal/sustainability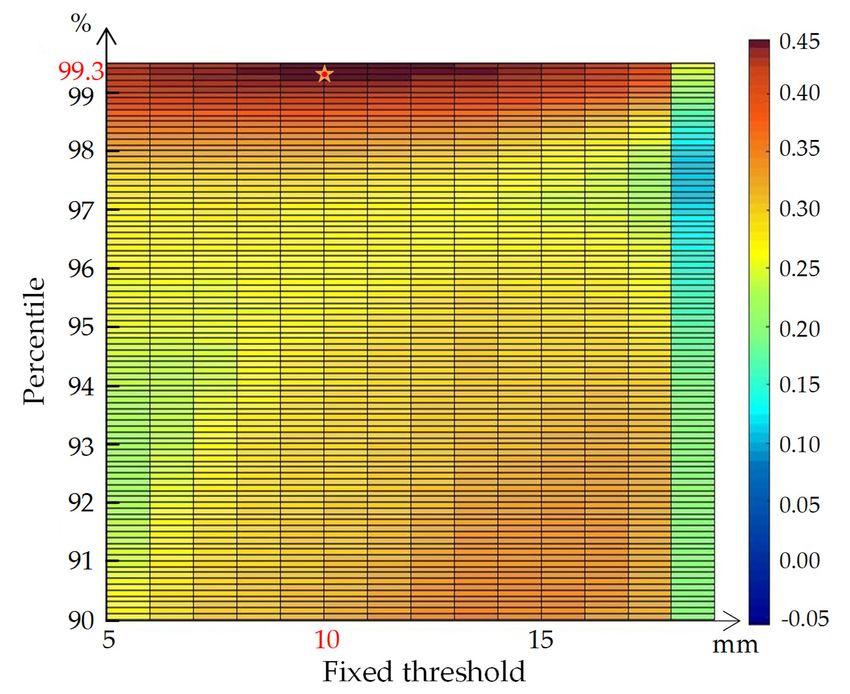
Sustainability 2020, 12, 407                                                                         2 of 14

(DDPT) [15]. Currently, there is no uniform threshold standard for the determination of extreme
precipitation events [16]. There are various methods for determining the extreme precipitation globally,
including fixed threshold method, parametric method, non-parametric method, and detrended
fluctuation analysis method [14–18]. The fixed threshold method uses an absolute daily precipitation
intensity as the critical value of the region [14]. For example, precipitation exceeding 50 mm over 24 h
is usually defined as extreme precipitation in China [16,19]. This method is suitable for small-scale
areas and has strong subjectivity and experience [20–22].
      The most commonly used nonparametric method is the percentile method, which ranks the
amount of precipitation over a certain period of time and selects a certain percentile daily precipitation
value as the extreme precipitation criterion for the region [23]. The percentiles selected varied from
study to study. Zhai et al. [24] considered the 95th percentile of all rain days during 1961–1990 as the
criterion for judging extreme precipitation events. Beniston et al. [25] and Pielke et al. [2] regarded 90th
percentile of the observed precipitation data as a standard of extreme precipitation events. This method
is suitable for the definition and comparison of extreme precipitation events in different regions [26,27].
Parametric methods include probabilistic analysis [28], the peak over threshold (POT) method [16], the
generalized extreme value distribution (GEV) method [29]. These parametric methods depend on the
size of the data series and the probability distribution, which could greatly affect the results [22].
      As a key criterion used to define the intensity of disaster-triggering factors, the DDPT is closely
related to the occurrence of disasters [16]. Precipitation above the DDPT is likely to have a negative
impact on social and economic development [14]. From the perspective of the rainstorm and flood
disasters occurrence mechanism [30], the methods determine the extreme precipitation threshold
only by statistical characteristics of precipitation that is separate from whether extreme precipitation
causes negative economic and social influences, which could mislead rainstorm and flood disaster risk
assessment because it ignores the vulnerability factors of human and economy in determining a disaster.
Therefore, the determination of the DDPT should combine the economic losses caused by precipitation
and comprehensively consider the relationships among hazard, exposure of socioeconomics, and
disaster losses. In this way, we could determine the optimal DDPT that is most likely to cause disaster
loss from a practical point of view, namely, the threshold of disaster-triggering precipitation, i.e., the
DDPT. In addition, the current research on the DDPT in China mainly focuses on a small-scale range of
regions and basins [31–37].
      To improve these imperfections, there are two main aims of this study: (1) To explore the
disaster-triggering threshold of extreme precipitation in the mainland of China from an economic loss
perspective, and (2) to comprehensively analyze the spatial landscape and statistical characteristics
of the DDPT across China at regional and provincial scales (see Figure 1). Therefore, based on the
daily gridded observational precipitation dataset (1961–2012) and rainstorm and flood disaster direct
economic losses (DELs) (2004–2012) in the mainland of China, this study established a large number of
threshold combinations by combining the fixed threshold method and percentile method, which are
commonly used to determine the disaster-triggering precipitation threshold value. Then, we extracted
the corresponding rainstorm and flood hazard areas and further explored the correlation between
extreme precipitation days and DEL rates in different combinations to determine a more reasonable
DDPT across China. The optimal DDPT based on the disaster mechanism (hazard, exposure) helps
provide a basis for risk assessment and management of rainstorm and flood disasters.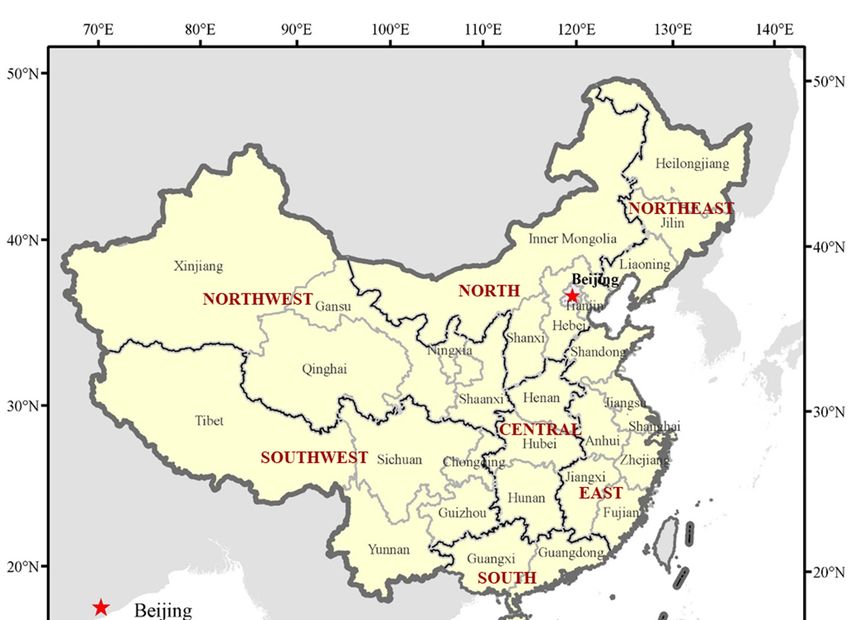
Sustainability 2020, 12, 407                                                                                       3 of 14
Sustainability 2020, 12, x FOR PEER REVIEW                                                                        3 of 13

               Figure 1.
               Figure    Seven geographical
                      1. Seven geographical divisions
                                            divisions and
                                                      and 31
                                                          31 provinces
                                                             provinces in
                                                                       in the
                                                                          the mainland
                                                                              mainland of
                                                                                       of China.
                                                                                          China.
2. Data and Methods
2. Data and Methods
2.1. Data Sources
2.1. Data Sources
     Four main datasets were used to analyze the disaster-triggering precipitation threshold of
     Four and
rainstorm   mainflooddatasets   were
                         disasters      used
                                     (see      to 1).
                                           Table   analyze    theinterpolated
                                                      First, an    disaster-triggering     precipitation precipitation
                                                                                gridded observational      threshold of
rainstorm
dataset     and flood
        (CN05.1)     fromdisasters
                            1961 to(see
                                      2012Table
                                            was 1).   First, anby
                                                  generated     interpolated
                                                                    Wu and Gao  gridded    observational
                                                                                   [38] based              precipitation
                                                                                                on 2400 observational
dataset (CN05.1)     from   1961   to 2012  was   generated    by   Wu   and  Gao  [38]  based  on  2400
stations in China. This dataset indicates similar rainfall frequency distributions as that of the station observational
stations[19]
dataset  in China.
              and has This  dataset
                         been   widely indicates
                                         used insimilar    rainfallchange
                                                    precipitation     frequency   distributions
                                                                             studies   over China as[39,40].
                                                                                                      that of This
                                                                                                               the station
                                                                                                                     study
dataset [19]   and  has  been   widely   used   in  precipitation   change   studies   over  China
considers a daily precipitation value greater than or equal to 0.1 mm as an effective precipitation  [39,40]. This   study
considers
value       a daily precipitation value greater than or equal to 0.1 mm as an effective precipitation
      [41,42].
valueSecond,
      [41,42].the annual provincial DELs of rainstorm and flood disasters in the mainland of China
wereSecond,
      obtained  thefrom
                     annual   provincial
                          China’s           DELsofofMeteorological
                                     Yearbook          rainstorm and Disasters
                                                                          flood disasters
                                                                                     [43]. in  the caused
                                                                                            DELs    mainland byoflandfall
                                                                                                                    China
were  obtained     from   China’s     Yearbook     of Meteorological      Disasters   [43]. DELs
typhoons were also included. These data were used to compute the DEL rate of rainstorm and flood    caused    by  landfall
typhoonsas
disasters  were    also included.
              vulnerability           These[44].
                               indicators     data were used to compute the DEL rate of rainstorm and flood
disasters as  vulnerability    indicators    [44].
     Third, the asset value map of China in 2015 is 30 arc-second resolution and offers a quick and
     Third,
accurate      the asset value
          assessment              map ofexposure
                          of economic       China in [44–46].
                                                        2015 is 30   arc-second
                                                                  This  map wasresolution      and offers
                                                                                   used to evaluate     theaasset
                                                                                                                quickvalue
                                                                                                                       and
accurate assessment
exposure  in rainstormofand  economic     exposure
                                 flood hazard     areas[44–46].
                                                         [44,47].This map was used to evaluate the asset value
exposure
     Finally, the consumer price index (CPI) [44,47].
           in  rainstorm   and   flood   hazard   areas   and price indices of investment in fixed assets were
     Finally, used
respectively    the consumer      price
                      to adjust the   DELsindex
                                              and(CPI)
                                                   asset and   price
                                                          values       indices
                                                                   to the  priceof  investment
                                                                                 level            in fixed assets were
                                                                                        of 2012 [47,48].
respectively used to adjust the DELs and asset values to the price level of 2012 [47,48].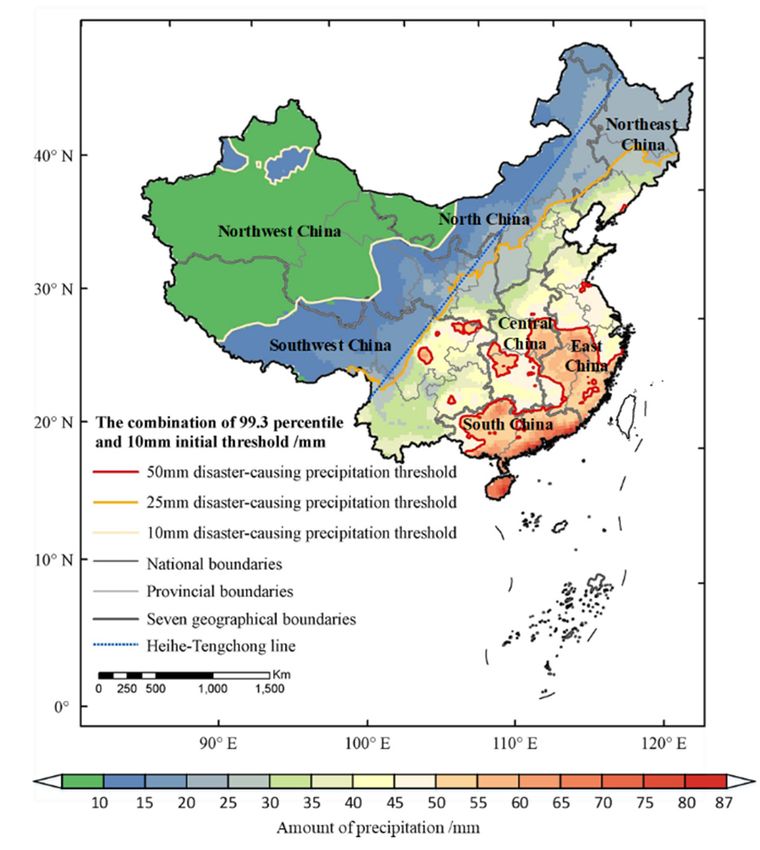
Sustainability 2020, 12, 407 4 of 14
Sustainability 2020, 12, x FOR PEER REVIEW
Table 1. Data sources and description. 4 of 13
Data Name Resolution
Table 1. Time Periods
Data sources and description. Source
Gridded observational
◦ × 0.25◦ , daily Time
Data
precipitation Nameof China
dataset Resolution
0.25 1961–2012 Source
Wu and Gao [38]
Periods
(CN05.1)
Gridded observational
Direct economic losses of 0.25° × 0.25°,
precipitation dataset of China Provincial 1961–2012
level of China 2004–2012 WuChina Meteorological
and Gao [38]
rainstorm and flood disasters daily Administration (CMA) [43]
(CN05.1)
Asset value
Direct map oflosses
economic Chinaof 30 arc second
Provincial level 2015 Wu et
China Meteorological al. [44]
Administration
2004–2012
rainstorm and flood disasters of China (CMA) [43]
National Bureau of
Asset value price
Consumer map of China
index 30 arc second
Provincial level of China2015 2004–2012 Wu et al. of
Statistics [44]
China (NBSC,
Provincial level National Bureauwww.stats.gov.cn)
of Statistics of China
Consumer price index 2004–2012
Price indices of investment in of China (NBSC, www.stats.gov.cn)
Price indices China 2004–2012 NBSC
fixed of investment in
assets China 2004–2012 NBSC
fixed assets
2.2. Methods
2.2. Methods
To more reasonably determine the DDPT in China, this study divided the methodology into four
To more reasonably determine the DDPT in China, this study divided the methodology into four
parts (see Figure 2). First, we combined the percentile method with a fixed threshold method to build a
parts (see Figure 2). First, we combined the percentile method with a fixed threshold method to build
series of alternative DDPT value of daily extreme precipitation. Then we extracted the rainstorm and
a series of alternative DDPT value of daily extreme precipitation. Then we extracted the rainstorm
flood hazard areas for each DDPT value. Third, we calculated the annual provincial rainstorm and
and flood hazard areas for each DDPT value. Third, we calculated the annual provincial rainstorm
flood extreme precipitation index and annual provincial DEL rate of different DDPT combinations.
and flood extreme precipitation index and annual provincial DEL rate of different DDPT
Finally, we screened DDPT value combinations and selected the most reasonable one by calculating
combinations. Finally, we screened DDPT value combinations and selected the most reasonable one
the correlation between the extreme precipitation index and DEL rate.
by calculating the correlation between the extreme precipitation index and DEL rate.
Percentile method
Precipitation dataset Alternative DDPT value Max
(CN05.1) construction
Fixed threshold method
Rainstorm and flood hazard
areas extraction
Correlation analysis
Extreme Direct economic losses
Direct economic
precipitation
loss rate
days Asset values
The optimal DDPT combination
Figure
Figure 2.2.The optimal disaster-triggering
The optimal daily precipitation
disaster-triggering threshold (DDPT)
daily precipitation value(DDPT)
threshold determination
value
framework.
determination framework.
Alternative DDPT
2.2.1. Alternative DDPT Value
Value Construction
The percentile method is widely used in determining the extreme precipitation threshold
globally [23],
[23], and
and90%,
90%,95%,
95%,99%
99% areare
common
common percentiles [2,23–25].
percentiles ThisThis
[2,23–25]. study first selected
study 90.0–99.9%
first selected 90.0–
(0.1% intervals)
99.9% as the as
(0.1% intervals) selection rangerange
the selection of DDPT. After After
of DDPT. checking the observed
checking dailydaily
the observed precipitation data
precipitation
in theinextremely
data dry area
the extremely dryofarea
the northwestern China, the
of the northwestern DDPT
China, thevalue
DDPT determined by the percentile
value determined by the
method was
percentile lowerwas
method thanlower
5 mm, which
than 5 mm,is not consistent
which with the fact
is not consistent withthat
thethe
factDDPT in the
that the recorded
DDPT in the
disaster event
recorded for event
disaster this area
for should
this areabeshould
higherbethan 5 mm
higher [32–34].
than 5 mmAs such, As
[32–34]. wesuch,
furtherweselected
further 5selected
mm as
5themm
minimum
as the extreme
minimum precipitation threshold value
extreme precipitation and gradually
threshold value and increased (1 mm
gradually intervals)
increased it to
(1 mm
intervals) it to determine a DDPT value. That is, both the percentile method and the fixed threshold
method are used to constitute a threshold combination. Finally, for each threshold combination, an
alternative DDPT value can be determined by taking the maximum of both.
Sustainability 2020, 12, 407                                                                        5 of 14

determine a DDPT value. That is, both the percentile method and the fixed threshold method are used
to constitute a threshold combination. Finally, for each threshold combination, an alternative DDPT
value can be determined by taking the maximum of both.

2.2.2. Rainstorm and Flood Hazard Area Extraction
     How to effectively determine the rainstorm and flood hazard areas is the key to calculating the
asset value exposure. First, for each day, based on each alternative DDPT value and the CN05.1 dataset,
the grids with precipitation values equal to or greater than this DDPT value can be extracted, which
is defined as the daily rainstorm and flood hazard area. Second, for each year, the affected extent
that may experience damage from rainstorm and flood disasters can be acquired from merging daily
rainstorm and flood hazard areas. Moreover, for each grid, the extreme precipitation days, which are
defined as the days with daily precipitation that is equal to or greater than the precipitation threshold,
can be calculated based on the extracted rainstorm and flood hazard areas.

2.2.3. Optimal DDPT Selection
      The optimal DDPT is selected based on the correlativity between the annual extreme precipitation
days and annual DEL rates at the province level.
      First, considering the incomparability of absolute thresholds between different provinces, this
study used the number of annual extreme precipitation days (d) to characterize the magnitude of the
disaster-triggering precipitation at the provincial level. Province-level annual extreme precipitation
days are defined as the average annual extreme precipitation days within the merged daily rainstorm
and flood hazard areas.
      Second, the accumulated asset value located in the yearly rainstorm and flood hazard areas is
defined as the economic exposure to annual rainstorm and flood disasters, and the province-level
DEL rate is calculated by the DELs caused by rainstorm and flood disasters divided by the economic
exposure in the same year. To estimate the province-level annual economic exposure, this study
generates gridded annual asset value maps in the periods of 2004–2012 by employing an average
annual growth rate of the asset value [48], which is 14%, based on the asset value map of China in
2015 [44]. We aggregated asset value maps (30” × 30”) into the same spatial resolution of CN05.1 as
rainstorm and flood hazard areas (0.25◦ × 0.25◦ ). Then, we overlaid the rainstorm and flood hazard
areas on the asset value maps to extract the exposed asset values for each year. Considering inflation,
we adjusted DELs and asset value to the price level of 2012 using CPI and price indices of investments
in fixed assets, respectively [46,47].
      Third, based on the hazard frequency (i.e., extreme precipitation days) and vulnerability (i.e., DEL
rate) of rainstorm and flood disasters by province and by year, the optimal DDPT can be determined
when the highest correlation coefficient exist between the extreme precipitation days and DEL rates.
      Finally, based on the determined optimal DDPT, the spatial distribution of the DDPT value were
described at the regional and provincial levels.

3. Results

3.1. The Correlation between Extreme Precipitation Days and DEL Rates
     As shown in Figure 3, the correlation between extreme precipitation days and DEL rates of
rainstorm and flood disasters changed significantly with the change in the combination of percentile
and fixed precipitation threshold value at the provincial level in China. Note that rainstorm and flood
hazard areas are zero in some years in individual provinces, if the percentile is over 99.5% or the
fixed precipitation threshold is equal to or greater than 20 mm, which is not consistent with the actual
disaster damage records in the period of 2004–2012.
Sustainability 2020, 12, x FOR PEER REVIEW 6 of 13
0.45 (n = 279, p < 0.01) at the 10 mm initial daily precipitation threshold. Therefore, the combination
of the 99.3th
Sustainability percentile
2020, 12, 407 and 10 mm initial daily precipitation threshold was selected as the most
6 of 14
optimal threshold combination for rainstorm and flood disasters.
Figure 3.
Figure The correlation
3. The correlation coefficient (n ==279)
coefficient (n 279) between
between the
the extreme
extreme precipitation
precipitation days
days and
and the
the direct
direct
economic losses
economic losses (DEL)
(DEL) rates
rates of
of rainstorm
rainstorm and
and flood
flood disasters
disasters under
under different
different daily
daily precipitation
precipitation
threshold combinations
threshold combinations atat the
the provincial
provincial level
level in
in the
the period
period of
of 2004–2012
2004–2012 in
in China.
China.
When Relationship
3.2. Annual the initial fixed precipitation
between threshold value
Extreme Precipitation Daysisand
constant,
DEL Rates as the percentilebyvalue
Determined increases,
Rainstorm and
the correlation coefficient between
Flood Hazard Area under the Optimal DDPT annual extreme precipitation days (D) and DEL rates first decreases
and then increases, and the maximum value is 99.3% when the initial absolute daily precipitation
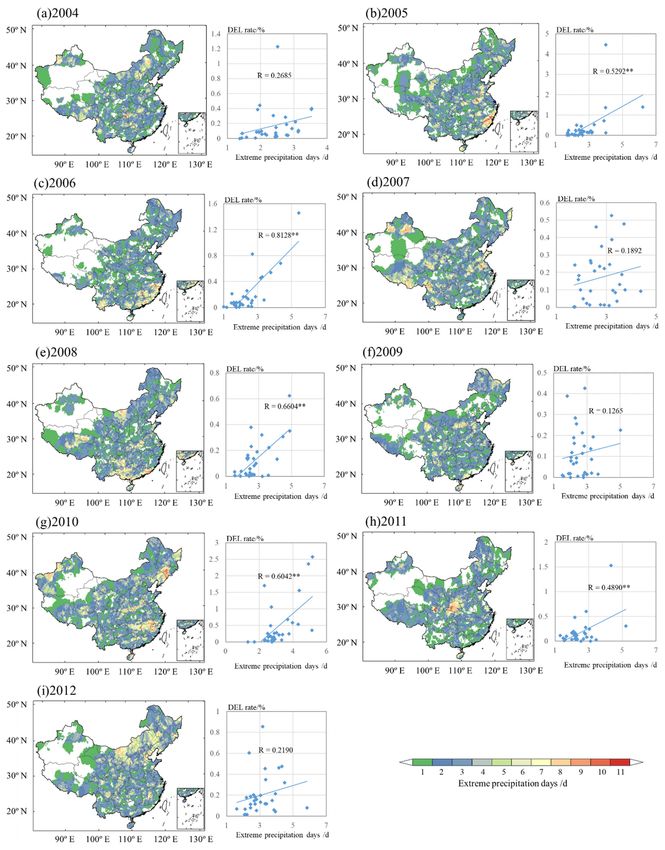
To verify
threshold the validity
changes from 5 mm of theto optimal
19 mm by DDPTa 1-mmin determining
interval. When the relationship
the percentilebetween
value is extreme
99.3%,
precipitation
with the increasedays inand DEL
the rates,
initial we further
daily show this
precipitation relationship
threshold value,for theeach year. Ascoefficient
correlation can be seenfirst
in
Figure 4, the spatial distribution of rainstorm and flood hazard areas and
increases and then decreases sharply, and the maximum correlation coefficient value is about 0.45 of extreme precipitation
days varypbetween
(n = 279, < 0.01) at years
the 10(seemm Figure 4).daily
initial The extreme precipitation
precipitation threshold. center determined
Therefore, by the optimal
the combination of
DDPT could be in coastal Southeast China (see Figure 4b,c,e,f), in the inland
the 99.3th percentile and 10 mm initial daily precipitation threshold was selected as the most optimal area of South China
region
threshold(seecombination
Figure 4g), forin the northern
rainstorm and part of North
flood disasters.China (see Figure 4a,e,i), and in the center of
Southwest China (see Figure 4h).
3.2. Annual
Moreover,Relationship between Extreme
the relationship between Precipitation
the extreme Days precipitation
and DEL Ratesdays Determined
and DELby Rainstorm and
rates varies
Flood Hazard
between Area
years, butunder
the the
DEL Optimal DDPT with extreme precipitation days at the province level.
rates increases
Among To the 9 years
verify from 2004
the validity oftothe
2012, the DEL
optimal DDPT ratesinincreased significantly
determining (p < 0.01)between
the relationship with the number
extreme
of average extreme precipitation days for the five years (see Figure 4b,c,e,g,h),
precipitation days and DEL rates, we further show this relationship for each year. As can be seen especially when the
correlation coefficient of 2006 reached 0.8128 (n = 31, p < 0.01) (Figure 4c). In the
in Figure 4, the spatial distribution of rainstorm and flood hazard areas and of extreme precipitation other years, the DEL
rates
days increased
vary betweennon-significantly
years (see Figure with4).theThe
number
extreme of extreme precipitation
precipitation average days
center determined (seeoptimal
by the Figure
4a,d,f,i). In general, there is a positive correlation between the annual DEL rates
DDPT could be in coastal Southeast China (see Figure 4b,c,e,f), in the inland area of South China region and the number of
annual extreme precipitation days, although this positive correlation is not significant
(see Figure 4g), in the northern part of North China (see Figure 4a,e,i), and in the center of Southwest in some years.
China (see Figure 4h).
Moreover, the relationship between the extreme precipitation days and DEL rates varies between
years, but the DEL rates increases with extreme precipitation days at the province level. Among the 9
years from 2004 to 2012, the DEL rates increased significantly (p < 0.01) with the number of average
extreme precipitation days for the five years (see Figure 4b,c,e,g,h), especially when the correlation
coefficient of 2006 reached 0.8128 (n = 31, p < 0.01) (Figure 4c). In the other years, the DEL rates
increased non-significantly with the number of extreme precipitation average days (see Figure 4a,d,f,i).Sustainability 2020, 12, 407 7 of 14
In general, there is a positive correlation between the annual DEL rates and the number of annual
extreme precipitation days, although this positive correlation is not significant in some years. 7 of 13
Sustainability 2020, 12, x FOR PEER REVIEW
4. The annual correlation (** significant
Figure 4. significant at
at the
the 0.01
0.01 level.)
level.) between the extreme
extreme precipitation
precipitation
days and the DEL rates of rainstorm and flood disasters at the province level from 2004 to 2012 (a–i)
under
under the
the optimal
optimalDDPT
DDPTininthe
themainland
mainlandofofChina.
China. For each
For each year, extreme
year, precipitation
extreme days
precipitation equal
days the
equal
sum of extreme
the sum precipitation
of extreme days
precipitation of of
days grids divided
grids divided bybythe
thetotal
totalnumber
numberofofgrids
gridswithin
within the
the merged
merged
daily
daily rainstorm
rainstorm and
and flood
flood hazard
hazard areas
areas within
within aa province.
province.
3.3. Spatial Distribution of Disaster-Triggering Daily Precipitation Threshold
The spatial distribution of DDPTs across China is shown in Figure 5a. The DDPTs show a
decreasing distribution from the southeastern coast to the northwestern inland of China, and the
boundary of the adjacent threshold is clear, showing a trend from northeast to southwest. The
maximum DDPT value is distributed in the coastal southern China region, at approximately 87 mm,
and the northwestern inland region has the minimum DDPT value, which is 10 mm. Note that mostlight rain or moderate rain, according to the precipitation intensity classification in China [16], and
approximately one-quarter of the country meets the threshold for large rain. Only 8.3% of the
country’s DDPT exceeds 50 mm, reaching the level of heavy rain. Moreover, the Heihe-Tengchong
line, which roughly coincides with the 400 mm annual precipitation contour and is also regarded as
Sustainability 2020, 12, 407 8 of 14
the dividing line between economically developed areas (east of the line) and underdeveloped areas
(west of the line) in the mainland of China [49,50], is approximately located near the contour line of
the
3.3.25-mm
SpatialDDPT.
Distribution of Disaster-Triggering Daily Precipitation Threshold
At the geographical regional level, Figure 5b shows the DDPT frequency distribution of 7
The spatial
geographical distribution
divisions, of DDPTs
and each regionacross
has aChina
uniqueis shown in Figure
statistical 5a. TheofDDPTs
characteristic show a
its threshold
decreasing distribution from the southeastern coast to the northwestern
distribution. The average DDPTs of South China, East China, Central China, Northeast China, inland of China, and the
boundary of
Southwest the adjacent
China, threshold
North China, andisNorthwest
clear, showing a trend
China from
are 57 mm,northeast
48 mm,to45southwest.
mm, 24 mm, The21
maximum
mm, 18
DDPT value is distributed in the coastal southern China region, at approximately
mm, and 12 mm, respectively, and the value in South China is 4.75 times that of the value 87 mm, and the
in
northwestern inland region has the minimum DDPT value, which is 10 mm. Note that
Northwest China. In addition, in terms of the coefficient of variation (CV) and regional uniformity, most threshold
values
the mean of northwestern
DDPT distribution inlandofChina
Southare less than
China, East20China,
mm, that
andis,Central
the fixed precipitation
China threshold
is relatively has
uniform,
an influence on the northwestern inland region, and
while that in Northwest and Southwest China is relatively discrete.the percentile method works elsewhere.
(a) (b)
Figure
Figure 5.5. Spatial
Spatialdistribution
distributionofofthe
theDDPT
DDPT(a)
(a)and
andits
itsprecipitation
precipitationintensity
intensityfrequency
frequencyinin seven
seven
geographic regions of China (b).
geographic regions of China (b).
From 2.
Table theThe
perspective of the
precipitation spatialclassification
intensity DDPT contour (see Figure
in China 5a, Table
[16] and 2), approximately
the corresponding area 66%
of the DDPTs in
distribution the mainland
percentage of China
of different levelsare less than 25 mm; that is, the DDPTs in these areas are
of DDPTs.
only light rain or moderate rain, according to the precipitation intensity classification in China [16],
Grade of Daily Daily Precipitation Area Distribution Percentage of Daily Precipitation
and approximately
Precipitation one-quarter of the country meets the threshold
(mm) for large
Threshold rain. Only 8.3% of the
in China
country’s DDPT
Light rain exceeds 50 mm, reachingSustainability 2020, 12, 407 9 of 14
Table 2. The precipitation intensity classification in China [16] and the corresponding area distribution
percentage of different levels of DDPTs.
Area Distribution Percentage of Daily
Grade of Daily Precipitation Daily Precipitation (mm)
Precipitation Threshold in China
Light rain 50 mm Fujian 54 48 70 54 54 6
Guangdong 61 47 87 53 61 16
Hainan 71 65 81 67 71 6Sustainability 2020, 12, 407 10 of 14
4. Discussion
4.1. Importance of Exploring Optimal DDPT from An Economic Loss Perspective
Based on the perspective of whether precipitation has adverse consequences to the economy and
society, we comprehensively determined the optimal DDPT value according to the correlation between
extreme precipitation frequency and corresponding rainstorm and flood disaster DEL rate at province
scale. First, different from traditional extreme precipitation determination methods [17,18,20,21],
which mainly consider the extreme nature of precipitation itself, the method presented in this study
determines DDPTs based on the link between extreme precipitation and adverse disaster impacts. The
optimal DDPTs could provide a practical reference to recognize the impact and define the warning
criteria of extreme precipitation events from the disaster risk perspective. For example, according to a
continuous disaster-triggering rainstorm in Sichuan Province in June 2013 recorded by Wang et al. [51],
the daily precipitation value of 26.9 mm can also cause disaster losses, and this value is close to the
median precipitation value (26.0 mm) of the DDPT in Sichuan Province determined by this paper.
4.2. Advantages of Combining Percentile Method and Fixed Threshold Method to Determine DDPT
Previous studies had used the percentile method and fixed threshold method for rainstorm and
flood disaster risk assessment [16,19,23–25], while both methods have its advantages and disadvantages.
The fixed threshold method is suitable for local scale extreme precipitation analysis. While the percentile
method could consider regional differentiation of precipitation background values, and can be used
in global scale extreme precipitation analysis, while considering precipitation-induced disaster, the
extreme precipitation value determined by this method could be noneffective in the extreme arid region
as demonstrated above in Xinjiang province. As such, we determine DDPT value using a combination
of the percentile method and fixed threshold value, which could determine the optimal DDPT in large
scale and also avoid occurrence of noneffective DDPT value.
4.3. The Spatial Heterogeneity and Regional Complexity of DDPT
The DDPT has strong spatial heterogeneity and regional complexity (Figure 5 and Table 3).
Concretely, the average DDPT value of 57 mm in South China may lead to rainstorm and flood disasters,
while the value of 10 mm in Northwest China may also lead to rainstorm and flood disasters; these
values are closely related to climatic conditions, precipitation types, topography and geomorphology,
and social and economic activities. Additionally, the CV of the DDPT could indicate the degree
of dispersion in different regions, which indirectly indicates the complexity of the DDPT within a
region [30,52]. As shown in Figure 5 and Table 3, 6 provinces that cross multiple threshold isolines and
are near the Heihe-Tengchong line (Gansu, Sichuan, Inner Mongolia, Ningxia, Shaanxi, and Hebei) have
CV values greater than 20%. However, provinces distributed in the eastern coastal and northwestern
inland regions (e.g., Shanghai, Tianjin, Jiangsu, Hainan, Fujian and Shandong, and Xinjiang) have
relatively low CV values, indicating that the spatial distribution of the DDPT is relatively homogeneous
in these provinces.
Therefore, combined with the precipitation classification standard formulated by the national
meteorological department, this study helps with the implementation of disaster warning and risk
analysis by exploring the relationship between disaster consequences and extreme precipitation
intensity and provides a basis for disaster possibility forecasting from regional or provincial scales.
4.4. Limitations
Some limitations exist in the determined DDPT values across the mainland of China. First,
although this study is based on the high-resolution daily gridded observational dataset (CN05.1)
generated from more than 2400 meteorological stations by the China Meteorological Administration
to determine the DDPT, the analysis of precipitation on an hourly scale may be more closely related
to the actual disaster than the daily precipitation data that were used here. The short-term heavySustainability 2020, 12, 407 11 of 14
precipitation of 16.0 mm can also cause disaster losses, according to previous records about the major
heavy precipitation process in Beijing from June to August 2011 [53]. Second, compared with the
gridded precipitation and asset value datasets, the provincial DELs caused by rainstorm and flood
disasters in this paper are relatively coarse. Acquiring rainstorm and flood disaster event-level DELs
will be helpful for further improving the reliability of the determination of DDPT based on this
research’s idea. Third, based on the regional disaster system theory [1,30], the occurrence of rainstorm
and flood disasters is related not only to precipitation intensity and exposed assets but also to the
topography and protective measures [43]. The optimal DDPT values just represent an average state of
regional or provincial disaster-triggering precipitation threshold, which may be not coincide with the
actual local DDPT but it is the DDPT value most likely to cause disaster at the provincial level. As a
result, the DDPT results estimated here may be misleading to rainstorm and flood disaster warning at
the micro scale, necessary verification by disaster event investigation in the future is critical to improve
its reliability.
5. Conclusions
Determining the extreme precipitation threshold is the basis of exploring extreme precipitation
events, but determining the DDPT is a challenging issue. Based on the daily gridded precipitation
dataset (1961–2012) and annual province-level DELs of rainstorm and flood disasters (2004–2012) in the
mainland of China, this study found that the optimal rainstorm and flood DDPT is the combination of
the 10 mm fixed threshold and the 99.3th percentile of daily precipitation. It has the highest correlation
coefficient between annual extreme precipitation days determined by the optimal DDPT and rainstorm
and flood disaster DEL rate at the province level, which is about 0.45 (p < 0.01). Meanwhile, the
rainstorm and flood disaster DEL rates increased with the number of annual extreme precipitation days.
In addition, the spatial distribution of the DDPT values decreases from the southeastern coast to
the northwestern inland area across China, and adjacent threshold isolines generally show a trend from
northeast to southwest. The optimal rainstorm and flood DDPT values at the regional and provincial
levels have strong spatial heterogeneity. At the regional level, the DDPT values of most areas of
Northwest China, North China, Southwest China, and Northeast China were less than 25 mm, while
the DDPT value in South China was more than 50 mm. At the province level, there were 7 provinces
with DDPTs lower than 25 mm, while the DDPTs of 5 provinces were higher than 50 mm on average.
Although the DDPT values of some areas were lower than 50 mm that is recognized as the warning
threshold of precipitation in China, they had a strong chance of causing disasters. Hence, the regional
rainstorm and flood disasters early warning system should be combined with the actual precipitation
conditions of a region based on the national precipitation classification standards.
Overall, unlike the traditional perspective, this study offers a new way of thinking regarding
extreme precipitation thresholds, which are called DDPTs in this study. Although there are some
uncertainties about the DDPTs obtained, it provides a basis for further improving regionally
differentiated disaster-triggering daily precipitation thresholds from the rainstorm and flood
disaster perspective.
Author Contributions: W.L. and J.W. conceived and designed the study; J.Y. validated the data; W.L. and R.T.
analyzed the data; W.L. and J.W. wrote the paper; W.L., J.W. and M.Y. revised the manuscript. All authors have
read and agreed to the published version of the manuscript.
Funding: This study was financially supported by the National Key Research and Development Program, grant
number 2016YFA0602403, and the National Natural Science Foundation of China, grant number 41571492.
Acknowledgments: The authors would like to acknowledge valuable comments by the three anonymous reviewers
on an earlier version of this manuscript.
Conflicts of Interest: The authors declare no conflict of interest.Sustainability 2020, 12, 407 12 of 14
References
1. Dankers, R.; Arnell, N.W.; Clark, D.B.; Falloon, P.D.; Fekete, B.M.; Gosling, S.N.; Heinke, J.; Kim, H.; Masaki, Y.;
Satoh, Y.; et al. First look at changes in flood hazard in the Inter-Sectoral Impact Model Intercomparison
Project ensemble. Proc. Natl. Acad. Sci. USA 2014, 111, 3257–3261. [CrossRef] [PubMed]
2. Pielke, J.; Downton, M.W. Precipitation and damaging floods: Trends in the United States, 1932–1997. J. Clim.
2000, 13, 3625–3637. [CrossRef]
3. Li, J.; Wang, B. Predictability of summer extreme precipitation days over eastern China. Clim. Dyn. 2018,
51, 4543–4554. [CrossRef]
4. Tang, R.; Wu, J.; Ye, M.; Liu, W. Impact of Economic Development Levels and Disaster Types on the
Short-Term Macroeconomic Consequences of Natural Hazard-Induced Disasters in China. Int. J. Disaster
Risk Sci. 2019, 10, 371–385. [CrossRef]
5. Liu, J.; Hertel, T.W.; Diffenbaugh, N.S.; Delgado, M.S.; Ashfaq, M. Future property damage from flooding:
Sensitivities to economy and climate change. Clim. Chang. 2015, 132, 741–749. [CrossRef]
6. Jongman, B.; Hochrainer-Stigler, S.; Feyen, L.; Aerts, J.; Mechler, R.; Botzen, W.J.; Bouwer, L.M.; Pflug, G.;
Rojas, R.; Ward, P.J. Increasing stress on disaster-risk finance due to large floods. Nat. Clim. Chang. 2014,
4, 264–268. [CrossRef]
7. Zhou, Q.; Leng, G.; Feng, L. Predictability of state-level flood damage in the conterminous United States:
The role of hazard, exposure and vulnerability. Sci. Rep. 2017, 7, 5354. [CrossRef]
8. Xu, Z.; Fan, K.; Wang, H.J. Decadal variation of summer precipitation over China and associated atmospheric
circulation after the late 1990s. J. Clim. 2015, 28, 4086–4106. [CrossRef]
9. Ma, S.; Zhou, T.; Dai, A.; Han, Z. Observed changes in the distributions of daily precipitation frequency and
amount over China from 1960 to 2013. J. Clim. 2015, 28, 6960–6978. [CrossRef]
10. Ren, G.Y.; Feng, G.; Yan, Z.W. Progresses in Observation Studies of Climate Extremes and Changes in the
mainland of China. Clim. Environ. Res. 2010, 15, 337–353. (In Chinese)
11. Wu, W.; You, Q.; Wang, D. Characteristics of Extreme Precipitation in China Based on Homogenized
Precipitation Data. J. Nat. Res. 2016, 31, 1015–1026. (In Chinese)
12. Qiu, H.; Cao, M.; Hu, S. The relationship between the frequency and the scale of flood situation in China
from 1950 to 2010. J. Nat. Disaster 2013, 22, 114–119. (In Chinese)
13. Yin, Z.; Tian, P.; Chi, X. Multi-scenario-based risk analysis of precipitation extremes in China during the past
60 years (1951-2011). Acta Geogr. Sin. 2018, 73, 405–413. (In Chinese)
14. Kong, F.; Shi, P.J.; Fang, J. Advances and Prospects of Spatiotemporal Pattern Variation of Extreme Precipitation
and its Affecting Factors under the Background of Global Climate Change. J. Catastrophol. 2017, 32, 165–174.
(In Chinese)
15. Anagnostopoulou, C.; Tolika, K. Extreme precipitation in Europe: Statistical threshold selection based on
climatological criteria. Theor. Appl. Climatol. 2012, 107, 479–489. [CrossRef]
16. Chi, X.; Yin, Z.; Wang, X.; Sun, Y. A comparison of methods for benchmarking the threshold of daily
precipitation extremes in China. J. Catastrophol. 2015, 30, 186–190. (In Chinese)
17. Hu, K.; Ivanov, P.C.; Chen, Z.; Carpena, P.; Stanley, H.E. Effect of trends on detrended fluctuation analysis.
Phys. Rev. E 2001, 64, 011114. [CrossRef]
18. Zhang, Q.; Zhang, J.; Yan, D.; Wang, Y. Extreme precipitation events identified using detrended fluctuation
analysis (DFA) in Anhui, China. Theor. Appl. Climatol. 2014, 117, 169–174. [CrossRef]
19. He, S.; Yang, J.; Bao, Q.; Wang, L.; Wang, B. Fidelity of the Observational/Reanalysis Datasets and Global
Climate Models in Representation of Extreme Precipitation in East China. J. Clim. 2019, 32, 195–212.
[CrossRef]
20. Plummer, N.; Salinger, M.J.; Nicholls, N.; Suppiah, R.; Hennessy, K.J.; Leighton, R.M.; Trewin, B.; Page, C.M.;
Lough, J.M. Changes in Climate Extremes over the Australian Region and New Zealand During the Twentieth
Century. Clim. Chang. 1999, 42, 183–202. [CrossRef]
21. Santos, C.; Ghelli, A. Observational probability method to assess ensemble precipitation forecasts.
Q. J. R. Meteorol. Soc. 2012, 138, 209–221. [CrossRef]
22. Liu, B.; Chen, X.; Chen, J.; Chen, X. Impacts of different threshold definition methods on analyzing
temporal-spatial features of extreme precipitation in the Pearl River Basin. Stoch. Environ. Res. Risk Assess.
2017, 31, 1241–1252. [CrossRef]Sustainability 2020, 12, 407 13 of 14
23. Schär, C.; Ban, N.; Fischer, E.M.; Rajczak, J.; Schmidli, J.; Frei, C.; Giorgi, F.; Karl, T.R.; Kendon, E.J.;
Klein, A.M.G.; et al. Percentile indices for assessing changes in heavy precipitation events. Clim. Chang.
2016, 137, 201–216. [CrossRef]
24. Zhai, P.; Zhang, X.; Wan, H.; Pan, X. Trends in total precipitation and frequency of daily precipitation
extremes over China. J. Clim. 2005, 18, 1096–1108. [CrossRef]
25. Beniston, M.; Stephenson, D.B.; Christensen, O.B.; Ferro, C.; Frei, C.; Halnaes, G.K.; Holt, T.; Julhä, K.;
Koffi, B.; Palutikof, J.; et al. Future extreme events in European climate: An exploration of regional climate
model projections. Clim. Chang. 2007, 81, 71–95. [CrossRef]
26. Mekasha, A.; Tesfaye, K.; Duncan, A.J. Trends in daily observed temperature and precipitation extremes over
three Ethiopian eco-environments. Int. J. Climatol. 2014, 34, 1990–1999. [CrossRef]
27. Li, F.; Collins, W.D.; Wehner, M.F.; Williamson, D.L.; Olson, J.G.; Algieri, C. Impact of horizontal resolution on
simulation of precipitation extremes in an aqua-planet version of Community Atmospheric Model (CAM3).
Tellus Ser. A Dyn. Meteorol. Oceanogr. 2011, 63, 884–892. [CrossRef]
28. Palmer, T.N.; Räisänen, J. Quantifying the risk of extreme seasonal precipitation events in a changing climate.
Nature 2002, 415, 512. [CrossRef]
29. Kharin, V.V.; Zwiers, F.W.; Zhang, X.; Wehner, M. Changes in temperature and precipitation extremes in the
CMIP5 ensemble. Clim. Chang. 2013, 119, 345–357. [CrossRef]
30. Shi, P.J. Disaster Risk Science, 2nd ed.; Springer: New York, NY, USA, 2019.
31. Gao, C.; Zhang, Z.; Zhai, J.; Liu, Q.; Yao, M. Research on meteorological thresholds of drought and flood
disaster: A case study in the Huai River Basin, China. Stoch. Environ. Res. Risk Assess. 2015, 29, 157–167.
[CrossRef]
32. Yang, L. Climate Change of Extreme Precipitation in Xinjiang. Acta Geogr. Sin. 2010, 58, 577–583. (In Chinese)
33. Min, S.; Qian, Y. Regionality and persistence of extreme precipitation events in China. Adv. Water Sci. 2008,
19, 763–771. (In Chinese)
34. Huang, J.; Wei, W.; Yang, Q.; Yao, J. Variation Tendency and Characteristics of Extreme Precipitation on the
Southern Edge of the Taklimakan Desert. Desert Oasis Meteorol. 2012, 6, 30–34. (In Chinese)
35. Li, Z.; Zheng, F.; Liu, W.; Flanagan, D. Spatial distribution and temporal trends of extreme temperature and
precipitation events on the Loess Plateau of China during 1961–2007. Quat. Int. 2010, 226, 92–100. [CrossRef]
36. Li, X.; Jiang, F.; Li, L.; Wang, G. Spatial and temporal variability of precipitation concentration index,
concentration degree and concentration period in Xinjiang, China. Int. J. Climatol. 2011, 31, 1679–1693.
[CrossRef]
37. Tang, Y.H.; Chen, X.H. Multi-scale Spatio-temporal Characteristics and Influence of Precipitation Variation
in Zhujiang River Basin During the Last 50 Years. Sci. Geogr. Sin. 2015, 35, 282–287. (In Chinese)
38. Wu, J.; Gao, X.J. A gridded daily observation dataset over China region and comparison with the other
datasets. Chin. J. Geophys. 2013, 56, 1102–1111. (In Chinese)
39. Xu, L.; Wang, A. Application of the Bias Correction and Spatial Downscaling algorithm on the temperature
extremes from CMIP5 multi-model ensembles in China. Earth Space Sci. 2019. [CrossRef]
40. Liu, L.; Ning, L.; Liu, J.; Yan, M.; Sun, W.Y. Prediction of summer extreme precipitation over the middle and
lower reaches of the Yangtze River basin. Int. J. Climatol. 2019, 39, 375–383. [CrossRef]
41. Han, Z.; Zhou, T. Assessing the quality of APHRODITE high-resolution daily precipitation dataset over
contiguous China. Chin. J. Atmos. Sci. 2012, 36, 361–373. (In Chinese)
42. Liu, M.; Xu, X.; Sun, A.Y.; Wang, K.; Liu, W.; Zhang, X. Is southwestern China experiencing more frequent
precipitation extremes? Environ. Res. Lett. 2014, 9, 064002. [CrossRef]
43. CMA. Yearbook of Meteorological Disasters of China; China Meteorological Press: Beijing, China, 2012; pp. 181–186.
(In Chinese)
44. Wu, J.; Han, G.; Zhou, H.; Li, N. Economic development and declining vulnerability to climate-related
disasters in China. Environ. Res. Lett. 2018, 13, 034013. [CrossRef]
45. Wu, J.; Li, Y.; Li, N.; Shi, P. Development of an asset value map for disaster risk assessment in China by
spatial disaggregation using ancillary remote sensing data. Risk Anal. 2018, 38, 17–30. [CrossRef] [PubMed]
46. Wu, J.; Ye, M.; Wang, X.; Koks, E. Building Asset Value Mapping in Support of Flood Risk Assessments: A
Case Study of Shanghai, China. Sustainability 2019, 11, 971. [CrossRef]
47. Ye, M.; Wu, J.; Wang, C.; He, X. Historical and future changes in asset value and GDP in areas exposed to
tropical cyclones in China. Weather Clim. Soc. 2019, 11, 307–319. [CrossRef]Sustainability 2020, 12, 407 14 of 14
48. Wu, J.; Li, Y.; Shi, P. Benchmark wealth capital stock estimations across China’s 344 prefectures: 1978 to 2012.
China Econ. Rev. 2014, 31, 288–302. [CrossRef]
49. Qi, W.; Liu, S.; Zhao, M.; Liu, Z. China’s different spatial patterns of population growth based on the “Hu
Line”. J. Geogr. Sci. 2016, 26, 1611–1625. [CrossRef]
50. Ye, D. Symmetry distribution of cities in China. Sci. China Ser. D Earth Sci. 2001, 44, 716–725. [CrossRef]
51. Wang, J.; Chen, C.; Liu, Y.; Long, K.; Wang, C. Statistical Analysis of Persistent Heavy Rainfall in Sichuan.
Meteorol. Sci. Technol. 2017, 45, 331–341. (In Chinese)
52. Bai, X.; Chen, J.; Shi, P. Landscape urbanization and economic growth in China: Positive feedbacks and
sustainability dilemmas. Environ. Sci. Technol. 2011, 46, 132–139. [CrossRef]
53. Chen, J.; Liu, L. Characteristics of urban rainstorm and its disaster cause over Beijing in flood season of 2011.
Torrential Rain Disasters 2011, 30, 282–287. (In Chinese)
© 2020 by the authors. Licensee MDPI, Basel, Switzerland. This article is an open access
article distributed under the terms and conditions of the Creative Commons Attribution
(CC BY) license (http://creativecommons.org/licenses/by/4.0/).You can also read