DAMS AND AGRICULTURE IN AFRICA
←
→
Page content transcription
If your browser does not render page correctly, please read the page content below

FAO AQUASTAT Dams Africa – 070524

                        DAMS AND AGRICULTURE IN AFRICA

                                             Prepared by the

                                    AQUASTAT Programme
                                                May 2007

                            Water Development and Management Unit (NRLW)
                                     Land and Water Division (NRL)
                       Food and Agriculture Organization of the United Nations (FAO)

Dams

According to ICOLD (International Commission on Large Dams), a large dam is a dam with the height
of 15 m or more from the foundation. If dams are 5-15 metres high and have a reservoir volume of
more than three million m 3, they are also classified as large dams. Using this definition, there are more
than 45 000 large dams around the world, almost half of them in China. Most of them were built in the
20th century to meet the constantly growing demand for water and electricity. Hydropower supplies
2.2% of the world’s energy and 19% of the world’s electricity needs and in 24 countries, including
Brazil, Zambia and Norway, hydropower covers more than 90% of national electricity supply. Half of
the world’s large dams were built exclusively or primarily for irrigation, and an estimated 30-40% of the
277 million hectares of irrigated lands worldwide rely on dams. As such, dams are estimated to
contribute to 12-16% of world food production.

Regional inventories include almost 1 300 large and medium-size dams in Africa, 40% of which are
located in South Africa (517) (Figure 1). Most of these were constructed during the past 30 years,
coinciding with rising demands for water from growing populations. Information on dam height is only
available for about 600 dams and of these 550 dams have a height of more than 15 m. Information on
reservoir capacity is available for all inventoried dams and more than half have a capacity of more
than three million m3. Less than 5% of the dams has a reservoir capacity of more than 1 billion m3,
10% between 0.1 – 1 billion m3, 20% between 0.01 – 0.1 billion m3, and 35% between 0.001 –
 0.01 billion m3. The majority of dams in Africa have been constructed to facilitate irrigation (52%) and
to supply water to municipalities (20%). Almost 20% of dams have multiple purposes, of which
irrigation is almost always one of the purposes. Although only 6% of dams were built primarily for
electricity generation, hydroelectric power accounts for more than 80% of total power generation in 18
African countries, and for more than 50% in 25 countries. Only 1% of African dams have been
constructed to provide flooding control, according to the World Commission on Dams.

Considering dams with a reservoir capacity of over 1 billion m 3, Africa counts 54 of such dams with a
total reservoir capacity of about 726 billion m3, or almost 90% of the capacity of all dams in the
inventory (Annex 1). Of these dams, 20 are multipurpose dams, mainly used for both hydroelectricity
and irrigation, 22 are used mainly for hydroelectricity and 12 mainly for irrigation. Eight of these large
dams have a reservoir capacity of over 10 billion m3 each and three of over 100 billion m3 each
(Kariba on the Zambezi River with 188 billion m3, Aswan on the Nile River with 162 billion m3 and
Akosombo on the Volta River with 148 billion m3). The reservoir capacity of these three dams
represents almost 70% of the total capacity of the 54 dams. While the Kariba Dam and the Akosombo
dam have been built for hydroelectricity, the Aswan Dam was built for irrigation in Egypt. The
distribution of the large dams within the different river basins is given in Table 1. Figure 2 shows the
major river basins in Africa.

                                               1 of 14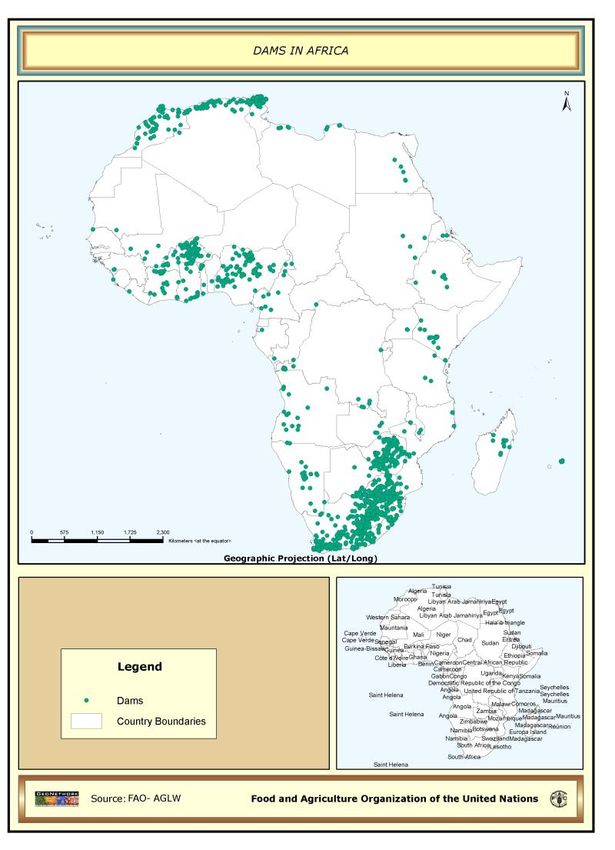
FAO AQUASTAT Dams Africa – 070524
Large-scale irrigation schemes

The most recent survey indicates that the total area under irrigation in Africa is about 13.4 million ha,
of which almost 70 percent are located in five countries only (Egypt, Madagascar, Morocco, South
Africa and Sudan) (Annex 2). The total area under irrigation in ten large international river basins is
about 7 million ha, which is just over half of the total area under irrigation in Africa (Table 2).

The definition of large-scale irrigation schemes varies from country to country. In most cases, they can
be considered as “formal irrigation schemes”, mostly developed from public investments, and
managed through irrigation agencies. Schemes larger than 1 000 ha exist in about two thirds of the 53
countries. Schemes of more than 10 000 ha exist in about one quarter of the countries, representing
almost half of the total area under irrigation (Table 3 and Annexes 2 and 3). The only real large-scale
scheme in Africa is the Gezira-Managil scheme in Sudan with an area of about 870 000 ha, which is
irrigated with water from the Blue Nile through the Sennar Dam. Several schemes of more than
100 000 ha exist in Egypt, Morocco and Sudan. Schemes of around 50 000 ha exist in Algeria, Egypt,
Mali, Morocco, Sudan and Tunisia.

Inter-basin water transfers

Inter-basin transfers in Africa are limited to southern Africa. Transfers into the Orange/Vaal basin from
adjacent basins within South Africa and from Lesotho and Swaziland feed the industrial heartland of
South Africa and have necessitated a set of transboundary water sharing agreements. Proposals for
inter-basin transfers out of the Congo and Niger systems into drier Sahelian and southern Africa
basins are at pre-feasibility stage and include proposals for a transfer from the Oubangi sub-basin of
the Congo into the Chari-Logone sub-basin of Lake Chad.

Future prospects

Although Africa is, after Oceania, the driest continent in the world, it uses few of its renewable water
resources: 5.5% against 20.4% in Asia (Table 4). Looking at sub-Saharan Africa, it uses only 2.9% of
its renewable water resources, against 62.5% in the Near East & North Africa region and 52.1% in
South Asia.

Sub-Saharan Africa is also the region where irrigated agriculture is least developed. Just 3.5% of its
cultivated area is irrigated, against 42.2% in South Asia and 33.6% in the Near East & North Africa
region (Table 5).

Potential for increasing irrigation still exists, especially in sub-Saharan Africa. However, if irrigated
production is to make a significant contribution to food security and economic growth in sub-Saharan
Africa, it will have to be restructured across the region as a whole: the structure of the irrigation sub-
sector should be matched to the structure of demand; existing supply chains, storage and processing
should be concentrated to address specific, well-identified markets; prior to new public expenditure or
the encouragement of private investment, the full implications of price impacts must be taken into
account; costs of supplying into specific crop markets will need to be addressed.

If after a thorough analysis increasing the irrigation area is a preferred option, one of the options could
be increasing the water storage for irrigated agriculture. However, if dam construction is envisaged,
then not only should be considered whether this is a technically feasible option, but also whether this
is an economically viable, a socially acceptable and, above all, an environmentally sustainable option.

More information

http://www.fao.org/nr/aquastat

http://www.fao.org/nr/water/aquastat/dams/index.stm

                                               2 of 14
FAO AQUASTAT Dams Africa – 070524
FIGURE 1
Dams in Africa
3 of 14FAO AQUASTAT Dams Africa – 070524
FIGURE 2
Major river basins in Africa
4 of 14FAO AQUASTAT Dams Africa – 070524
TABLE 1
Large dams by river basin in Africa (Source: FAO-AQUASTAT)
Number of Height Reservoir Total
existing large of capacity reservoir Main
River Basin Countries in basin
dams dams range capacity purpose*
(> 1 billion m3) (m) (billion m3) (billion m3)
Guinea, Mali, Mauritania,
Senegal 1 70 11.3 11.3 I
Senegal
Algeria, Benin, Burkina
Faso, Cameroon, Chad
6 23 - 79 2.2 – 15.0 31.4
Niger Côte d’Ivoire, Guinea, I, H
Mali, Niger, Nigeria
Algeria, Cameroon,
Central African Republic,
4 14 - 48 1.9 – 6.5 16.6 I
Lake Chad Chad, Niger, Nigeria,
Sudan
Benin, Burkina Faso, Côte
Volta d’Ivoire, Ghana, Mali, 2 ? - 134 1.4 – 148.0 149.4 H
Togo
Burundi, DRC, Egypt,
Eritrea, Ethiopia, Kenya,
Nile 6 22 - 111 0.9 – 162.0 174.9 I, H
Rwanda, Sudan,
Tanzania, Uganda
Angola, Botswana,
Malawi, Mozambique,
Zambezi 3 70 - 171 4.9 – 188.0 231.9 I, H
Namibia, Tanzania,
Zambia, Zimbabwe
Botswana, Lesotho,
Orange 5 ? - 185 1.3 – 5.7 14.2 I, H
Namibia, South Africa
Botswana, Mozambique,
Limpopo 2 48 - 65 2.3 – 11.2 13.5 I, H
South Africa, Zimbabwe
Angola, Burundi,
Cameroon, Central
Congo African Rep, Congo, 2 50 - 58 H
DRC, Rwanda, Tanzania,
Zambia
Djibouti, Eritrea, Ethiopia,
Rift Valley Kenya, Sudan, Tanzania, 2 42 - 155 1.6 – 1.9 3.5 I, H
Uganda
Save Mozambique, Zimbabwe 1 67 1.4 1.4 I
Mozambique, South
Incomati 1 46 1.3 1.3 I, H
Africa, Swaziland
Cunene Angola, Namibia 1 58 2.6 2.6 I, H
Mono Benin, Togo 1 44 1.7 1.7 I, H
Other basins:
Bengo, Angola 2 41 1.5 1.5 I
Djerem, Mape, Noun Cameroon 3 17 - 34 1.8 – 3.2 7.6 H
Bandama, Sassandra Côte d’Ivoire 2 37 - 58 8.3 – 27.7 36.0
Tana Kenya 1 70 1.6 1.6 H
El Abid, Inaouene,
Morocco 4 72 - 133 1.2 – 2.8 9.1 I, H
Ouergha, Oum R’Bia
Lurio, Pungoé, Revué Mozambique 3 40 - 75 1.2 – 2.5 5.3 H
Nuvejaarspruit, Pongola South Africa 3 ? 2.5 – 3.2 8.3 I
Great Ruaha/Rufiji Tanzania 1 45 3.2 3.2 H
TOTAL 53 14 - 171 0.9 – 188.0 726.3
* I = Irrigation, H = Hydropower
5 of 14FAO AQUASTAT Dams Africa – 070524
TABLE 2
Area under irrigation by river basin in Africa (Source: FAO-AQUASTAT)
Large dam
Area of river Area under
capacity
River basin basin Countries irrigation
(> 1 billion m3)
(1 000 ha) (1 000 ha)
(billion m3)
Angola, Burundi, Cameroon, Central African Rep,
Congo 378 905 40
Congo, DRC, Rwanda, Tanzania, Zambia
Burundi, DRC, Egypt, Eritrea, Ethiopia, Kenya,
Nile 311 237 5 200 174.9
Rwanda, Sudan, Tanzania, Uganda
Algeria, Cameroon, Central African Republic,
Lake Chad 238 164 150 16.6
Chad, Niger, Nigeria, Sudan
Algeria, Benin, Burkina Faso, Cameroon, Chad
Niger 227 395 300 31.4
Côte d’Ivoire, Guinea, Mali, Niger, Nigeria
Angola, Botswana, Malawi, Mozambique, Namibia,
Zambezi 135 137 250 231.9
Tanzania, Zambia, Zimbabwe
Botswana, Lesotho, Namibia, South Africa
Orange 89 637 310 14.2
Djibouti, Eritrea, Ethiopia, Kenya, Sudan,
Rift Valley 63 759 250 3.5
Tanzania, Uganda
Guinea, Mali, Mauritania, Senegal
Senegal 48 318 150 11.3
Botswana, Mozambique, South Africa, Zimbabwe
Limpopo 40 186 250 13.5
Benin, Burkina Faso, Côte d’Ivoire, Ghana, Mali,
Volta 39 420 50 149.4
Togo
Total for 10
1 572 158 6 950 646.7
basins
Total for
3 029 021 13 403 726.3
Africa
10 basins as
52 52 89
% of Africa
TABLE 3
Countries in Africa with large irrigation schemes (> 10 000 ha) (Source: FAO-AQUASTAT)
Area under irrigation (1 000 ha)
Country Large schemes Area of large schemes
Total
(> 10 000 ha) as % of total area
Algeria 569 150 26
Côte d’Ivoire 73 10 14
Egypt 3 422 2 800 82
Ethiopia 290 50 17
Libya 470 40 9
Madagascar 1 086 70 6
Mali 236 130 55
Morocco 1 443 650 45
Mozambique 118 50 42
Nigeria 293 30 10
South Africa 1 498 500 33
Sudan 1 863 1 700 91
Tunisia 394 100 25
Zambia 156 20 13
Zimbabwe 174 20 11
Total 12 085 6 320 52
Total for Africa 13 403 6 320 47
6 of 14FAO AQUASTAT Dams Africa – 070524
TABLE 4
Freshwater withdrawal by sector, year 2000 (Source: FAO-AQUASTAT)
Renewable Total volume Freshwater withdrawal by sector
Utilization
World/Continent/Region freshwater of freshwater
Domestic Industrial Agricultural as % of
resources withdrawal
resources
km3/year km3/year km3/year % km3/year % km3/year %
WORLD 43 659 3 830.0 381.2 10.0 784.8 20.5 2 664.0 69.5 8.8
Developed countries 13 829 1 236.9 166.3 13.4 508.3 41.1 562.3 45.5 8.9
Industrialized countries (a) 8 782 890.7 132.4 14.9 394.7 44.3 363.6 40.8 10.1
Transition economies 5 047 346.2 33.9 9.8 113.6 32.8 198.7 57.4 6.9
Developing countries 29 830 2 593.1 214.9 8.3 276.5 10.7 2 101.7 81.0 8.7
Latin America and the Caribbean 13 570 265.4 50.5 19.0 27.5 10.3 187.4 70.6 2.0
Near East and North Africa (b) 514 321.5 25.5 7.9 14.1 4.4 281.9 87.7 62.5
Sub-Saharan Africa (c) 3 844 110.6 9.0 8.1 2.9 2.6 98.7 89.2 2.9
East and Southeast Asia (d) 8 654 977.6 71.2 7.3 192.4 19.7 714.0 73.0 11.3
South Asia 1 761 917.8 58.7 6.4 39.6 4.3 819.6 89.3 52.1
Oceania developing 884 0.1 0.1 35.5 0.0 28.4 0.1 36.2 0.0
North America developing 603 - - - 0.0
Continental groupings 43 659 3 830.0 381.3 10.0 784.8 20.5 2 664.0 69.5 8.8
Africa 3 936 217.0 21.7 10.0 9.1 4.2 186.2 85.8 5.5
Asia 11 594 2 377.9 171.6 7.2 270.3 11.4 1 936.0 81.4 20.5
Latin America 13 477 251.9 47.4 18.8 26.2 10.4 178.3 70.8 1.9
Caribbean 93 13.4 3.1 23.1 1.3 9.4 9.1 67.5 14.4
North America 6 253 525.3 69.8 13.3 252.3 48.0 203.2 38.7 8.4
Oceania 1 703 26.2 4.6 17.5 2.6 10.1 19.0 72.4 1.5
Europe 6 603 418.3 63.0 15.1 223.0 53.3 132.3 31.6 6.3
(a) Including Japan, South Africa, Israel
(b) Excluding Israel
(c) Excluding South Africa
(d) Excluding Japan
TABLE 5
Percentage of cultivated land irrigated (Source: FAO-FAOSTAT)
Irrigation
World/Continent Area (1000 ha) As % of arable land
1980 1990 2003 1980 1990 2003
WORLD 210 222 244 988 277 098 15.7 17.6 19.8
Developed countries 58 926 66 286 69 133 9.1 10.2 11.4
Industrialized countries 37 355 39 935 43 563 9.9 10.5 12.0
Transition economies 21 571 26 351 25 570 7.9 9.8 10.5
Developing countries 151 296 178 702 207 965 21.9 24.1 26.1
Latin America & the Caribbean 13 811 16 794 18 616 10.8 12.5 13.0
Near East & North Africa 17 982 24 864 29 312 21.8 28.8 33.6
Sub-Saharan Africa 3 980 4 885 5 572 3.2 3.7 3.5
East & Southeast Asia 59 722 65 624 73 735 37.0 33.9 34.7
South Asia 55 798 66 529 80 716 28.6 33.9 42.2
Oceania developing 3 6 14 0.7 1.2 2.4
North America developing ... ... ... ... ... ...
Continental groupings 277 098 19.8
Africa 9 491 11 235 13 370 6.0 6.7 6.7
Asia 132 377 155 009 193 890 31.3 33.8 38.3
Caribbean 1 074 1 269 1 304 22.0 23.3 24.5
Latin America 12 737 15 525 17 312 10.4 12.0 12.6
North America 21 178 21 618 23 170 9.1 9.3 10.6
Oceania 1 686 2 118 2 844 3.6 4.2 5.7
Europe 14 479 17 414 25 208 11.5 14.0 8.9
7 of 14FAO AQUASTAT Dams Africa – 070524
ANNEX1
Large dams (> 1 billion m3 or > 1 BCM) by river basin in Africa
Dam located in Dam located in Dam properties
River Basin Status Name of dam river country Capacity Height Use*
(billion m3) (m)
SENEGAL Existing Manantali Bafing Mali 11.270 70 I, N
- Irrigation potential from Manantali Dam: 10 000 ha in Mali, 125 000 ha in Mauritania,
240 000 ha in Senegal (incl. Diama dam with 0.250 BCM capacity)
- Irrigated from Manantali Dam: 300 ha in Mali, 20 000 ha in Mauritania, 50 000 ha in Senegal
- According to integrated development master plan of left bank of Senegal river (1990) 131 500 ha
is expected to be irrigated in 2025: 33 000 ha flood recession cropping, 10 500 ha irrigated
industrial crops, 88 000 ha food crops
- In Mauritania is Foum Gleita Dam on the Gorgoil noir with 0.5 BCM capacity, for irrigation purposes
Planned
GAMBIA Existing
Planned Kekreti Dam in Senegal for hydropower and irrigation of 15 000 ha in Senegal and
55 000 ha in Gambia
NIGER Existing Sélingue Sankarani Mali 2.170 23 I, H, F, N
Sotuba & Markala Niger Mali I
Lagdo Benue Cameroon 7.800 40 H, F, N, R
Jebba Niger Nigeria 3.600 40 H
Kainji Niger Nigeria 15.000 79 H, F
Dadin Kowa Gongola Nigeria 2.855 42 I, H, S
- Sélingue Dam is mainly used for hydropower and 60 000 ha irrigation
- Diversion dams used to irrigate 56 000 ha of Office du Niger (Markala Dam of 0.175 BCM for rice)
- Lagdo Dam is mainly used for hydropower, but could also be used for irrigation of about 20 000 ha
About 1 000 ha is at present irrigated in Cameroon from this dam
Planned - Fomi Dam on the Niandan River in Guinea for irrigation and hydropower
However, negative environmental impact expected.
- Tala & Djenné Dam on the Bani River in Mali for irrigation
However, drying up of water resources requires re-examination
- Tossaye Dam on Niger River in Mali for irrigation
- Kandadji Dam on Niger River in Niger for multi-purpose use, including about 140 000 ha irrigation
- In Nigeria, two proposals exist for water transfer schemes from Niger basin to Lake Chad basin
LAKE CHAD Existing Tiga Kano Nigeria 1.874 48 I, F
Mohammadu Abuya Kano Nigeria 5.535 16 I, S
Jekara Kano Nigeria 6.519 14 I, O
Kafin Zaki Bonga Nigeria 2.700 40 I
Planned - Two sites for dams on upstream branches of Logone in Cameroon and Chad planned for irrigation
However, this would be to the detriment of water use for hydro-electric power generation and for
irrigation outside Yaére lowlands.
- Due to lowering of Lake Chad plans exist to transfer water from Congo basin by 170 km long canal in CAR
VOLTA Existing Akosombo Volta Ghana 147.960 134 H
Kompienga Oualé Burkina Faso 1.400 H
Planned
NILE Existing Roseires Blue Nile Sudan 2.200 60 I, H, F
Sennar Blue Nile Sudan 0.930 48 I, H
Jebel Aulia White Nile Sudan 3.500 22 I, H, F, N, R
Khashm el Girba Atbara Sudan 1.300 35 I, H
High Aswan Nile Egypt 162.000 111 I, H, F
Old Aswan Nile Egypt 5.000 53 I, H
Planned - Plans exist to increase the height of Roseires dam in order to have an additional capacity of 4 BCM.
- The Sennar Dam is used for irrigation of the large Gezira Managil scheme (870 750 ha)
- About 152 280 ha is irrigated in Sudan from the Jebel Aulia Dam
- Over 2.9 million ha is irrigated in Egypt using water from the Aswan Dam
- In Tanzania, plans dating back from the German colonial period exist to transfer water from Lake
Victoria to the Vembere Plateau to irrigate 88 000 -230 000 ha of cotton. Project is still at
planning stage, but costs expected to be high
- In Kenya plans exist to transfer water from Lake Victoria to drier areas, such as Kerio (in Rift Valley)
ZAMBEZI Existing Kariba Zambezi Zambia, Zimbabwe 188.000 128 H
Itezhitezhi Kafue Zambia 4.925 70 H
Cahora Bassa Zambezi Mozambique 39.000 171 I, H, F
Many small dams are located in Zimbabwe, mainly for irrigation purposes
Planned Series hydropower cascade dams on mainstream Zambezi (Batoka Gorge, Devil's Gorge and Muputa Gorge
8 of 14FAO AQUASTAT Dams Africa – 070524
ORANGE Existing Bloemhof Vaal South Africa 1.264 I, S
Gariep (H. Verwoerd) Orange South Africa 5.674 I, H, S
P.K. Le Roux Orange South Africa 3.237 I, H
Vaal Vaal South Africa 2.122
Katse (LHWP) Malibamatso Lesotho 1.950 185 H
Planned - Mashai Dam (3.3 BCM), Tsoelike Dam (2.22 BCM) and Ntoahae Dam in Lesotho within framework
of the Lesotho Highlands Water Project (LHWP)
- Due to Lesotho's commitments through the LHWP, its water resources will have reduced from
5.23 BCM/yr to 3.03 BCM/yr in 2020
- LHWP transfers 2.2 BCM/yr water to South Africa (Vaal River), while providing Lesotho with facilities to
generate its own electricity
LIMPOPO Existing Mapai Limpopo Mozambique 11.200 65 I
Massingir Elefantes Mozambique 2.256 48 I, H, F
Many smaller dams are located in the Limpopo basin in South Africa, mainly for irrigation
Planned - In South Africa plans exist for water transfer from Incomati to Limpopo, Usutu to Limpopo, and
Orange to Limpopo
- In Botswana plans exist for north-south water carrier from Shashe river to Notwane river
(both located in the Limpopo basin)
CONGO Existing Inga I Nkokolo/Congo DRC 50 H
Inga II Nkokolo/Congo DRC 58 H
- Due to lack of maintenance during the civil war, these dams are heavily silted and operate on only
30% of their capacity
Planned - Inga III on the Nkokolo/Congo, with a height of 60 m, for hydropower
- Grand Inga on the Congo, with a height of 150 m, for hydropower
RIFT VALLEY Existing Koka Awash Ethiopia 1.900 42 I, H
Turkwel Turkwel Kenya 1.645 155 H
Planned
SAVE Existing Kyle Mutirikwi Zimbabwe 1.425 67 I
Planned
INCOMATI Existing Corumana Sabié Mozambique 1.273 46 I, H, F
Planned Driekoppes Dam in Komati River in South Africa and Maguga Dam (0.332 BCM) in Komati in Swaziland
CUNENE Existing Gove Cunene Angola 2.574 58 I, H
- The Gove Dam Also provides water to Namibia for water supply to population
Planned Epupa Dam between Angola and Namibia for hydropower with capacity of 7.3 BCM
MONO Existing Nangbeto Mono Togo 1.710 44 I, H
Planned
ANGOLA Existing Quiminha Bengo Angola 1.560 41 I, S
Coastal basin
Planned
CAMEROON Existing Mape Mape Cameroon 3.200 34 H
Several coastal M. Bakaou Djerem Cameroon 2.600 30 H
basins Bamendjin Noun Cameroon 1.800 17 H
Planned
CÔTE D'IVOIRE Existing Bandama Bandama Côte d'Ivoire 27.675 58 H
Several coastal Buyo Sassandra Côte d'Ivoire 8.300 37 H
basins
Planned
KENYA Existing Masinga Tana Kenya 1.560 70 H, F
Coastal basin
Planned
MOROCCO Existing Bin El Ouidane El Abid Morocco 1.384 133 I, H
Several coastal Idriss 1 Inaouene Morocco 1.186 72 I, H
basins Al Massira Oum R'Bia Morocco 2.760 82 I, H, S
Al Wahda Ouergha Morocco 3.730 88 I, H
- Thirteen structures exist in Morocco for water transfer between basins, total quantity over 2.7 BCM
Planned
9 of 14FAO AQUASTAT Dams Africa – 070524 10 of 14
FAO AQUASTAT Dams Africa – 070524

11 of 14
FAO AQUASTAT Dams Africa – 070524

12 of 14
FAO AQUASTAT Dams Africa – 070524
ANNEX 3
Largest irrigation schemes in Africa (area under irrigation refers to 1986, South Africa excluded)

                                                                        13 of 14
FAO AQUASTAT Dams Africa – 070524
# COUNTRY REGION NAME OF SCHEME NAME OF RIVER (when AREA MAIN CROPS
(when available) available) (Hectares) (when available)
1 Egypt Old Land Nile River 2,400,000 cotton / rice / wheat / sugarcane / berseem / maize
2 Sudan Blue Nile Gezira-Main Blue Nile River 476,860 cotton / groundnut / wheat / sorghum
3 Egypt New Land Nile River 400,000 orchards / vegetables / fodder
4 Sudan Blue Nile Managil Extension Blue Nile River 397,440 cotton / groundnut / wheat / sorghum
5 Sudan Atbra River New Halfa Pro. Corp. Atbra River 151,200 cotton / wheat / groundnuts
6 Sudan White Nile Agr. Pro. Corp. White Nile River 151,030 cotton
7 Sudan Blue Nile Rahad Corp. Blue Nile River 126,000 cotton / groundnut / sorghum
8 Sudan Blue Nile Blue Nile Agr. Pro. Corp. Blue Nile River 122,640 cotton
9 Morocco Ormva of Tadia Oam Er Rbia River 122,100 cotton / wheat / fodder / vegetables
10 Morocco Ormva of Gharb Zelouane River 102,800 cereals / vegetables / sugar beets / citrus fruits
11 Morocco Ormva of Souss-Massa Souss-Massa River 95,900 citrus fruits / vegetables / cereals
12 Morocco Ormva of Ouarzazate South Atlas 66,200 wheat / fodder / vegetables
13 Morocco Ormva of Moulouya Moulouya River 64,600 wheat / vegetables / fodder
14 Morocco Ormva of Doukkala Oum Er Rbia River 59,400 wheat / maize / fodder / sugar
15 Morocco Ormva of Tafilalet Gheris-Ziz River 50,000 wheat / fodder / vegetables
16 Sudan Main Nile North Agr. Prod. Corp. Nile River 43,260 cotton / fruits / vegetables
17 Algeria Biskra 40,965
18 Mali Riz Mopti Others Niger River 38,555 rice
19 Tunisia OMV Medjerda Tébourba 53,010
20 Sudan Blue Nile El Suki Blue Nile River 36,500 cotton / groundnut / sorghum
21 Morocco Ormva of Haouz Tensift River 34,700 wheat / fodder / vegetables
22 Sudan White Nile Kenana White Nile River 34,020 sugarcane
23 Sudan Outside Nile System Gash Gash River 33,600 cotton / sorghum
24 Tunisia OMV Kairouan Others 31,410
25 Mozambique Chokwe Limpopo River 25,000 rice / maize / dry beans / vegetables
26 Libya Sarir North and South 23,000 wheat
27 Madagascar B. Betsiboka Betsiboka River 20,000 rice
28 Sudan Blue Nile Guneid Extension Blue Nile River 19,070 cotton / groundnut
29 Morocco Ormva of Loukkos Loukkos River 18,800 wheat / forage / sugarcane / vegetables
30 Algeria Blida 18,065
31 Algeria Tipaza 17,655
32 Sudan Atbra River Halfa Sugar Co. Atbra River 17,640 sugarcane
33 Sudan Main Nile Basins Nile River 16,800 cotton / fruits / vegetables
34 Sudan Blue Nile Guneid Sugar Co. Blue Nile River 16,250 sugarcane
35 Algeria Mostaganem 15,535
36 Mali Riz Segou Right Bank Niger River 15,140 rice
37 Mali Riz Segou Dioro Niger River 15,100 rice
38 Madagascar Antananarivo Plain 15,000 rice
39 Ethiopia Tendhao (Dubte-Dit-Bahari) Awash River 14,900 cotton
40 Nigeria Chad Rbrda South Chad Lake Chad 14,500 wheat / rice / cotton
14 of 14You can also read