Dance of the lions and dragons - How are Africa and China engaging, and how will the partnership evolve? - APO Group - Africa-Newsroom
←
→
Page content transcription
If your browser does not render page correctly, please read the page content below

JUNE 2017
            Dance of the lions
            and dragons
            How are Africa and China engaging, and how will
            the partnership evolve?
To download an electronic version of this report, please visit www.mckinsey.com/africa-china.

This publication is not intended to be used as the basis for trading in the shares of
any company or for undertaking any other complex or significant financial transaction
without consulting appropriate professional advisers.

No part of this publication may be copied or redistributed in any form without the
prior written consent of McKinsey & Company.

Cover photo: © Lin Qi
Dance of the lions
and dragons
How are Africa and China engaging, and how will
the partnership evolve?

JUNE 2017

Irene Yuan Sun
Kartik Jayaram
Omid Kassiri

CONTENTS

 4   Understanding the rhythm of Chinese business in Africa

 8   Executive summary

16   Chapter 1
     The dragon has landed: Africa’s biggest economic partner

26   Chapter 2
     Ten-thousand business builders: Chinese firms’ diversity, scale,
     and ambition

38   Chapter 3
     Big benefits, but real issues: Weighing the impact of Chinese
     investment in Africa

50   Chapter 4
     Different dances: Four ways African countries are partnering with China

60   Chapter 5
     The $440 billion opportunity: Unlocking the full potential of the
     Africa-China partnership

76   Selected bibliography

78   Acknowledgements

                                                                               3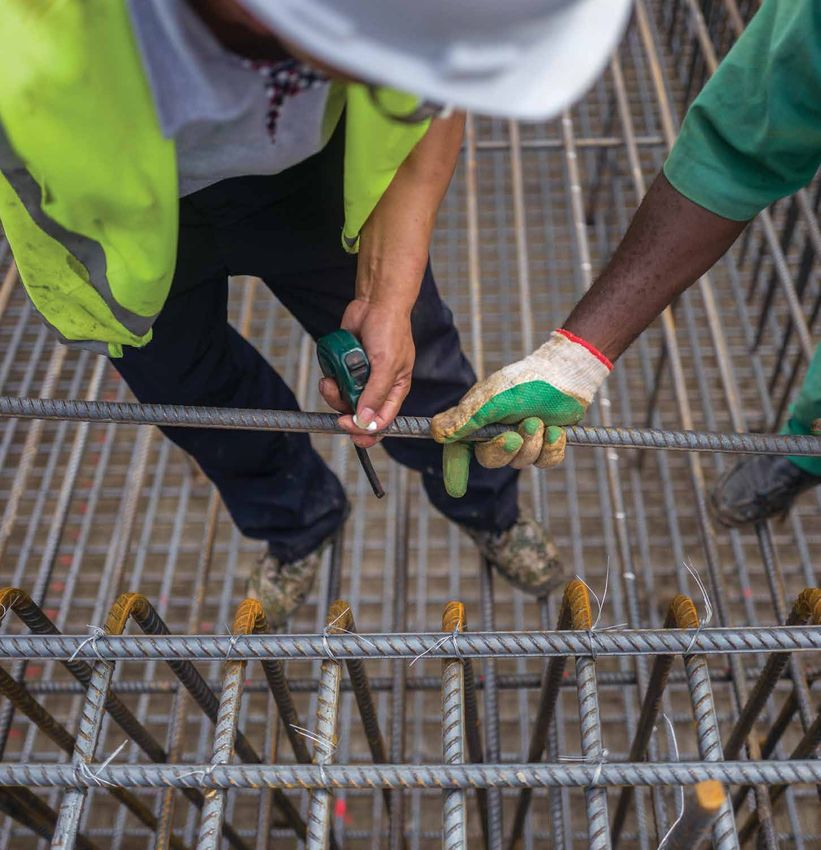

Understanding
the rhythm of
Chinese business
in Africa

                   © Lin Qi

                     5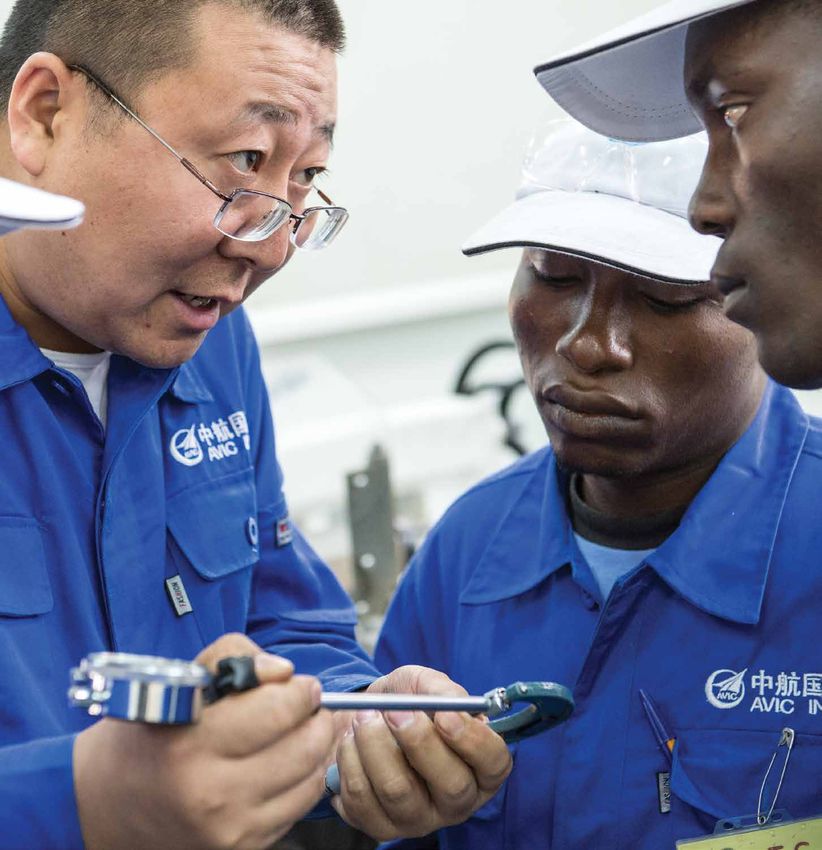
Kajiado County, Kenya, might not be the obvious place to look for
evidence of large-scale business. A sleepy, mostly rural area about
two hours from Nairobi, the county’s greatest claim to fame is its
views of snow-capped Mount Kilimanjaro, Africa’s highest mountain
just over the border in Tanzania.
But when we made the 70-kilometer journey from Nairobi one rainy
morning, we were astonished to witness a massive, modern factory—
the size of several football fields—rising out of the savannah. We had
arrived at the Twyford ceramic tile factory, built in just eight months
in 2015–16. One of our teammates commented, “It took me longer to
retile my roof and bathroom!”
The factory is a joint venture between two Chinese firms, the SunDa
Group and Keda Clean Energy Company. SunDa started as a
trading operation in Nigeria, focused on importing tiles from China,
but it has since switched to manufacturing in several African
countries. Its partner, Shanghai-based Keda, is a major supplier
of industrial machinery. The two companies invested $30 million in
the first phase of the Kenya factory alone.
Our visit to Kajiado took some time to arrange. The Twyford factory’s
managers, like many other Chinese business builders in Africa,
prefer to keep a low profile. While we were learning more about
Chinese industrial firms like Twyford, many business leaders
we spoke to in Nairobi were unaware that such a large-scale factory
could exist in Kenya. If even such a large industrial facility can
remain hidden in plain sight, it’s no surprise that the extent of
Chinese business activity in Africa is so widely underestimated—
and misunderstood.
Our tour of the factory—once we’d trudged through the ankle-deep
mud surrounding the construction site of the massive second
phase—shed light on several aspects of Chinese business activity in
Africa. Inside, the factory is bright, spacious, and modern. It is also
enormous: each production line is three-quarters of a kilometer long.
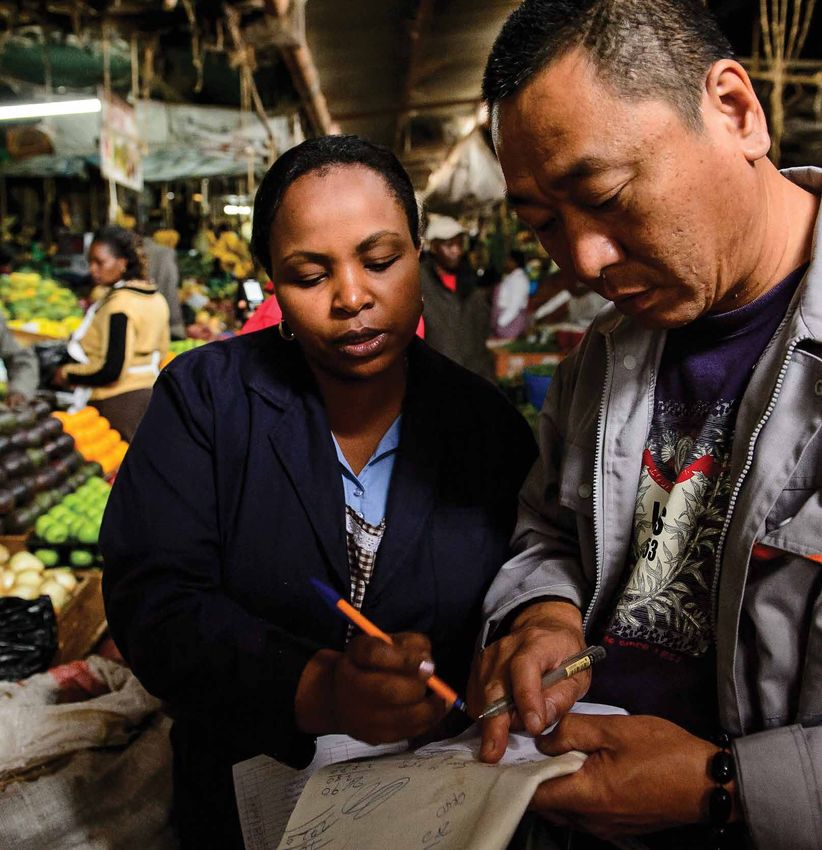
Most workers we encountered were Kenyans; the myth that Chinese
firms typically avoid employing locals was shown to be just that.
6
Twyford, like many other Chinese firms in Africa, is not just creating
jobs—1,500 at its Kenya factory alone—it is also helping to build skills.
Moreover, these employees are not simply engaged in manual labor:
many work as technical operators of Keda’s advanced machinery.
Most of the factory’s management and supervisors, including its
overall manager, are Kenyan.

The smaller group of Chinese managers and workers, unlike their
Kenyan counterparts, live on site—in a housing compound complete
with a volleyball court—and rarely leave the factory precinct, even
on weekends. With a year or more between their visits back to China,
several told us of their homesickness. The camaraderie between
Chinese and Kenyan employees was clear for us to see on the factory
floor, but the Chinese are far from integrated into the local community.

Since we visited Twyford, we have seen Kenyans also starting
to take notice of the factory, which has received coverage by multiple
news outlets. We think that shift is emblematic of the increased
visibility of Chinese businesses across the continent: the many
thousand dragons are emerging into view.

                                                                           7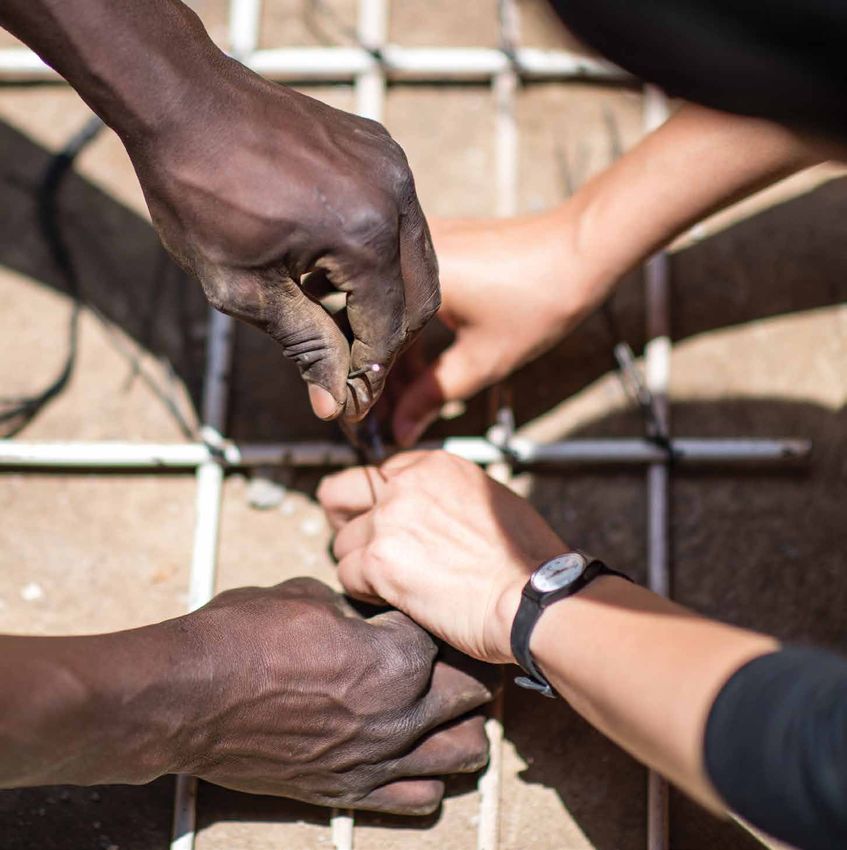
EXECUTIVE SUMMARY

8
In a mere two decades, China has become Africa’s biggest
             economic partner. Across trade, investment, infrastructure
             financing, and aid, there is no other country with such depth and
             breadth of engagement in Africa. The Chinese “dragons”—firms
             of all sizes and sectors—are bringing capital investment, manage-
             ment know-how, and entrepreneurial energy to every corner
             of the continent—and in so doing, they are helping to accelerate
             the progress of Africa’s “lions,” as its economies are often referred
             to. Yet to date, it has been challenging to understand the full extent
             of the Africa-China economic relationship due to a paucity of data.

             This report aims to provide a fact-based picture of the Africa-China
             economic relationship. Its foundation is a large-scale data set about
             the economic relationship between Africa and China, including
             on-site interviews with more than 100 senior African business and
             government leaders, as well as the owners or managers of more
             than 1,000 Chinese firms and factories spread across eight African
             countries that together make up approximately two-thirds of Sub-
             Saharan Africa’s gross domestic product (GDP).

           1 THE DRAGON HAS LANDED: AFRICA’S BIGGEST
             ECONOMIC PARTNER
             Since the turn of the 21st century, China has catapulted from being a relatively small
             investor in the continent to becoming Africa’s largest economic partner. And since the turn
             of the millennium, Africa-China trade has been growing at approximately 20 percent
© Lin Qi

             per year. Foreign direct investment (FDI) has grown even faster over the past decade, with
             a breakneck annual growth rate of 40 percent.1 Yet even this number understates the true
             picture: we found that China’s financial flows to Africa are around 15 percent larger than
             official figures suggest when nontraditional flows are included. China is also a large and fast-
             growing source of aid and the largest source of construction financing; these contributions
             have supported many of Africa’s most ambitious infrastructure developments in recent years.

             We evaluated Africa’s economic partnerships with the rest of the world across five
             dimensions: trade, investment stock, investment growth, infrastructure financing, and
             aid. China is in the top four partners for Africa in all these dimensions. No other country
             matches this depth and breadth of engagement.

             1 The trade and investment figures cited in this report are derived from International Trade Centre (ITC) Trade Map;
               the United Nations Conference on Trade and Development (UNCTAD); 2015 statistical bulletin of China’s outward
               foreign direct investment, Ministry of Commerce of the People’s Republic of China (PRC); National Bureau of
               Statistics of the PRC; and the State Administration of Foreign Exchange. Unless otherwise stated, the increases
               cited are in nominal terms.

                                                                                                                                    9
2 TEN THOUSAND BUSINESS BUILDERS: CHINESE FIRMS’
DIVERSITY, SCALE, AND AMBITION
Behind these macro numbers are thousands of previously uncounted Chinese firms
operating across Africa. In the eight African countries we focused on, the number
of Chinese-owned firms we identified was between double and nine times the number
registered by China’s Ministry of Commerce (MOFCOM), until now the largest database
of Chinese firms in Africa. Extrapolated across the continent, these findings suggest
there are more than 10,000 Chinese-owned firms operating in Africa today. Around
90 percent of these firms are privately owned—calling into question the notion of a
monolithic, state-coordinated investment drive by “China, Inc.” Although state-owned
enterprises (SOEs) tend to be bigger, particularly in specific sectors such as energy and
infrastructure, the sheer multitude of private Chinese firms working toward their own
profit motives make Chinese investment in Africa a more market-driven phenomenon
than is commonly understood.
Among surveyed Chinese firms operate across many sectors of the African economy. Nearly a third are
Chinese firms, involved in manufacturing, a quarter in services, and around a fifth in trade and in
construction and real estate. In manufacturing, we estimate that 12 percent of Africa’s
industrial production—valued at some $500 billion a year in total—is already handled by
Chinese firms. In infrastructure, Chinese firms’ dominance is even more pronounced,
74% and they claim nearly 50 percent of Africa’s internationally contracted construction market.
The firms we talked to are profitable; nearly one-third of them reported 2015 profit margins
of more than 20 percent. They are also agile and quick to adapt to new opportunities. Except
in a few countries such as Ethiopia, they are primarily focused on serving the needs of
are optimistic about Africa’s fast-growing markets rather than on exports.
their future in Africa.
What of the years ahead? An overwhelming 74 percent of Chinese firms said they feel
optimistic about the future. Reflecting this, most Chinese firms have made investments
that represent a long-term commitment to Africa rather than shallower trading or
contracting activities.
© Lin Qi
10 Dance of the lions and dragons: How are Africa and China engaging, and how will the partnership evolve?3 BIG BENEFITS, BUT REAL ISSUES: WEIGHING THE
IMPACT OF CHINESE INVESTMENT IN AFRICA
Our research points to three main economic benefits to Africa from Chinese investment
and business activity: job creation and skills development, transfer of new technology and
knowledge, and financing and development of infrastructure:
At the more than 1,000 companies we talked to, 89 percent of employees were
African, adding up to more than 300,000 jobs for African workers. Scaled up across all
10,000 Chinese firms in Africa, these numbers suggest that Chinese-owned business
already employ several million Africans.
Nearly two-thirds of Chinese employers provide some kind of skills training.
In companies engaged in construction and manufacturing where skilled labor is a
necessity, half offer apprenticeship training.
Half of Chinese firms have introduced a new product or service to the local market, and
one-third have introduced a new technology. In some cases, Chinese firms have lowered
prices for existing products and services by as much as 40 percent through improved
technology and efficiencies of scale.
Chinese construction contractors command around 50 percent of Africa’s international
engineering, procurement, and construction (EPC) market. African government
officials overseeing infrastructure development for their countries cited Chinese firms’
efficient cost structures and speedy delivery as major value-adds.
Chinese firms contribute On balance, we believe that China’s growing involvement is a strong net positive for
to African economies— Africa’s economies, governments, and workers. But there are areas that need significant
but they can do more. improvement:
89% of employees
are African
By value, only 47 percent of the Chinese firms’ sourcing was from local African firms,
representing a lost opportunity for local firms to benefit from Chinese investment.
of firms provide
64% training Only 44 percent of local managers at the Chinese-owned companies we surveyed were
African, though some Chinese firms have driven their local managerial employment
of managers
44% are African
above 80 percent. Other firms could follow suit.
There have been instances of major labor and environmental violations by Chinese-
owned businesses. These range from in inhumane working conditions to illegal
extraction of natural resources including timber and fish.
In some cases, Chinese firms have lowered prices for
existing products and services by as much as 40 percent
through improved technology and efficiencies of scale.
Executive summary 11© Lin Qi
4 DIFFERENT DANCES: FOUR WAYS AFRICAN COUNTRIES
ARE ENGAGING WITH CHINA
We focused our research on eight large African economies, and we found four distinct
archetypes of the Africa-China partnership:
Robust partners. Ethiopia and South Africa have a clear strategic posture toward China,
along with a high degree of economic engagement in the form of investment, trade, loans,
and aid. For example, both countries have translated their national economic development
strategies into specific initiatives related to China, and they have also developed important
relationships with Chinese provinces in addition to with Beijing. As a result, China
sees these African countries as true partners: reliably engaged and strategic for China’s
economic and political interests. These countries have also created a strong platform for
continued Chinese engagement through prominent participation in such forums as the
Belt and Road initiative (previously known as One Belt, One Road), and they can therefore
expect to see ongoing rapid growth in Chinese investment.
Solid partners. Kenya, Nigeria, and Tanzania do not yet have the same level of engagement
with China as Ethiopia and South Africa, but government relations and Chinese business
and investment activity are meaningful and growing. These three governments recognize
China’s importance, but they have yet to translate this recognition into an explicit China
strategy. Each has several hundred Chinese firms across a diverse set of sectors, but
this presence has largely been the result of a passive posture relying on large markets or
historical ties; much more is possible with true strategic engagement.
Unbalanced partners. In the case of Angola and Zambia, the engagement with China has
been quite narrowly focused. In Angola’s case, the government has supplied oil to China
in exchange for Chinese financing and construction of major infrastructure projects—but
market-driven private investment by Chinese firms has been limited compared with other
12 Dance of the lions and dragons: How are Africa and China engaging, and how will the partnership evolve?African countries; only 70 to 75 percent of the Chinese companies in Angola are private,
compared with around 90 percent in other countries. Zambia’s case is the opposite: there
has been major private-sector investment but not enough oversight from regulatory
authorities to avoid labor and corruption scandals.
Nascent partners. Côte d’Ivoire is at the very beginning of developing a partnership with
China, and so the partnership model has yet to become clear. The country’s relatively small
number of Chinese investors are focused on low-commitment sectors such as trade.
5 THE $440 BILLION OPPORTUNITY: UNLOCKING THE FULL
POTENTIAL OF THE AFRICA-CHINA PARTNERSHIP
One thing is clear to those who are closest to the Africa-China relationship: it will grow.
We interviewed more than 100 senior African business and government leaders, and nearly
all of them said the Africa-China opportunity is larger than that presented by any other
foreign partner—including Brazil, the European Union, India, the United Kingdom, and the
United States.
But exactly how quickly will the Africa-China relationship grow in the decade ahead? We
see two potential scenarios. In the first, the revenues of Chinese firms in Africa grow at a
Chinese firms can healthy clip to reach around $250 billion in 2025, from $180 billion today. This scenario
expand into would simply entail “business as usual,” with Chinese firms growing in line with the
5 new sectors: market, holding their current market shares steady as African economies expand. Under
this scenario, the same three industries that dominate Chinese business in Africa today—
Agriculture manufacturing, resources, and infrastructure—would dominate in 2025 as well.
Banking and
insurance We believe much more is possible: in a second scenario, Chinese firms in Africa could
dramatically accelerate their growth. By expanding aggressively in both existing and
Housing new sectors, these firms could reach revenues of $440 billion in 2025. In this accelerated
growth scenario, not only do the three established industries of Chinese investment
ICT and tele-
communications grow faster than the economy, but Chinese firms also make significant forays into five
new sectors: agriculture, banking and insurance, housing, information communications
Transport and
technology (ICT) and telecommunications, and transport and logistics. This expansion
logistics
could start with Chinese firms moving into sectors related to the ones they currently
dominate—for example, from construction into real estate and housing. Another part of
this accelerated growth could come from Chinese firms more fully adapting their formulas
that have proved successful in China to markets in Africa, including business models in
consumer technology, agriculture, and digital finance.
There is considerable upside for Africa if Chinese investment and business activity
accelerate. At the macroeconomic level, African economies could gain greater capital
investment to boost productivity, competitiveness, and technological readiness, and tens of
millions more African workers could gain stable employment. At the microeconomic level,
however, there will be winners and losers. Particularly in sectors such as manufacturing,
where African firms lag behind global productivity levels, African incumbents will need to
dramatically improve their productivity and efficiency to compete—or partner effectively—
with the new dragons on their turf.
Executive summary 13Exhibit E1
Dance of the lions and dragons:
How are Africa and China engaging, and how will the partnership evolve?
Foreign direct
#1 Trade partner
#1 Infrastructure
financier #1 investment
growth
#3 Donor
10,000+ 30%+ ~90%
Chinese firms Chinese firms in Private-owned
in Africa manufacturing Chinese businesses
89% Local employees $440 billion Africa-China
opportunity
by 2025
Ten recommendations to accelerate the Africa-China partnership:
1 6
Define China strategy Chinese firms:
Explore brownfield
2 African Chinese growth options
Build China-capable governments government
bureaucracy 7
1 2 3 4 5
African firms: Decide
3 where and how to
Open government 9 play
financing to private 10 8
Chinese firms
African firms:
4 Drive step-change
in productivity
Extend responsible
business guidelines to
Private sector 9
private Chinese firms
6 7 8 Establish agriculture
5 demand deal
Use results-based aid
approaches 10
Switch to PPP1
model for
1 Public-private partnerships. infrastructure
SOURCE: McKinsey analysis
14 Dance of the lions and dragons: How are Africa and China engaging, and how will the partnership evolve?For the foreseeable future, the dragons are here to stay. And with continued and likely growing Chinese involvement, it will become ever more urgent to address the gaps in the partnership, including a greater role for African managers and partners in the growth of Chinese-owned businesses. Moreover, both Chinese and African actors will need to address three major pain points: corruption in some countries, concerns about personal safety, and language and cultural barriers. In five of the eight countries in which we conducted fieldwork, 60 to 87 percent of Chinese firms said they paid a “tip” or bribe to obtain a license. After corruption, the second-largest concern among Chinese firms is personal safety. For their part, our African interviewees described language and cultural barriers that lead to misunderstanding and ignorance of local regulations. If these problems are left unaddressed, the misunderstandings and potentially serious long-term social issues could weaken the overall sustainability of the Africa-China relationship. Everyone—African or Chinese, government or private sector—has a role to play in realizing the promise of the Africa-China partnership. We suggest ten recommendations, consisting of actions to be taken by African and Chinese businesses and governments, to ensure the Africa-China relationship grows sustainably and delivers strong economic and social outcomes (see Exhibit E1). In the words of one of the many Chinese entrepreneurs we interviewed across Africa, “There is a wise saying in Yoruba: should I wash my left hand or my right hand? The answer is that the right hand should wash the left, and the left hand should wash the right. That is the way to do things. Africa is one hand; China is the other. Working together is the way to do things.” Executive summary 15
Chapter 1

THE DRAGON HAS LANDED:
AFRICA’S BIGGEST ECONOMIC
PARTNER

             Idan kidi ya chanza,
             rawan ma zai chanza
             When the music changes, so must the dance
             			       —Hausa proverb (West Africa)

16
A decade ago, one might have been excused for characterizing the
Africa-China relationship as little more than a sideshow. Trade and
investment between Africa and China lagged behind that of Africa’s
traditional Western partners. African countries’ loan portfolios
were owed to the likes of the World Bank and the Paris Club. And
the Chinese migrating to Africa, who spoke little English, French,
Portuguese, or Swahili, seemed ill-equipped to ever make a real
dent on local economies.
But then, as thousands of Chinese traders opened “China shops”—small retail shops run
by Chinese traders—across the continent, 35 African heads of state showed up in Beijing in
2006 for the Forum on China-Africa Cooperation (FOCAC). Although FOCAC was founded
six years previously, this was the first time the majority of African heads of state attended.
Chinese firms invested in the largest steel plant in West Africa, the largest ceramic tile
factory in East Africa, and the largest bank in all of Africa. The Chinese telecommunications
giants Huawei and ZTE built most of Africa’s telecoms infrastructure. Chinese contractors
built the $1.2 billion Tanzania Gas Field Development Project in 2015; the $3.4 billion,
750-kilometer Ethiopia-Djibouti Railway in 2016; and the $3.8 billion, 750-kilometer
Standard Gauge Railway in Kenya in 2017.2
In merely a decade, China has become Africa’s most important economic partner. There
is no other country with such depth and breadth of engagement in Africa across the
dimensions of trade, investment, infrastructure financing, and aid. Chinese “dragons”—
firms of every size and sector—are bringing capital investment, management know-how,
and entrepreneurial energy to every corner of the continent—and in so doing they are
helping to accelerate the progress of Africa’s “lions,” as its economies are often referred to.
Yet to date, it has been challenging to understand the full extent of the Africa-China
economic relationship due to a paucity of data (see Box 1, “Why is the Africa-China economic
relationship so poorly understood?”). Into the data vacuum have poured urban legends and
© Yiming Gui
sensational stories—everything from charges of neocolonialism to a persistent yet unfounded
rumor that Chinese firms use convict labor en masse. Because of this knowledge gap, it is
difficult for public- and private-sector leaders—in both Africa and China—to make informed
decisions on how best to strengthen collaboration, attract investment, and harness those
investments for business success and sustainable economic development.
This report aims to dispel the myths and provide a fact-based picture of the Africa-China
economic relationship. Its foundation is a new large-scale data set, including on-site
interviews with the owners or managers of more than 1,000 Chinese firms spread over
eight of sub-Saharan Africa’s largest economies. These interviews, conducted in Chinese,
included a detailed survey that uncovered a rich layer of previously unknown information
on informal financial flows, local management practices, job-creation numbers, business
expansion plans, perceptions of barriers such as crime and corruption, and much more
(see Box 2, “Behind the numbers: McKinsey’s large-scale data-gathering effort on Chinese
2 China Investment, Africa version, Ministry of Commerce of the People’s Republic of China (MOFCOM).
17business and investment in Africa”). Alongside our own research, we analyzed more than
70 existing data sets and source documents.
THE DEEP ROOTS OF THE AFRICA-CHINA RELATIONSHIP
The expansion of Chinese business and investment in Africa is akin to that of a bamboo
plant: from modest beginnings, it has shot up at record speed. As with bamboo, that growth
Chinese firms’ 1968–76
springs from long-established roots. Although the Chinese naval explorer Zheng He sailed
construction of the
to the east coast of Africa in the 15th century, China’s modern ties with Africa date back to
Tan-Zam Railway cost
the earliest years of African independence in the 1950s and 1960s, when leaders such as
$3 billion President Julius Nyerere of Tanzania turned to China to build “Third World solidarity.” One
concrete expression of that early cooperation was China’s 1968–76 construction of the Tan-
in today’s money.
Zam Railway, which linked landlocked Zambia with the Port of Dar es Salaam in Tanzania.
Britain, Japan, West Germany, and the United States, as well as the United Nations (UN)
and the World Bank, had all declined to fund the project, deeming it financially unviable.3
Only China—at the time poorer than both Tanzania and Zambia—agreed to fund it, to the
tune of $3 billion in today’s money. Mao told Nyerere, “To help you build the railway, we are
willing to forsake building railways for ourselves.”4
3 Deborah Brautigam, The dragon’s gift: The real story of China in Africa, Oxford University Press, 2009; Jamie Monson,
“Freedom railway: The unexpected successes of a Cold War development project,” Boston Review, December 1, 2004.
4 “Revisit the Chinese-aid Tanzania-Zambia Railway: Poorly maintained and operated,” Xinhua News Agency, 2010.
Box 1
Why is the Africa-China economic relationship so poorly understood?
Until now, the true extent of the Loans. Despite announcements Whether due to language barriers
Africa-China economic relationship every few months about major or the sheer speed at which Africa-
has been poorly understood because bilateral loans, there is no reliable China relations have evolved over
the data in the field is patchy, at database about the true level of the past decade, statisticians and
best, and often inaccurate. This Chinese lending by African recipient analysts have simply not been able to
information deficiency is consistent country. keep up. Existing studies tend to be
across every major area of global based on small samples and focused
flows, including: Aid. China’s lack of a central aid on particular industries or countries,
agency and its unique definition of meaning there is no comprehensive
Companies and investments. aid—one that differs from standards picture of Chinese investment across
Previous data sets have tended to set by the Organisation for Economic the continent.
focus disproportionately on state- Co-operation and Development
owned enterprises (SOEs) and on (OECD)—make comparisons with 1 These errors may be because global
deals with public announcements. other countries’ aid flows difficult. migration databases are built largely from
Although these investments tend to country-level census data, many of which
Migration. Existing information sets are incomplete and outdated, particularly
be some of the bigger ones by size,
with regard to information specifically about
each is only a subset of the vast on global migration flows include the
foreign migrants. Trends in international
range of business activities occurring demonstrably wrong figures of zero migrant stock: The 2015 revision, United
between China and Africa. Chinese living in Angola, as well as Nations, December 2015.
zero migrants from China to Tanzania
and Côte d’Ivoire in 2013.1
18 Dance of the lions and dragons: How are Africa and China engaging, and how will the partnership evolve?Box 2
Behind the numbers: McKinsey’s large-scale data-gathering effort on Chinese business
and investment in Africa
In 2016 and 2017, a team from and business leaders across the groups, country-level investment
McKinsey’s Africa and China offices continent on topics ranging from their promotion agency lists, and company
fanned out across eight countries China strategies to their perceptions registration lists. We merged these
to conduct comprehensive, large- of Chinese investors. Finally, we data sets—comparing Chinese
scale research on Chinese business interviewed around 30 other Chinese names against English ones and
in Africa. We conducted face-to- leaders and global experts. eliminating double-counting of parent
face interviews and surveys of and subsidiary companies—to create
1,073 Chinese firms across eight The Chinese firms we surveyed a holistic view of Chinese investments
countries—Angola, Côte d’Ivoire, spanned a diversity of industries, in Africa.
Ethiopia, Kenya, Nigeria, South including manufacturing, services,
Africa, Tanzania, and Zambia—that construction and real estate, and We should point out several caveats
make up approximately two-thirds trading. They also included large, in our methodology. First, some of
of sub-Saharan Africa’s gross midsize, and small businesses; while our analysis is based on self-reported
domestic product (GDP) and around 28 percent of the firms in our sample data, which could be biased.
50 percent of Chinese foreign direct employ more than 100 people each, Second, although we believe our
investment (FDI) to Africa. The nearly half employ between 10 and sample of more than 1,000 Chinese
survey covered the companies’ 100 people, and 21 percent employ firms (spread across countries,
primary business activities, funding fewer than 10. sectors, and sizes) is statistically
sources, motivations for investing robust for the conclusions of this
As we surveyed Chinese firms across report, some of the pan-African
in Africa, key challenges, and future
the eight countries, we also collected analyses are extrapolations.
expansion plans. To supplement
highly localized data sets such as
that research, we also interviewed
business-association membership
104 senior African government
lists, information on regional business
But China was also getting something concrete out of its friendships in Africa. For more
than two decades after the Communist Party came into power in mainland China in 1949,
the People’s Republic of China was not recognized by the UN. Instead, Taiwan held the
coveted seat on the UN Security Council. When UN member states voted to return that seat
to China in 1971, 26 of 76 votes came from African nations. By the 1990s, around 90 percent
of African countries recognized the People’s Republic of China. Those relations created
fertile ground for China’s “Going Out” policy, launched in 1999, which encouraged Chinese
enterprises to invest abroad.
China’s links with Africa were further strengthened in 2000 with the launch of FOCAC.
In recent meetings, more than 50 African heads of state and top Chinese leadership have
gathered in Beijing or African capitals to discuss ways to deepen trade and cooperation.
More recently, China’s Belt and Road initiative (previously known as One Belt, One Road),
launched in 2013 and showcased on the global stage with a summit in Beijing in May 2017,
has created new policies and funding to deepen investment, infrastructure, and trade ties
across Eurasia and Africa. Finally, China’s growing involvement on the world stage has been
accompanied by its leadership creating three new global-development finance institutions:
the $100 billion Asian Infrastructure Investment Bank (AIIB), the $100 billion New
The dragon has landed: Africa’s biggest economic partner 19Development Bank (NDB, formerly known as the BRICS Bank), and the $40 billion Silk
Road Fund.
AFRICA’S BIGGEST ECONOMIC PARTNER
Since the turn of the 21st century, China has catapulted from being a relatively small
investor in the continent to becoming Africa’s biggest economic partner. Africa-
China trade increased from $13 billion in 2001 to $188 billion in 2015—an average annual
growth rate of 21 percent. FDI has grown even faster, from $1 billion in 2004 to
$35 billion in 2015, according to official figures. This represents a breakneck average
annual growth rate of 40 percent. 5
We evaluated Africa’s economic partnerships with the rest of the world across five
dimensions: trade, investment stock, investment growth, aid, and infrastructure financing
(Exhibit 1). China is in the top five partners for Africa on all five dimensions. This is true for
no other country. Neither the Western partners such as France, the United Kingdom, and
5 The trade and investment figures cited in this report are derived from International Trade Centre (ITC) Trade Map, United
Nations Conference on Trade and Development (UNCTAD), and the 2015 Statistical bulletin of China’s outward foreign
direct investment, MOFCOM, National Bureau of Statistics (NBS) of the People’s Republic of China, and the State
Administration of Foreign Exchange (SAFE). Unless otherwise stated, the increases cited are in nominal terms.
China/Africa exhibit 1
Exhibit 1
China is now Africa’s biggest economic partner.
Infrastructure
Goods trade, 2015, FDI stock, 2014E,1 FDI growth, Aid, 2015,3 financing, 2015
$ billion $ billion 2010–14,2 % $ billion $ billion
United United
1 China 188 79 China 25 104 China 21
States States
United South United Arab
2 India 59 71 13 7 France 3
Kingdom Africa Emirates
United
3 France 57 France 70 11 China 6 Japan 2
Kingdom
United United United
4 53 China 32 10 6 Germany 1
States States Kingdom
South
5 Germany 46 30 France 6 Germany 4 India 1
Africa
China
ranks
#1 #4 #1 #3 #1
1 Estimated according to compound annual growth rate (CAGR) from 2009 to 2012.
2 For countries other than China, we made projections using historical data.
3 Office of Development Assistance (ODA) and Other Official Flows (OOF), 2015 for Organisation for Economic Co-operation and Development (OECD)
countries, 2012 for China.
4 According to United States Agency for International Development data, US foreign aid to Africa was $11.9 billion in fiscal year 2015 and $7.4 billion
in fiscal year 2016. The discrepancy with OECD data shown here is likely due to the fact that US fiscal years start in October, whereas OECD data is for
calendar years.
SOURCE: Bilateral trade database, International Trade Centre Trade Map, 2015; Bilateral FDI database, United Nations Conference on Trade and Development,
2012; Statistical Bulleting of China’s Outward Foreign Direct Investment, Ministry of Commerce of the People’s Republic of China, National Bureau of Statistics
of the People’s Republic of China, State Administration of Foreign Exchange, 2015; “Total official flows by country and region (ODA+OOF),” Organisation for
Economic Co-operation and Development statistics, 2015; “Foreign Aid Explorer: The official record of U.S. foreign aid,” USAID; “Infrastructure Financing
Trends in Africa—2015,” The Infrastructure Consortium for Africa, 2015
20 Dance of the lions and dragons: How are Africa and China engaging, and how will the partnership evolve?$188 billion the United States, nor major developing countries such as India and Brazil, match China
in the depth and breadth of its involvement in Africa. Make no mistake: China is already
Total goods trade Africa’s biggest economic partner.
between Africa and China
in 2015—triple that A closer look at the numbers within each type of flow—trade, FDI, aid, infrastructure finan-
of Africa’s next-biggest cing, and loans—shows the significant ways that Chinese government and firms are engaging
trade partner. in Africa.6
Africa-China trade dwarfs that of Africa’s other trade partners
China has far surpassed Africa’s longstanding trade partners such as France, Germany,
India, and the United States (Exhibit 2). In 2015, total goods trade between China and
Africa amounted to $188 billion—more than triple that of India, Africa’s next-biggest
trade partner. China made up 20 percent or more of 16 African countries’ exports in 2014;
for Angola, China is the destination for half of exports.7 And while Africa imports largely
manufactured goods from China, its exports to China consist of resources such as oil
and minerals, as well as semiprocessed raw materials. Thus the trade balance fluctuates
6 Comparable loan information was not available across countries, hence the exclusion of loans from Exhibit 2.
7 Valentina Romei, “China and Africa: Trade relationship evolves,” Financial Times, December 3, 2015.
China/Africa exhibit 2
Exhibit 2
China is Africa’s largest trade partner.
Africa’s top goods trade partners, Africa’s trade balance with China,
$ billion, 2015 $ billion, 2007–16
Imports Exports
28
China 188
23
20
India 59
France 57 7 6
5
United
53
States –1
–4
Germany 46
Spain 45
Italy 42
South Africa 32 –36
–39
United
29
Kingdom
2007 2008 2009 2010 2011 2012 2013 2014 2015 2016
Netherlands 29
SOURCE: Bilateral trade database, International Trade Centre Trade Map, 2015
The dragon has landed: Africa’s biggest economic partner 21according to commodity prices: when commodity prices are high, Africa runs an even
balance or even a surplus, but when commodity prices dip, as they did in 2015, Africa runs a
trade deficit.
China is poised to become Africa’s largest source of FDI
At current growth rates, China will be Africa’s largest source of FDI stock within the
next decade. A country-level view shows that the growth in Chinese investment has been
uniformly high, at an average growth rate of more than 52 percent a year in Ethiopia, 59
percent a year in South Africa, and 89 percent a year in Angola from 2004 to 2014 (Exhibit 3).
In fact, our research finds that China’s financial flows to Africa are around 15 percent larger
than previous estimates. This discrepancy is found because official figures, which rely on
banking-system data, do not cover informal money-transfer methods often used by smaller
businesses. These methods include “mirror transfers,” in which a local payment is made into
the Chinese account of an associate or family member, who in turn makes a local equivalent
payment in Africa to the beneficiary’s bank account. Our interviews of more than 1,000
China/Africa exhibit 3
Exhibit 3
Across eight selected countries, FDI growth from China is consistently high, ranging from 16 to 89 percent per year.
FDI stock from China
$ million, official cross-border flows only
2004 2014 5,954
+59%
p.a.
2,323 2,272
1,214
+41%
p.a.
915 885 +31%
854
p.a.
+89%
p.a.1 +52% +32%
+41%
p.a. p.a. 148
p.a.
+16%
p.a. 64 76 59 54
14 14 28
2
Country Angola Côte d’Ivoire Ethiopa Kenya Nigeria South Africa Tanzania3 Zambia
China's
FDI
ranking2 4 5 1 2 4 5 8 4
1 Per annum.
2 Based on 2012 foreign domestic investment (FDI) figures.
3 Tanzania ranking is based off 2011 figures due to unavailability of 2012 data.
SOURCE: Bilateral FDI database, United Nations Conference on Trade and Development, 2012; Statistical Bulletin of China’s Outward Foreign Direct
Investment, Ministry of Commerce of the People’s Republic of China, National Bureau of Statistics of the People’s Republic of China, State Administration of
Foreign Exchange, 2015; “Total official flows by country and region (Official Development Assistance and Other Official Flows),” Organisation for Economic
Co-operation and Development statistics, 2015
22 Dance of the lions and dragons: How are Africa and China engaging, and how will the partnership evolve?China/Africa exhibit 4
Exhibit 4
Chinese FDI stock in Africa has grown from nearly zero to ~$50 billion in a decade.
FDI stock,
$ billion
49
6 +15%
35 Estimate of
+40% previously
p.a.1 uncaptured
flows
42
13
1
2004 2010 2015 2016E2
1 Per annum.
2 Estimated using a five-year compound annual growth rate, which is 21% per annum for five years (2011–15).
SOURCE: Bilateral FDI database, United Nations Conference on Trade and Development, 2012; McKinsey field survey
of Chinese firms in eight African countries, November 2016–March 2017
Chinese firms find that this money-transfer process is ubiquitous as a way for smaller firms
$21 billion to avoid China’s currency controls. Although the average transaction size is small, the total is
sizeable, pushing Chinese FDI stock into Africa to an estimated $49 billion in 2016 (Exhibit 4).
Chinese commitments
to African infrastructure China is the second- or third-largest country donor to Africa
in 2015. Chinese official development assistance (ODA) and other official flows (OOF) to Africa
together amounted to $6 billion in 2012 (Exhibit 1). China does not report aid figures
according to the definitions of the Organisation for Economic Co-operation and
Development (OECD), so we estimate China’s aid based on an analysis that parsed China’s
aid disbursements in 2012 according to OECD definitions, hence making them comparable
with other countries’ aid activities.8 In contrast to Western donors such as the European
Union and the United States, which provide aid primarily in the form of grants, Chinese aid
centers heavily on concessional loans for infrastructure and export credits.
China is the single-largest bilateral infrastructure financier
in Africa
In 2015, Chinese commitments to infrastructure in Africa amounted to $21 billion
(Exhibit 1)—more than the combined total of the Infrastructure Consortium for Africa,
whose members include the African Development Bank, the European Commission, the
European Investment Bank, the International Finance Corporation, the World Bank,
and the Group of Eight (G8) countries. Chinese infrastructure commitments grew at
8 An age of choice for development finance, Overseas Development Institute (ODI), 2016.
The dragon has landed: Africa’s biggest economic partner 23an average annual rate of 16 percent from 2012 to 2015 and supported many of Africa’s
most ambitious infrastructure developments.9 For example, China EXIM Bank financed
more than 90 percent of the $3.8 billion Mombasa-Nairobi Standard Gauge Railway
in Kenya, while Chinese institutions also financed most of the $1.7 billion Karuma
Hydroelectric Power Station in Uganda.10 Chinese contractors today account for nearly
half of Africa’s international engineering, procurement, and construction (EPC) market.11
Six of the ten largest international EPC contractors operating in Africa are Chinese:
China Communications Construction, China Railway Group, Sinohydro Group, China
State Construction Engineering Corporation, China Railway Construction Corporation,
and Citic Construction Company.12 A recent large-scale public opinion survey found
that infrastructure development is African citizens’ most appreciated aspect of Chinese
involvement in Africa.13
9 Comparable data is not available for earlier years.
10 “Top ten African projects with concession loan from China,” Chinese investment Africa version.
11 ENR 225 data on Chinese Contractors’ Global Market, Engineering News-Record, 2016.
12 Based on contracting revenue of top players obtained outside of home country as reported by Engineering News
Record, ENR Global Sourcebook 2014, IPAT version 3.0.
13 Mogopodi Lekorwe et al., China’s growing presence in Africa wins largely positive popular reviews, Afrobarometer, 2016.
© Lin Qi
24 Dance of the lions and dragons: How are Africa and China engaging, and how will the partnership evolve?China’s loan issuance to Africa has tripled since 2012
New debt issuance by Chinese institutions to African governments increased dramatically
in the past five years, rising to some $5 billion to $6 billion of new loan issuances each
year in the 2013–15 period.14 We estimate that in 2015, these loans accounted for
approximately one-third of new sub-Saharan African government debt. Most of these
loans are linked to infrastructure projects, such as China EXIM Bank’s $3.6 billion loan to
finance the Mombasa-Nairobi Standard Gauge Railway in Kenya.15
These macroeconomic numbers tell a dramatic story of the rapid rise of Chinese
business and investment in Africa. But there’s a microeconomic story as well about the
entrepreneurs behind those numbers. As we show in the next chapter, thousands of
Chinese businesses have set up shop and invested across Africa over the past decade.
Their scale, diversity, growth rates, and ambitions for the future are much greater than
most observers have assumed.
14 Chinese loans to Africa, 2000–2014, Johns Hopkins School of Advanced International Studies (SASI), China-Africa
Research Initiative (CARI).
15 China EXIM Bank website.
The dragon has landed: Africa’s biggest economic partner 25Chapter 2
TEN THOUSAND BUSINESS
BUILDERS: CHINESE FIRMS’
DIVERSIT Y, SCALE, AND AMBITION
Mchumia juani,
hulia kivulini
He who toils in the sun, feasts under the shade
—Swahili proverb (East Africa)
26China’s economic engagement with Africa has grown to impressive
scale at rapid speed, as is clear from the overall trade and
investment numbers set out in the previous chapter. But it would
be a mistake to characterize this burgeoning relationship as a
coordinated push by a monolithic “China, Inc.”—or even as a
concerted, coordinated push dominated by a handful of state-
owned enterprises (SOEs). Certainly, the SOEs have played a
critical role in a few sectors such as natural resources, but in most
sectors the rapid rise of China’s business presence in Africa has
been driven by a remarkably diverse group of mostly privately
owned firms, each agile and aggressive in finding profitable market
niches in Africa.
The fact that Chinese firms have flocked in such large numbers to Africa is indicative
that we are in an era of complementarity between the Chinese entrepreneurial class and
Africa’s market conditions. Market returns in Africa are high, but in many cases they’re also
risky, requiring a certain comfort level with unpredictable developing-market conditions.
And China’s entrepreneurial class, fresh from a three-decade run of building China in a
similarly fast-paced and uncertain market environment with evolving institutions, has the
risk tolerance, practical experience, and skill set to undertake such investments. With this
structural similarity between the China of a generation ago and Africa today, it is no wonder
that so many dragons are now finding their next home in Africa.
TEN THOUSAND DRAGONS
Our research shows that there are many more Chinese enterprises operating in Africa than
previously estimated. In the eight African countries we focused on, the number of Chinese-
owned firms was between double and nine times the number registered by China’s Ministry
of Commerce (MOFCOM), until now the largest database of Chinese firms in Africa. Our
tally of Chinese firms outstripped those of the African countries’ investment authorities
© Lin Qi
by similar multiples (Exhibit 5). Extrapolated across the continent, these findings suggest
there are more than 10,000 Chinese-owned firms operating in Africa today.
NO SINGLE “CHINA, INC.”—THE REALITY IS A HUGE
DIVERSITY OF ENTERPRISES
Much has been written about what essentially can be summed up as “China, Inc.”—
a supposedly coordinated effort by Chinese companies, primarily SOEs supported or
coordinated by the government, to buy up resources around the globe.16 But the
China, Inc. stereotype was never accurate. China’s companies, government agencies,
and financial institutions are a complex set that often reflects multiple interests and
uncoordinated agendas.17
16 The term “China, Inc.” seems to have been coined by US author Ted Fishman in his bestselling book China, Inc.: How
the rise of the next superpower challenges America and the world, Simon & Shuster, 2006.
17 Erica Downs, “Whatever became of China, Inc.?” China Economic Quarterly, June 2014.
27Our research debunks the idea of a monolithic China, Inc. in Africa, as we found that there
are far too many enterprises for any suggestion of homogeneity to be plausible. While major
infrastructure projects by Chinese SOEs might grab the headlines, the reality is that around
90 percent of the 10,000 or so Chinese businesses in Africa are privately owned (Exhibit 6).
Although SOEs tend to make high-value investments, the sheer number of private firms
China/Africa exhibit 5
Exhibit 5
We estimate that there are more than 10,000 Chinese firms operating in Africa.
Number of Chinese firms in fieldwork countries MOFCOM1
Local investment authority
113 2.2× Fieldwork total
Angola N/A2
248
Across our eight countries, we found 3.7 times the
total number of firms than the previous largest
30 9.1× pan-African database of Chinese firms suggested.
Côte d’Ivoire N/A2 4.3×
274
161 4.3×
Ethiopia 567 1.2×
689
3.0×
131
Kenya 207 1.9×
396
2.9×
317
Nigeria 301 3.1×
920
210 2.9×
South Africa 83 7.3x
608
5.2×
159
Tanzania 207 4.0x
825
198 4.3×
Zambia N/A2
861
1 Ministry of Commerce, People’s Republic of China.
2 Data on the number of Chinese firms from Angolan, Ivorian, and Zambian investment authorities were not available.
SOURCE: MOFCOM database; McKinsey field survey of Chinese firms in eight African countries, November 2016–March 2017
28 Dance of the lions and dragons: How are Africa and China engaging, and how will the partnership evolve?China/Africa exhibit 6
Exhibit 6
Most Chinese firms in Africa are private, not state-owned enterprises.
% of firms by ownership
~75
~80
Private ~95 ~92 ~90 ~90 ~90 ~90
State- ~25
owned ~20
enterprises ~5 ~8 ~10 ~10 ~10 ~10
Nigeria Tanzania Côte Ethiopia South Zambia Kenya Angola
d’Ivoire Africa
NOTE: Numbers may not sum due to rounding.
SOURCE: McKinsey field survey of Chinese firms in eight African countries, November 2016–March 2017
mean that their investment total equals that of SOEs. Even in Angola, where Chinese SOEs
play a particularly prominent role in the local economy, our research shows that three-
quarters of Chinese firms operating in the country are privately owned.
Of surveyed Chinese Moreover, Chinese firms operate across many sectors of the African economy. Our research
firms in Africa, finds that 31 percent of Chinese firms in Africa are involved in manufacturing, 25 percent
in services, 22 percent in trade, and 15 percent in construction and real estate (Exhibit 7).
31% are in
manufacturing Many are active in more than one sector. These enterprises’ focus areas, business models,
and customer value propositions are as diverse as the entrepreneurs who founded them (see
are in
25% services
Box 3, “All shapes and sizes: The diversity of Chinese business in Africa”).
are in DRAGONS GROWING AND FLYING
15% construction
Despite the many diverse African sectors in which Chinese firms are investing, two deserve
and real estate
special mention here: manufacturing, and construction and real estate. In these sectors,
Chinese-owned firms have rapidly achieved a sizeable market share (Exhibit 7). In many
cases, Chinese firms were more aggressive than incumbent and other foreign firms in
pursuing market opportunities. Indeed, while some slumbered, the dragons flew.
In manufacturing, we estimate that Chinese firms already handle 12 percent of Africa’s
industrial production—valued at some $500 billion a year in total. This significant share
reveals a relocation of some of China’s manufacturing might to Africa, with Chinese
manufacturing executives increasingly drawn to Africa’s relatively high margins for a range
of manufactured goods. However, unlike in China, Chinese factories in Africa are largely
serving domestic markets; 93 percent of the revenues of manufacturers we spoke to came
Ten thousand business builders: Chinese firms’ diversity, scale, and ambition 29China/Africa exhibit 7
Exhibit 7
One-third of these firms are manufacturers, and most are private.
Chinese firms by sector Market share Annual revenues
in Africa1 in Africa
Manufacturing 31 ~12 ~$60 billion
Services1 25 ~5 ~$15 billion
Trade2 22 ~3 ~$15 billion
Construction and
15 ~50 ~$40 billion
real estate
Other3 13 ~1 ~$50 billion
1 Market share based on average revenues for service firms from our survey compared against revenues from service
firms in Africa.
2 Market share based on imports and exports between Africa and China in 2015 as reported on the ITC Trade Map.
3 Includes agriculture, utilities, oil and gas, and mining. Market share based on average revenues from our survey against
Africa revenues from such firms.
SOURCE: McKinsey field survey of Chinese firms in eight African countries, November 2016–March 2017; Bilateral trade
database, International Trade Centre Trade Map, 2015; Lions on the move II: Realizing the potential of Africa’s
economies, McKinsey Global Institute, 2016
from local or regional sales in Africa. Although there are notable exceptions such as the
Huajian shoe factory in Ethiopia and garment factories in Lesotho, Chinese factories in
Africa are primarily focused on domestic markets.
In construction and real estate, Chinese firms’ dominance is even more pronounced,
with nearly 50 percent market share of Africa’s international EPC market.18 China’s own
breakneck pace of infrastructure construction over the past three decades has produced
contractors with some of the most efficient cost structures in the world. The Chinese
government’s financing of African infrastructure has helped Chinese contractors win some
bids, but even in open-tender projects sponsored by the World Bank, Chinese firms are the
biggest winners, winning 42 percent of contracts by value.19 African government officials
we interviewed said that the contest in such projects is not even close; one official described
Chinese firms as routinely being 40 percent cheaper than the next lowest bid for similar
levels of quality.
In addition to cost structure, Chinese construction firms have rapidly gained such market
share in part because they seem to be more committed. One CEO of a major US equipment
supply firm that has sold hundreds of millions of dollars worth of equipment to Chinese
EPC contractors in Africa told us, “I can’t get US companies to come to Africa and really
18 Engineering News-Record.
19 Jeffrey Gutman et al., Who wins World Bank-financed government contracts? Four things we learned from the data
(+ 1 lingering question), Brookings Institution, 2015.
30 Dance of the lions and dragons: How are Africa and China engaging, and how will the partnership evolve?“I can’t get US companies to come to Africa and really treat
these EPC tenders as top of mind. It’s not that I don’t
want to sell to American companies in Africa; it’s just that
by and large, they’re not here.”
—CEO of a major US equipment supply firm
treat these EPC tenders as top of mind. It’s not that I don’t want to sell to American
companies in Africa; it’s just that by and large, they’re not here.”
In both these sectors—and others—the firms we surveyed reported that their revenues were
growing rapidly. In the manufacturing, trade, and services sectors, firms reported that on
average their revenues grew by 8 to 9 percent annually from 2012 to 2015, with construction
and real-estate firms growing at around 4 percent annually. While construction and real-
estate companies remain the largest by annual revenues, at an average of $27 million per
firm in 2015, the rapid growth of firms in other sectors is creating many sizeable businesses.
The average annual revenues of the manufacturing firms in our sample, for example, stood
at $21 million in 2015.
CHINESE FIRMS ARE MAKING HEALTHY PROFITS
Among the firms we looked at, nearly a quarter said they had covered their initial
investment in one year or less, and more than half reported that they had taken three years
or less to make back their initial investment. In interviews, Chinese firms, particularly
in manufacturing, identify ample pricing headroom in Africa as a key factor in their
profitability. For example, a manufacturer in Kenya said, “I expect to make back my
investment in less than a year because the prevailing market price is so high for my product.”
One-third Indeed, factory bosses like him who are used to squeezing a quarter of a percentage point
of margin to survive in the ultracompetitive manufacturing sector in China breathe much
of surveyed Chinese easier in Africa. But we found similar stories in other industries as well: the manager of a
firms reported construction and real-estate firm said, “We started out with a small investment that we
profit margins of made back quickly, so we keep reinvesting more and more money each year.”
>20% in 2015. Nearly one-third of the Chinese firms we surveyed reported 2015 profit margins of more
than 20 percent. For several sectors for which data is available, Chinese firms’ profit
levels are significantly higher than those of other African firms.20 But the picture differs
significantly between state-owned and privately owned companies (Exhibit 8). Fewer
SOEs reported profit margins of more than 20 percent, and a quarter of them reported
losses. The lower profit margins of SOEs are likely driven by recent commodity price
drops in the energy and mining sectors, in which their presence is significant, as well as
fierce competition in the infrastructure construction sector. In addition, several of the
businesspeople we interviewed pointed out that private firms answer only to their own
profit motives, whereas SOEs also account for geopolitical considerations guided by the
Chinese government.
20 Lions on the move II: Realizing the potential of Africa’s economies, McKinsey Global Institute (MGI), September 2016.
Ten thousand business builders: Chinese firms’ diversity, scale, and ambition 31You can also read